
Optimization of Quality Consistency Problem of Electromechanical Component due to Manufacturing Uncertainties with a Novel Tolerance Design Method
2014-08-12 02:30DENGJieYEXuerong叶雪荣WANGYingqi王瑛琪ZHAIGuofu翟国富
关键词:国富
DENG Jie (邓 杰), YE Xue-rong (叶雪荣), WANG Ying-qi (王瑛琪), ZHAI Guo-fu (翟国富)
School of Electrical Engineering and Automation, Harbin Institute of Technology, Harbin 150001, China
Optimization of Quality Consistency Problem of Electromechanical Component due to Manufacturing Uncertainties with a Novel Tolerance Design Method
DENG Jie (邓 杰), YE Xue-rong (叶雪荣)*, WANG Ying-qi (王瑛琪), ZHAI Guo-fu (翟国富)
SchoolofElectricalEngineeringandAutomation,HarbinInstituteofTechnology,Harbin150001,China
The consistency problem caused by uncertainties in manufacturing process is a significant factor influencing the quality of electromechanical components. Currently, there are two approaches for reducing the influence of uncertainties. The first one is to improve the resistance capability of design scheme by using robust parameter design (RPD) method with nonlinear feature of controllable factors. The second one is to control the influence of uncertainties by using robust tolerance design (RTD) method with quality loss function, setting the optimal tolerance with the minimum total product loss as the objective. However, as for the electromechanical component, it is difficult to achieve nonlinear region owing to the restrictions of design parameters. In addition, the establishment of cost function in manufacturing process is also confronted by practical difficulties. In order to solve the quality consistency problem under the influence of manufacturing uncertainties, a novel tolerance design method was proposed for the electromechanical components. Through the experiment design and contribution rate analysis, key factors influencing the quality consistency were determined, and the tolerance allocation scheme was confirmed according to the consistency objective of quality. Then, quality distribution characteristics before and after the consistency optimization were analyzed and verified through the Monte Carlo stochastic simulation. The application result of electromagnetic relay proves the effectiveness of the method proposed in this paper.
consistency;uncertainty;electromechanicalcomponents;tolerancedesign
Introduction
Consistency of components is very important for its application. However, during the manufacturing process, influence of uncertainties on the quality of products exists objectively, and it cannot be prevented and eliminated[1]. As for electromechanical components containing mechanical structures, influence of uncertainties during the parts processing, subgroup assembling, and debugging processing is extremely significant. The manufacturing uncertainties are mainly from 5M1E, including material, machine, method, member, measurement, and environment. It may make the quality characteristics of products deviate from the central value of the theoretical design and fluctuate.
Currently in the research field of quality engineering and optimization, studies of reducing the impact of uncertainty factors and improving product robustness are roughly divided into two categories. In the first case, the robust parameter design (RPD) method is utilized to improve the resistance of design scheme against uncertainties, which focuses on choosing the levels of controllable factors, based on the nonlinear relationship between input (or parameters) and output (or characteristics)[2]. The traditional RPD method was proposed by Taguchi[3], which included orthogonal experiment design and some novel methods for analyzing the result data. Then scholars put forward kinds of improved methods. One of the most typical was response surface method (RSM), which was proposed by Hunter[4]. The RSM substantially increases the effectiveness of experimental design and data analysis in some applications when solving RPD problems. Others, such as Menberu[5], combined experimental design process with Monte Carlo procedure, which raised the statistical validity and estimation accuracy of RPD method. To overcome the limitations of Taguchi’s S/N ratio analysis, Chen[6]improved the RPD method with stochastic sequential quadratic programming. Chen and Tang[7]joined the sequential algorithms in the RPD process, and verified the optimal solution by the worst case analysis in each cycle of the optimization process, ensuring that the parameter fluctuation in the tolerance range was still satisfied with system constraints.
In the second case, the optimal tolerance allocation scheme is determined to reduce the influence of fluctuations by the robust tolerance design (RTD) method, with the objective of minimizing the total loss of the product, which is the sum of quality loss and product cost[8]. Many works have established a variety of mathematical models for the product loss function. In earlier studies by Speckhart[9]and Spotts[10], the reduction of manufacturing cost was considered as the main object in the RTD problems. Then, Taguchi[11]brought the quality loss concept into product design and production processes, and established the tolerance design model, making functional performance and fluctuation as the foundation for calculating the product loss[12]. Later, researchers combined performance fluctuations and product cost to establish an integrated loss function[13]. Jeang[14]considered set up cost, quality loss, failure cost, tolerance and mean costs for processes, and made an improvement for Taguchi loss function. Shen and Yu[15]took into account the subsequent risk-based contingent costs, and built an improved non-throw-away mathematical function to describe the product loss.
Most research subjects of the above two types of quality optimization problems are electronic systems, and the non-linearity features can be fully used to improve the robustness of the system during the parameter design. However, for electromechanical component, normally the boundary dimension is fixed and restricted by limit space. That means the parameter design value cannot take the optimal point of nonlinear effect. In addition, for different objectives, the optimal solution of the parameter value may be different, and there may be conflicts; for instance, the armature length may increase the magnetic efficiency and optimize the operation voltage, but the increase of the length may increase the weight of armature and impact the actuation time. Consequently, for electromechanical component, beyond nonlinear parameter design which can lead to a good anti-interference product, the more important thing is to ensure the quality consistency by tolerance analyzing and allocating.
Besides, during the tolerance design of electronic system, the minimum total product loss can be regarded as the optimization objective since it is easy to estimate the cost of each component. But for electromechanical component, its quality consistency is mainly influenced by processing capability. It is hard to build the relationship of cost and processing parameters.
In this paper, it aims to establish a set of methods for the quality characteristics analysis and consistency optimization of batch electromechanical component components. At first, the theoretical model of quality consistency design will be established on the basis of robust design theory. The model can be used to determine the vital design parameters that have evident impacts on the output consistency. Meanwhile, the tolerance design scheme also can be worked out with this model. Secondly, an optimization procedure for tolerance design is presented. Finally, application example is conducted with the electromagnetic relay as an example.
1 Theoretical Model for Quality Consistency Design
1.1 Consistency optimization objective function
For the manufacturing process of batch products, the basic elements of the quality distribution model mainly consist of design parameters (input element)X, noise factorZ, and quality feature (output element)Y, as shown in Fig.1. Under the impact of noise element, there may be differences between the outputyjand scheduled target. Therefore, the target of the quality consistency optimization is to lower the influence of noise elementZ(z1,z2, …,zk) on the consistency of quality featureY(y1,y2, …,ym) under the current product design planX(x1,x2, …,xn), thus to guarantee the quality level of the entire batch of products.

Fig.1 The basic elements of quality distribution model
Normally, the product manufacturing process with fixed value as the target will comply with the normal distribution, namelyxi~N(μIi,σIi). Besides, since the fluctuation of product quality featuresyjis objective and random, generally it can also be considered to follow the normal distributionN(μOj,σOj). Therefore, the quality distribution model can be transformed as shown in Fig.2.

Fig.2 The quality distribution model with manufacturing process
When the practical manufacturing is carried out according to the design scheme, it requires that the fluctuation rangeIX(σI1,σI2, …,σIn) of the design parameterX(x1,x2, …,xn) shall be smaller than the given design toleranceTX(tx1,tx2, …,txn), namely
σIi≤txi, (i=1, 2, …,n).
(1)


(2)
δjis applied to expressing the improvement output consistency, and then the consistency optimization objective function can be represented as:

(3)
1.2 Tolerance allocation objective function
The improvement of quality output consistency shall be realized by reducing the tolerance of design parameters. When determining new tolerance plan, the influencing significance of design parameterX(x1,x2, …,xn) to the quality featureY(y1,y2, …,ym) shall be considered. And the contribution rate analysis method can be used to carry out the significance analysis.
Orthogonal experimental design is employed. Three levels of each controllable factorxiwill be set, including the central valuexi0, upper limit and lower limit according to the current toleranceTX(tx1,tx2, …,txn) fluctuations. Appropriate orthogonal table shall be selected according to the number of controllable factors for generating the experiment program.

(4)
Contribution rate analysis can be conducted for the experiment resultsy1(y11,y12, …,y1k),y2(y21,y22, …,y2k), …,ym(ym1,ym2, …,ymk) of each quality featureY(y1,y2, …,ym), by using Eqs. (5) - (13).
(5)
(j=1, 2, …, m), (i=1, 2, …, n),
(6)
whereT1ji,T2jiandT3jiare the sub-sums of the experiment results (yj), corresponding to three levels ofxi.

(j=1, 2, …, m), (i=1, 2, …, n),
(7)

(j=1, 2, …, m), (i=1, 2, …, n),
(8)
(9)

(10)
whereSjilandSjiqare the monomial fluctuation quadratic sum and quadratic fluctuation quadratic sum of each testing elementxito corresponding quality characteristicyj;Sejis the sum of squared errors ofyj;Vejis the error variance ofyj; andfjis the degree of freedom of the error. If there are items which are smaller thanVejinSjilandSjiq, they shall be included intoVej, andfjshall be added by 1 for each inclusion.

(j=1, 2, …, m), (i=1, 2, …, n),
(11)

(j=1, 2, …, m), (i=1, 2, …, n),
(12)

(13)
whereρjilandρjiqare the monomial contribution rate and quadratic contribution rate of each experiment factorxito the corresponding quality characteristicyj, andρjeis the error contribution rate.

(j=1, 2, …, m)
(14)
Then the tolerances of design parameters can be reallocated by combining Eq. (14) (the significances of design parameters) and Eq. (3) (the consistency optimization objective), as Eq. (15) shows.
(j=1, 2, …, m)
(15)
It should be emphasized that if all the quadratic contribution ratesρjiqof each design parameter are smaller than the error contribution ratesρje, it means that there is linear relationship between the design parameterxiand quality characteristicyj. Then, there may be deviations when conducting tolerance allocation with the above objective function, and it shall be rewritten as Eq. (16), and its correctness will be verified in the case study later.

(16)
2 Quality Consistency Optimization Procedure
Monte Carlo random processes theory can be used for the statistical analysis of the quality distribution. At first,Nvalues of each design parameter, satisfying the normal distribution, will be generated and combined randomly to generateNvirtual samples that can reflect the product distribution characteristics. And the quality output characteristics values ofNsamples can be obtained by input-output relationship model. Then statistical analysis is carried out for the calculation result of each output characteristic, and the mean square error is used for evaluating the consistency of the corresponding design plan. In addition, the qualified product rate under such quality characteristics can be calculated with Simpson method when the qualified threshold values are set.
The robust tolerance design method is taken for optimization of quality fluctuation range. The influencing significance of each design parameter on the quality consistency should be determined, and new tolerance allocation plan can be set according to the consistency optimization objective and manufacturing feasibility.
Finally, it will check if the improved quality distribution characteristics have satisfied the allowed fluctuations range. The overall procedure is shown in Fig.3.

Fig.3 The procedure of quality analysis and optimization
3 Examples
A balanced-force electromagnetic relay is taken as the research object. Firstly the distribution characteristics of the batch products are analyzed, and then the optimization of consistency is implemented and verified by the method proposed in this paper.
3.1 Establishment of input-output relationship
The structure of balanced-force electromagnetic relay is shown in Fig.4. It is divided into electromagnetic system and mechanical system from top to bottom. The electromagnetic relay contains four main output characteristics, namely, pick-up voltage, release voltage, pick-up time, and release time. In order to establish the corresponding relationship between each design parameter and dynamic output characteristics accurately, simulation modeling method is taken.

Fig.4 Relay structure
With the central values of design parameters in design plan as an example, the simulation results of static performance are shown in Fig.5, containing the mechanical torque and electromagnetic torque under different coil voltages. Then the dynamic characteristics are calculated based on the static results.

Fig.5 The static simulation results
3.2 Quality distribution characteristics analysis
The mechanical system is chosen in this example as the object to carry out consistency analysis and tolerance allocation optimization, while the parameters of electromagnetic system always keep in the center values.
The approach of establishing the virtual batch products is to generate 1000 samples randomly according to the normal distribution characteristic in the tolerance range of each design parameter separately. Then 1000 groups of virtual plans are obtained through random combination from each sample. According to preliminary theoretical analysis, nine design parameters in mechanical system can be determined. The central values and tolerance ranges are shown in Table 1.

Table 1 Central values and tolerance ranges of design parameters in mechanical system
With the input-output relation model, the corresponding dynamic output characteristics of each virtual plan are calculated. According to the statistical analysis, the quality distribution characteristics of batch products can be obtained.
According to the performance indexes and requirements, qualified thresholds of four output characteristics are set as follows, pick-up voltage 10-14 (V), release voltage 1.5-3.5 (V), pick-up time 5.5-7.5 (ms), and release time 2-3 (ms).
Numerical integration is carried out for the samples in qualified thresholds, and the corresponding pass percentage of the four quality characteristics, as well as the total qualified products of the batch (the four indexes are all within the qualified threshold values) can be obtained.
3.3 Consistency robust design
The RTD method can quantify the influence of each design parameter on the quality consistency in the form of contribution rate, which can provide sufficient basis for appropriate allocation of tolerance plan.
3.3.1 Experiment design
According to the central value, upper limit, and lower limit of tolerance range, three levels are selected for each design parameter in the experiment design, as shown in Table 2.
According to the relative relationship between mechanical torque and electromagnetic torque in Fig.5, four working points (WP) of interaction are selected as the objectives for the RTD study. Then the test plans are calculated by the input-output model established above.

Table 2 Experimental factors and levels
3.3.2 Contribution rate analysis
The contribution rate analysis is conducted for the testing results, so as to determine, for each design parameter, the significance of influence on the consistency of objectives. The analysis results are shown in Table 3. In which,ρmis the deviation quadratic sum of mean value, and it equals zero in this example.ρAl-ρIlare the monomial fluctuation quadratic sums of each experimental factor.ρAq-ρIqare the quadratic fluctuation quadratic sums of each experimental factor.ρeis the error contribution rate.

Table 3 Results of contribution rate analysis
3.3.3 Tolerance allocation
The quadratic contribution rate analysis results of design parameters are all 0, suggesting that the input-output characteristics of the mechanical system are in linear relation. In order to verify the correctness of the improved objective function proposed in this paper, tolerance allocation and quality characteristics verification will be implemented, using the traditional objective function and the improved one respectively. With the improvement of quality consistency by 50% to 60% as the optimization goal, the tolerances of design parameters are reallocated combining the actual process capability, which is shown in Table 4.

Table 4 Tolerance allocation plan with traditional function
According to the tolerance allocation objective function, the improvement of quality consistency can be calculated theoretically. And the results are 54.57%, 57.29%, 57.19%, and 54.15% respectively for the four objectives.
3.3.4 Quality characteristics verification
The quality distribution characteristics of the tolerance allocation plan are analyzed, as shown in Fig.6 and Table 5.

(a)

(b)

(c)

(d)
It can be seen from the quality verification results that the consistency improvement degree of the tolerance allocation, which is determined through the traditional objective function, fails to reach the optimization goal, and there is still a huge gap. In the following part, the tolerance allocation is conducted with the improved objective function.

Table 5 The improvement of consistency (standard deviation) with traditional objective function
3.3.5 Verification of improved objective function
The tolerance allocation is executed using the improved objective function, as shown in Table 6. Through the theoretical calculation, the consistency improvements of four objectives are 55.29%, 59.53%, 59.42%, and 55.45% respectively.
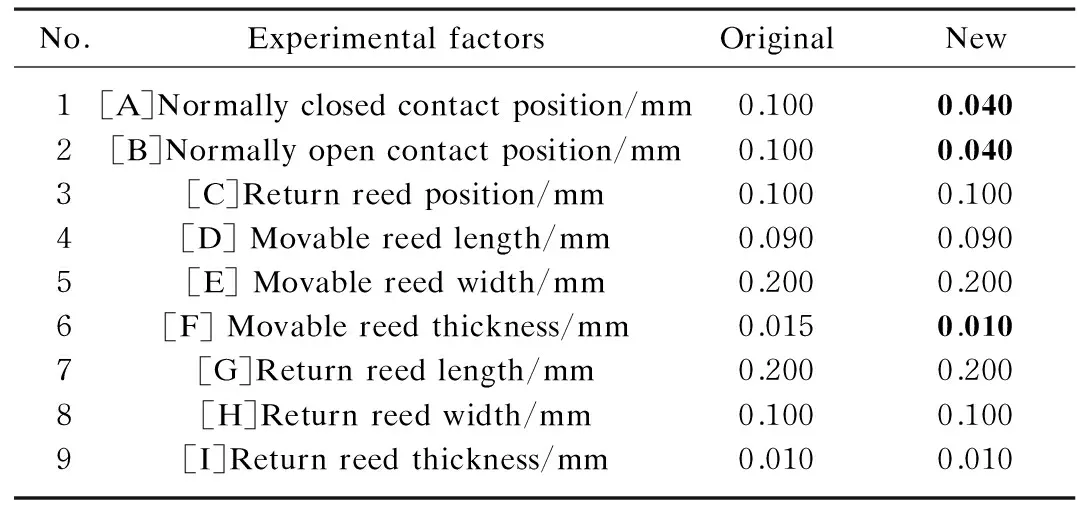
Table 6 Tolerance allocation plan with improved function
The quality characteristics verification is conducted for the tolerance allocation plan, as shown in Fig.7 and Table 7.

(a)

(b)

(c)

(d)

OutputcharacteristicsOriginal(σOj)Modified-improved(σ'Oj)Improvementofconsistency/%Pick-upvoltage/V1.88500.791058.04Releasevoltage/V1.07240.426360.25Pick-uptime/ms0.94860.395658.30Releasetime/ms0.44080.201854.22
According to the results, the consistency improvement degree reaches the goal of quality optimization. Compared the pass percentage of batch products before and after optimization using the improved objective function, the results are shown in Table 8.

Table 8 The improvement of pass percent of batch products
4 Conclusions
(1) In this paper, aiming at the product quality consistency and optimization problem of electromechanical component, a method combining the Monte Carlo analysis and RTD is proposed, which can analyze the quality distribution characteristics of design plan accurately and objectively, and then make consistency optimization. It can form a closed loop during theoretical analysis process, by verifying the validity and rationality of tolerance allocation plan, which will shorten the optimization cycle greatly and prevent the cost waste in the actual process of product.
(2) An insufficiency is pointed out in the traditional RTD method, when the tolerance allocation objective function is determined. And an improved objective function is put forward, in the case that all the analysis results of quadratic contribution rate are 0, for the supplement of RTD theory.
(3) By examples, the effectiveness of proposed method is verified in quality analysis and consistency optimization. Meanwhile, the effects of improved objective function are compared with the traditional one.
(4) In this paper, it aims to establish the entire quality analysis and optimization process exploratory. Every link in the process, such as establishment of virtual samples, analysis and evaluation of quality distribution characteristics, determination of significant design parameters and allocation of tolerance ranges, can be developed for improvement and perfection by new methods.
[1] Schu⊇ller G I, Jensen H A. Computational Methods in Optimization Considering Uncertainties-an Overview[J].ComputerMethodsinAppliedMechanicsandEngineering, 2008, 198(1): 2-13.
[2] Montgomery D C. Stu Hunter’s Contributions to Experimental Design and Quality Engineering[J].QualityEngineering, 2014, 26(1): 5-15.
[3] Taguchi G. System of Experimental Design[M]. White Plains: Kraus International Publishers, 1987: 154-160.
[4] Hunter J S. Statistical Design Applied to Product Design[J].JournalofQualityTechnology, 1985, 17(4): 210-221.
[5] Menberu L. Characterizing Performance Variation of Product Designs[J].QualityEngineering, 2003, 16(1): 105-111.
[6] Chen S P. Robust Design with Dynamic Characteristics Using Stochastic Sequential Quadratic Programming[J].EngineeringOptimization, 2002, 35(1): 79-89.
[7] Chen J Q, Tang Y F. Sequential Algorithms for Structural Design Optimization under Tolerance Conditions[J].EngineeringOptimization, 2014, 46(9): 1183-1199.
[8] Diplaris S C, Sfantsikopoulos M M. Cost-Tolerance Function: a New Approach for Cost Optimum Machining Accuracy[J].InternationalJournalofAdvancedManufacturingTechnology, 2000, 16(1): 32-38.
[9] Speckhart F H. Calculation of Tolerance based on a Minimum Cost Approach[J].JournalofEngineeringforIndustry, 1972, 94(2): 447-453.
[10] Spotts M F. Allocation of Tolerances to Minimize Cost of Assembly[J].JournalofEngineeringforIndustry, 1973, 95(3): 762-764.
[11] Taguchi G. Introduction to Quality Engineering[M]. Michigan: American Supplier Institute, 1996: 48-54.
[12] Kim Y J, Cho B R. Economic Integration of Design Optimization[J].QualityEngineering, 2000, 12(4): 561-567.
[13] Wang J S, Zhang Y F, Yu D W. Quality Control Costs in Tolerance Design[J].JournalofTsinghuaUniversity, 2001, 41(4): 69-71.
[14] Jeang A. An Integrated Determination of Production Quantity, Product and Process Parameters[J].InternationalJournalofSystemsScience:Operations&Logistics, 2014,1(1): 3-17.
[15] Shen C Y, Yu K T. Optimization of Product Design Based on a Design-Function-Oriented Cost Model: a Strategic Non-throw-Away Perspective[J].JournalofIndustrialandProductionEngineering, 2013, 30(2): 94-104.
National Natural Science Foundation of China (No. 51107012); National High-Tech Research and Development Program of China (No. 2009AA04Z110); China Postdoctoral Science Foundation (No. 2011M500057); the Fundamental Research Funds for the Central Universities, China (No. HIT.NSRIF. 2010099)
1672-5220(2014)06-0731-06
Received date: 2014-08-08
* Correspondence should be addressed to YE Xue-rong, E-mail: xuelai1981@163.com
CLC number: TM581.3 Document code: A
猜你喜欢
源流(2022年1期)2022-03-24
Plasma Science and Technology(2020年3期)2020-04-24
宁夏画报(2019年5期)2019-09-19
人民调解(2019年5期)2019-03-17
中国注册会计师(2018年4期)2018-04-23
中共乐山市委党校学报(2017年5期)2017-10-21
新高考·高一物理(2017年3期)2017-07-14
茶博览(2017年1期)2017-02-24
故事会(2015年9期)2015-05-14
河南电力(2010年10期)2010-04-08
 Journal of Donghua University(English Edition)2014年6期
- Journal of Donghua University(English Edition)的其它文章
- Effect of Starch Dodecenylsuccinylation on the Adhesion and Film Properties of Dodecenylsuccinylated Starch for Polyester Warp Sizing
- Interval Fault Tree Analysis of Excavator Variable-Frequency Speed Control System
- Combinatorial Optimization Based Analog Circuit Fault Diagnosis with Back Propagation Neural Network
- Reliability Allocation of Large Mining Excavator Electrical System Based on the Entropy Method with Failure and Maintenance Data
- Deployment Reliability Test and Assessment for Landing Gear of Chang’E-3 Probe
- Reliability Analysis of Hydraulic Transmission Oil Supply System of Power-Shift Steering Transmission with GO Methodology