
Evaluation of performance of machine learning methods in mining structure–property data of halide perovskite materials
2022-05-16 07:11RuotingZhao赵若廷BangyuXing邢邦昱HuiminMu穆慧敏YuhaoFu付钰豪andLijunZhang张立军
Chinese Physics B 2022年5期
Ruoting Zhao(赵若廷) Bangyu Xing(邢邦昱) Huimin Mu(穆慧敏)Yuhao Fu(付钰豪) and Lijun Zhang(张立军)
1State Key Laboratory of Integrated Optoelectronics,Key Laboratory of Automobile Materials of MOE,Jilin Provincial International Cooperation Key Laboratory of High-Efficiency Clean Energy Materials,Electron Microscopy Center,and School of Materials Science and Engineering,Jilin University,Changchun 130012,China
2State Key Laboratory of Superhard Materials,College of Physics,Jilin University,Changchun 130012,China
3International Center of Computational Method and Software,Jilin University,Changchun 130012,China
Keywords: machine learning,material informatics,first-principles calculations,halide perovskites
1. Introduction
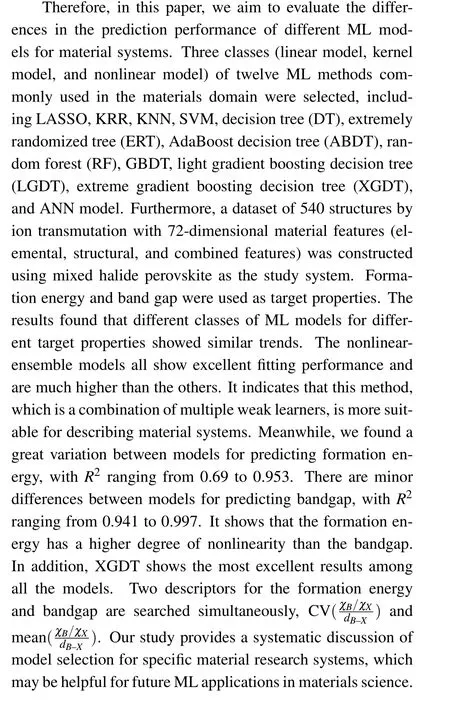
The rapid growth in machine learning(ML)and artificial intelligence has brought about significant development in natural science,especially in physics,materials,and biology.[1—5]The reasons for the widespread use of ML can be ascribed to two points: Firstly, A wide variety of data is currently available through experiment or simulated calculations.[6,7]Secondly, the rapid development of ML models, such as ensemble model and neural network (NN).[8,9]Although materials science is still not at a data-rich stage,[10]the rapid development of materials science databases (e.g., Material Project,[11]AFLOW[12]) and material ML methods/software(e.g., CGCNN,[13]GAP[14,15]) provides a robust foundation for achieving high-speed and large-scale materials design.Material ML method can be divided broadly into supervised learning and unsupervised learning. Supervised learning constructs mapping relationships between material descriptors(features) and target properties, including the two main aspects of interatomic potential[16]and quantitative structure—property relationship (QSPR).[17]Although they both predict the properties of the material, there are obvious differences in their essence. The focus of the interatomic potential is to construct a sufficiently accurate (close to quantum calculations) and inexpensive surrogate model for predicting the energy and force of materials. The QSPR describes a specific material system and generates problem-specific descriptors(e.g.,structure—composition descriptors and easily accessible crystal/molecular properties)so that QSPR addresses the end-to-end description of thermodynamic properties. Therefore, it has a broader range of predictive properties and is better suited to search for new materials on demand. Unsupervised learning is based on the representation method of material to find the similarities and differences among different material groups.[18]The methods to distinguish the structural differences include Euclidean,Manhattan,and Tanimoto coefficients.[19]
On-demand designing of functional materials using the QSPR method has become a new hot topic in materials informatics.[20]Using ML models for mining the intrinsic rules from high-throughput computational results or existing material databases has become a trend to guide theoretical/experimental design and discover new materials with optimized performance.[21—25]The advantage of this method lies in the balance between reasonable experimental requirements and a lower error rate. ML model serves as the most critical link bridging the relationship between material structure and target properties. ML models are the most critical link in the QSPR approach, which constructs linear and nonlinear relationships between material structure and target properties.Therefore, selecting the appropriate ML method is critical in constructing QSPR materials research, significantly affecting prediction accuracy and generalization ability. Generally,ML methods applied in QSPR material research are classified into the linear,kernel,and nonlinear methods. Linear methods are based on a weighted linear sum of selected subsets of material features to fit the target properties,e.g.,least absolute shrinkage and selection operator (LASSO), ridge regression.[26—28]Meanwhile, these methods are also more suitable for small dataset problems, feature selection, and avoiding overfitting problems. The kernel approach transforms the original material feature set into a high-dimensional feature space and then linearly differentiates material, and the features are not directly nonlinearly processed, e.g., support vector machine(SVM).The nonlinear approach refers to the direct nonlinear processing of material features inside the method. It is used to handle when target properties do not vary smoothly in the material feature space, such as decision tree (DT), ensemble model,and neural network(NN)model.
The effectiveness of ML models for fitting material systems has still not been uniformly studied, and it remains an important problem in materials informatics. Moreover, perovskite material received considerable attention in the optoelectronic field due to its advantages,such as ultralong carrier diffusion length,[29—31]high threshold light absorption,[32,33]easily adjustable bandgap,and low-cost fabrication.[34—36]Researchers have used high-throughput computational approach and ML methods to design the novel perovskite materials that maintain superior optoelectronic properties with structural stability and non-toxicity to adapt to different optoelectronic devices.[37—45]Shuaihua Luet al.constructed a gradient boosting decision tree (GBDT) ML model by the first-principles calculation of 346 HOIP structures and screened six potentially synthesizable HOIPs from 5158 structures that have not been calculated.[46]Zhenzhu Liet al.trained the kernel ridge regression(KRR),K-nearest neighbor(KNN),support vector machine (SVM) models by using a dataset of 354 perovskite structures. Furthermore, they found that the KRR model can significantly learn the intrinsic laws of stability of perovskite materials and agree well with the available experimental data,much better than empirical formulations such as tolerance factor and octahedral factor.[47]Adnan Aliet al.selected 852 types of HOIP structures and all-inorganic perovskite structures to construct an artificial neural network (ANN) model and generate a ternary phase diagram of phase stability. Based on the ternary phase diagram output from the ANN model to further guide the experiments successfully, it was found that the introduction of Cs ions at theA-site can increase the stability of the cubic HOIP structure.[48]Although researchers have chosen different ML methods based on the research system to build specific models,[49—53]there is no uniform research on the fitting effect of common ML models in these applications.
2. Computational method
2.1. First-principles calculations
The first-principles density functional theory (DFT) calculations were carried out using the plane-wave pseudopotential method implemented in Viennaab initiosimulation package.[54,55]The projector augmented wave pseudopotentials describe the electron—ion interactions. The generalized gradient approximation of Perdew,Burke,and Emzerhof was used to describe the exchange—correlation function.[56,57]The kinetic cut-off energy for the plane-wave basis was set as 500 eV, and the energy convergence threshold was set as 10-5eV. Monkhorst—Packk-point meshes with the spacing of 2π×0.25 °A-1were employed for structure optimizations and self-consistent calculations. The structures(including lattice parameters and atomic positions)were fully optimized until the residual forces were converged within 0.02 eV/°A. The formation energy (Ef) and the bandgap (Eg) of the structure were calculated and regarded as predicted target properties.Since the same valence binary halides are often used as precursors for the experimental synthesis of perovskite,Efwas defined as the energy difference between the perovskite energy and the binary compounds with the same oxidation state reaction/product. The formula is as follows:
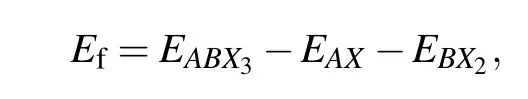
whereEABX3is the total energy of the perovskite,EAXandEBX2are the total energies of binary metal halides (AXandBX2are in space groupPm¯3mandPnma,respectively). More detailed computational methods can be referred to our previous works on halide perovskites.[41,58—63]The high-throughput first-principles calculations were performed via the Jilin Artificial-intelligence aided Material-design Integrated Package (JAMIP), which is an open-source artificial-intelligenceaided data-driven infrastructure specially designed for computational material informatics.[34,64]
2.2. Machine learning
ML calculations were implemented using the JAMIP ML module.[64]The entire process includes constructing computational material data,feature generation,feature engineering,and model construction and evaluation,as shown in Fig.1(a).The entire material data was constructed by using cubic mixed halogen perovskite (space groupPm¯3m, shown in Fig. 1(b))with the chemical formulaABX3. Specifically,we considered combinations ofA=K,Rb,Cs;B=Mg,Ca,Sr,Ba,Zn,Cd,Ge, Sn, Pb; andX= F, Cl, Br, I. The data set contains 540 kinds of mixed halogen perovskite structures.
All features were uniformly preprocessed before feature input into the model to eliminate the differences in data identification with different magnitudes.The recursive feature elimination(RFE)method was used as a feature selection method.We selected feature weight as an elimination criterion for the model with feature weight. We selected four correlation coefficients for the corresponding model for the model without feature weight,including Pearson correlation(PC),Spearman correlation(SC),distance correlation(DC),and mutual information correlation (MIC). The minimum error of the corresponding model among the four correlation coefficients was taken as the final correlation coefficient. Moreover, twelve models were selected to recognize the most effective models for representing the perovskite system. All models (see Fig. 1(c)) were constructed with JAMIP by calling the corresponding ML software packages. LASSO,KRR,KNN,SVM,DT,ERT,ABDT,RF,and GBDT were called from the Scikitlearning python package, XGDT was called from the XGBoost python package,and LGDT was called from the Lightgbm python package.[65—67]The optimal hyper-parameters of all models were searched using the same standard Bayesian optimization algorithm,and ten-fold CV was used as the evaluation metric.[68]We used averaging method to search for“random state” hyperparameter. In Bayesian optimization search process,the result of the average 10 times 10-fold CV eliminated randomization. In the ftiting performance, the result of the average 100 times eliminated the randomization,and searched for the“random state”with the closest average effect as the fnial hyperparameter.

Fig. 1. Schematic diagram of the overall machine learning workflow. (a) The process consists of building a JAMIP ML calculational material data, feature generation, feature engineering, and model construction and evaluation. (b) Single perovskite schematic diagram,A-site with three alkali metal monovalent elements in A-site,nine divalent metal elements in B-site,and four halogen elements in X-site.(c)Machine learning models and hyperparameter method.
3. Results and discussion
Typically, ML studies involve selecting the most appropriate model and the most subtle input features. The initial feature set design is shown in Fig. 2(a). The elemental information of the perovskite was extracted from the Pymatgen database,[69]including atomic radius, ionic radius,ionization energy,electronic affinity energy,electronegativity,Mendeleev number, and atomic mass. The structure features of perovskite,such as(octahedral factor and tolerance factor)and combined features based on the physical/chemical intuition were constructed by the ML module of JAMIP.Moreover,the results of the DFT calculation for the formation energy and bandgap of perovskite were considered as target properties.The dataset contained 72 features and all feature information listed in the support information Table S1. All features were normalized and scaled down to between 0 and 1. Moreover,in order to fairly compare the differences in the fitting performance of perovskite among the twelve models,80%of the total dataset was selected as the training set and 20% as the validation set. We selected the layered sampling method to ensure that the dataset was distributed evenly over the entire range area. The training set was used to train the model and search for the optimal feature set, and the validation set was used to evaluate the performance of the model.

Fig.2. Feature design and feature engineering details. (a)Perovskite feature design includes three parts: initial elemental feature,initial structural feature,and combined feature. (b)Recursive feature elimination(RFE)flow chart. (c)RFE method screening process.
Feature engineering is a crucial step for ML research,which often determines the lower limit of the fitting performance of the model, and the features determine the upper limit.[70]Feature engineering usually consists of feature design and feature selection. For system-specific ML study,feature design consists of initial elemental and structural features based on extraction from the structure and combined features based on physical—chemical intuition. Since the entire feature set is often over-complete, it can lead to a situation of the dimensional curse due to feature redundancy.[26]The RFE method was used to select the optimal feature set of each model. The whole process takes RMSE as the evaluation metric. The RFE method assesses the weight of all features, and the feature with the lowest weight is eliminated. The features subset corresponding to the lowest error is defined as the optimal feature set. We chose the ten-fold CV method for the whole process. For models that do not output feature weights information(SVM/ANN/KNN),a univariate feature selection method was selected as searching for the optimal feature subset,which evaluates the correlation weight(PC,SC,DC,MIC)between each feature and target property. The minimum error of the corresponding model among the four correlation coefficients was taken as the final correlation coefficient. The low correlation weight feature will be removed recursively in turn.The feature selection flow is shown in Fig.2(c).
The RFE process of formation energy is shown in Fig. S1(a). All model RMSE values show a rise firstly with an increasing number of features and then tend to fluctuate after maximum value stably. After completing feature selection,the feature dimensions of all formation energy models are shown in Table 1. The fitting performance of the nonlinearensemble model is better than that of other models, with the LGDT model being the most superior. LGDT is a significantly improved version of the gradient boosting decision tree, where the histogram-based decision tree algorithm and leaf-wise leaf growth strategy with depth constraints considerably increase the efficiency. The minor ten-fold CV RMSE is 0.4156 eV/formula when the feature dimension reaches 30. The XGDT model also achieves a precision close to the LGDT model (0.4167 eV/formula), but its optimal feature set has not eliminated any features. It shows that nonlinearensemble models (LGDT/XGDT/GBDT/ABDT) can effectively characterize the formation energy information. However, other models show a wide variation in fitting performance. The SVM is the worst fitting model with an RMSE CV of 0.7596 eV/formula. It indicates that the relationship between the formation energy and the input features is highly nonlinear. Nonlinear-ensemble models composed of multiple weak learners have better generalization capability. The RFE result of the bandgap is shown in Table 1 and Fig.S1(b).The entire RFE process is similar to the trend of the formation energy, and the nonlinear-ensemble model also performs better than the other models, with the XGDT model showing the optimal performance. The minor ten-fold CV RMSE is 0.2576 eV with feature dimension reduced to 42.
Based on the feature selection results, the second hyperparameter tuning is performed on all models with the optimal feature set and the trained models predicted for the validation set. The results of all formation energy model fitting performances are shown in Fig. 3(a) and Fig. S2.We found that the models vary widely in their evaluations, where the models withR2above 0.9 were only KNN/ABDT/GBDT/LGDT/XGDT. It means that only these models could learn formation energy intrinsic trends. The XGDT model performs optimally for predicting structures not involved in the training set within these models. For the structural formation energy model, the prediction results around 0 eV are usually more descriptive of model robustness. Subsequently, we accounted for the accuracy (percentage of all structures with positive/negative formation energy correctly predicted by the model), MAE, and RMSE of all models in predicting the intervals from-1 eV to 1 eV (see more details in Table S3 of support information). The XGDT model remains the top-performing model with an accuracy of 95.5455%, MAE of 0.1060 (eV/formula), and RMSE of 0.1967 (eV/formula). XGDT is an improved gradient boosting decision tree,which performs the second-order Taylor expansion for loss function compared to the GBDT model and is constructed with the weighted sum of multiple weak learner models (decision tree). Given the excellent performance of XGDT, this model can be used for all future predictions in terms of perovskite stability. All bandgap model fitting results are shown in Fig.4(b)and Fig.S3. We found thatR2in all models exceeded 0.9, which suggests that the models can mine the general trend of the bandgap. It also means that the intrinsic laws of perovskite formation energy are more difficultto mine than the bandgap. The XGDT mode performs better than the other model with MAE of 0.144 eV, RMSE of 0.269 eV,andR2of 0.953. Furthermore, there is little difference in the accuracy of the predictions for the various interval ranges of the bandgap. Therefore, XGDT is one of the most promising ML models for applying to the perovskite system.In addition to the XGDT model, the LGDT and GBDT also show superior results to the other model,which belong to the nonlinear-ensemble model.

Table 1. The feature selection procedure result of formation energy and bandgap for the twelve models.

Fig.3. The fitting error of the test set for twelve ML models. (a)Formation energy fitting results,the order of model fitting error is XGDT,ABDT,LGDT,GBDT,KNN,RF,Ridge,LASSO,ERT,ANN,DT,and SVM.(b)Bandgap fitting results,the order of model fitting error is XGDT,GBDT,LGDT,RF,ABDT,KNN,Ridge,ERT,SVM,DT,LASSO,and ANN.
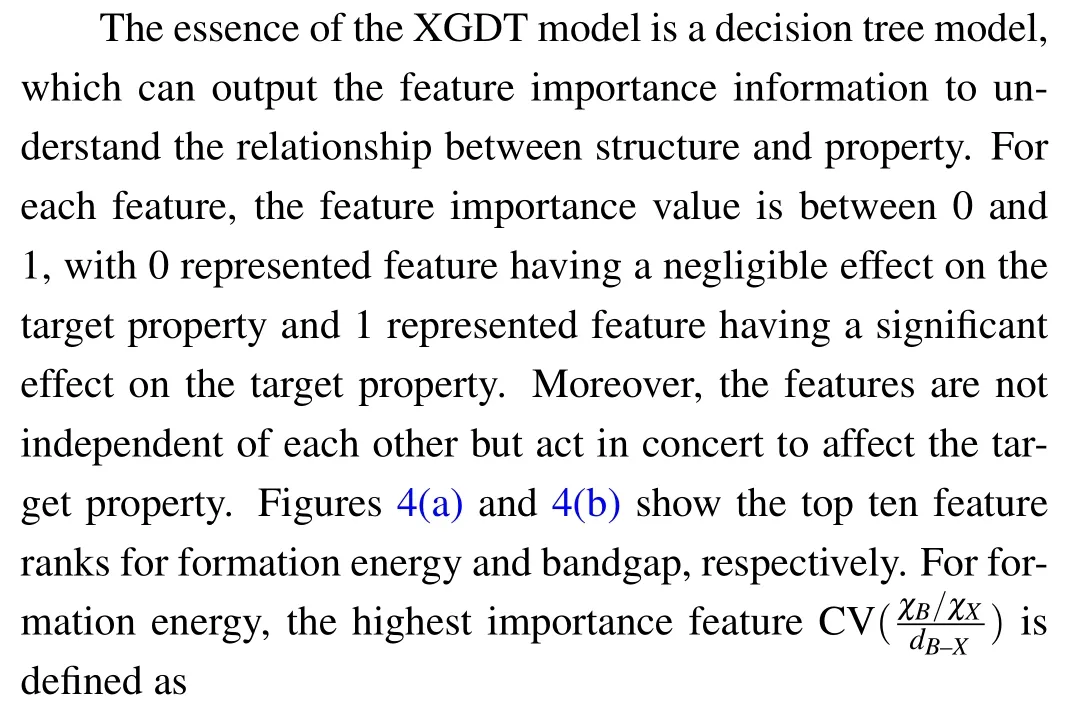


Fig.4.The result of feature importance and two-dimensional sensitivity analysis of the XGDT model.(a)The top 10 importance features rank by the XGDT model for formation energy prediction.(b)The top 10 importance features rank by the XGDT model in bandgap prediction.(c)Relationship visualization of formation energy with CV(). (d) Relationship visualization of bandgap with mean(.
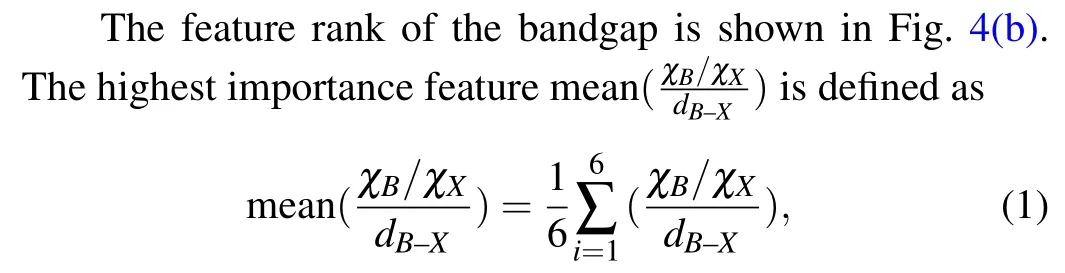
whereχB/χXrepresent the electronegativity ofB/X-site,dB—Xrepresents[BX6]-octahedralB—Xbond length. This formula shows that the mixed halide perovskite’s stability is critically dependent on the mean value of theB—Xelectronegativity ratio and theB—Xbond quotient. The second and third highest importance features are the tolerance factor and theB—Xaverage bond length, respectively, showing that the chalcogenide band gap is affected byB/Xelectronegativity,B—Xdistance,and [BX6]-octahedral distortion. It is mainly due to that the valence band maximum and conduction band minimum of perovskite are mainly occupied by the atomic orbitals ofBandX.The atomic distance betweenBandXdetermines the degree of overlap between the s/p orbitals ofBand the p orbitals ofX. Visual analysis of the most important feature and bandgap relationship is shown in Fig.4(d). We found that the bandgap gradually decreases as the mean value of theB—Xelectronegativity ratio to theB—Xbond length quotient increases. It is mainly due to the gradual increase in octahedral distortion as the highest importance feature decreases, which results in less overlap between the s/p orbitals ofBand the p orbitals ofX, leading to an increase in the bandgap when theB-site electronegativity is fixed.[72]The characterization of the perovskite stability and bandgap shows that theB—Xelectronegativity and the degree of[BX6]-octahedral distortion play a crucial role in the structural properties of perovskite.In summary,adjusting the appropriate halogen percentage to modulate the bandgap range within a stable structure can design perovskite materials for specific optoelectronic requirements.
4. Conclusion


The superior results of the nonlinear-ensemble model benefit from employing multiple ensemble approach to optimize the higher variance and bias problem of the single model. The common ensemble approach includes boosting,[73]bagging,[74]and stacking.[75]In this study, we constructed XGDT, LGDT, GBDT, and ABDT models using the boosting method and RF model using the bagging method.All nonlinear-ensemble models taking boosting methods are better than bagging methods in formation energy and bandgap.This is mainly because the boosting method adopts updating the sample weights of every single model according to the prediction error(loss function). Then, the high bias samples are continuously trained to focus on optimizing the model and reducing the loss function. The advantage of the XGDT model for achieving the best performance is mainly reflected in Newton’s method, in which the extreme value of the loss function is solved, the second-order Taylor expansion of the loss function is carried out, and the regularization term is added to avoid overfitting. This treatment is more sensitive to fitting errors.[66]Meanwhile,we found that the ANN model that performs well in the ML fitting potential does not achieve excellent results. It is because ANN algorithm often requires large data sets to support them. Otherwise, they can cause great overfitting.[76]Therefore,the nonlinear-ensemble ML models are suitable for research on small sample material datasets.In addition, the XGDT model not only achieves the best fitting performance,but also captures potential relationships between halide perovskite material descriptors and target properties (formation energy and bandgap). This approach helps to understand the properties of halide perovskites and permits more efficient work on finding descriptors. Thus, the XGDT may be a potential ML model for applying in the field of halide perovskites and even other types of material systems in the future.
Data availability
The data that support the findings of this study are openly available in Science Data Bank at https://www.doi.org/10.11922/sciencedb.01611.
Acknowledgments
The project supported by the National Natural Science Foundation of China (Grants Nos. 62125402 and 92061113).Calculations were performed in part at the high-performance computing center of Jilin University.

- Chinese Physics B的其它文章
- A nonlocal Boussinesq equation: Multiple-soliton solutions and symmetry analysis
- Correlation and trust mechanism-based rumor propagation model in complex social networks
- Gauss quadrature based finite temperature Lanczos method
- Experimental realization of quantum controlled teleportation of arbitrary two-qubit state via a five-qubit entangled state
- Self-error-rejecting multipartite entanglement purification for electron systems assisted by quantum-dot spins in optical microcavities
- Pseudospin symmetric solutions of the Dirac equation with the modified Rosen–Morse potential using Nikiforov–Uvarov method and supersymmetric quantum mechanics approach