
Temperature dependence of bismuth structures under high pressure
2022-05-16 07:10XiaobingFan范小兵ShikaiXiang向士凯andLingcangCai蔡灵仓
Chinese Physics B 2022年5期
关键词:小兵
Xiaobing Fan(范小兵), Shikai Xiang(向士凯), and Lingcang Cai(蔡灵仓)
National Key Laboratory of Shock Wave and Detonation Physics,Institute of Fluid Physics,China Academy of Engineering Physics,Mianyang 621999,China
Keywords: liquid—liquid phase transition,bismuth melt,XANES,electronic structure
1. Introduction
First-order phase transitions are common in crystalline phases and are accompanied by abrupt changes in volume or structure. For example, pure iron changes from facecentered-cubic to body-centered-cubic forms at 1183 K and atmospheric pressure.[1]On the contrary, a liquid is considered to consist of different kinds of short-range ordered structures and its volume changes continuously with temperature and pressure,[2,3]that is, there is no first-order phase transition of the liquid. However, the first-order liquid—liquid phase transition (LLPT) found from simulations and experiments has changed our perception of the liquid state. LLPTs have been predicted from simulations in water,[4,5]silicon,[6]carbon dioxide,[7]carbon,[8]hydrogen[9]and nitrogen.[10]Direct experimental evidence has been found in liquids such as Y2O3-Al2O3mixtures,[11]water,[12]elemental phosphorus,[13]cerium,[14]sulfur[15]and other molecular liquids.[16—18]
Bismuth (Bi) is an important transition metal material with rich phase structures including phase I (rhombohedral),phase II (monoclinic), phase III (bct), phase IV (orthorhombic)and phase V(bcc)of bismuth solids at high pressures and temperatures.[19—24]For bismuth melts, Greenberget al.[25]studied the change of structures of bismuth melts with the temperature rising under atmospheric pressure. They observed a sudden change in the relationship between the coordination number and temperature obtained from the neutron diffraction spectrum at about 1070 K, which is direct evidence of LLPT in the liquid structure. It is also suspected that LLPT exist in the bismuth melt at high pressures and temperatures as an element in the same group with phosphorus. In 1992,Yaoitaet al.[19]adopted x-ray diffraction to analyze the structure factorS(Q)of liquid bismuth near the melting curve and found that the liquid structure changes at about 7.3 GPa. In 2017,Shuet al.[26]revealed the liquid structure memory effect of bismuth from the deep melting to the solid using magnetic measurement. However. the liquid—liquid phase boundary is unclear in Refs. [19,26]. In 1992, Umnovet al.[27]drew the liquid—liquid phase diagram of bismuth by discontinuous changes in resistivity through experiments of the resistance method. The liquid—liquid phase boundaries obtained needs to be verified in other ways. According to the above-mentioned research,there is a temperature-induced LLPT in the bismuth melt under atmospheric pressure and it is necessary to clarify whether LLPT exists in the bismuth melt under high temperature and high pressure. If so, it will be just necessary to confirm the boundary of the LLPT and clarify whether it is a first-order phase transition.
LLPT is difficult to observe experimentally because most LLPTs exist in supercooled liquids,where LLPT is difficult to distinguish from crystallization.[11,12]For liquids under high temperature and high pressure,the x-ray diffraction technique combined with synchrotron radiation is commonly used to investigate LLPT.[13,14]However, the LLPT in a large disorder liquid may have small structural changes, making it difficult to observe significant changes using x-ray diffraction.New research methods are needed to characterize the shortrange structure of liquids. X-ray absorption spectroscopy provides structural information within a few angstroms around the photo-absorbing atom, and therefore maintains the same sensitivity and accuracy regardless of the physical state of the investigated sample (crystalline, amorphous, or liquid).Similar to diffraction techniques, x-ray absorption near edge structure (XANES) spectra may distinguish different crystallographic phases, and may shed some light on the electronic structure.[28]XANES has been used to study the phase transition of iron,[29]the valence state[30]and the electronic structure[31]of a bismuth-containing compound. In addition,ab initiomolecular dynamics(AIMD)simulations[32,33]have been used to study the structure and properties of liquid bismuth at high temperature and atmospheric pressure. However, the studies at high temperature and high pressure are rare.[34,35]
In this paper,we report the XANES spectra of bismuth at different initial pressures(2.48 GPa,3.10 GPa and 4.54 GPa)with increasing temperature. Through the features of XANES spectra, we investigate the temperature dependence of the electronic structure of bismuth under high pressures. Also,AIMD simulations are performed to obtain the possible stable structures of bismuth melts from different initial structures at different pressures and temperatures. Then, we calculate the electronic structures of these stable structures and discuss the probability of LLPT in the high pressure-high temperature region.
2. Experiment
In the experiments of absorption spectra, the highpressure and high-temperature system, detailed introduction in our previous paper (Ref. [36]), consists of three parts: a diamond anvil cell (DAC), a resistive furnace, and a doublelayer cover.As shown in Fig.1(a),the DAC passes pressure to the diamond anvil relying on the pressure screws and the disc springs. The DAC has a large window on both sides of the sleeve to make it easier to install the furnace, and the outlet holes are used to pass through the resistance wires connected to the direct current power supply and the K-type thermocouple for measuring temperature. Figure 1(b) shows the design of the furnace and the internal structure of the DAC.The furnace is fixed to the tungsten carbide seat on the side of the sleeve with high-temperature cement,and the protruding ring under the bottom of the furnace plays a role in ensuring the basic position of the furnace. The center hole of the furnace has a proper size and it is easy to reposition the gasket. The sample chamber is surrounded by the entire furnace,and then samples can be heated evenly through the thermal radiation method. The K-type thermocouple is glued to the diamond bevel with approximately 1 mm to the culet and the ceramic tube is used to insulate and protect the thermocouple under high temperature.
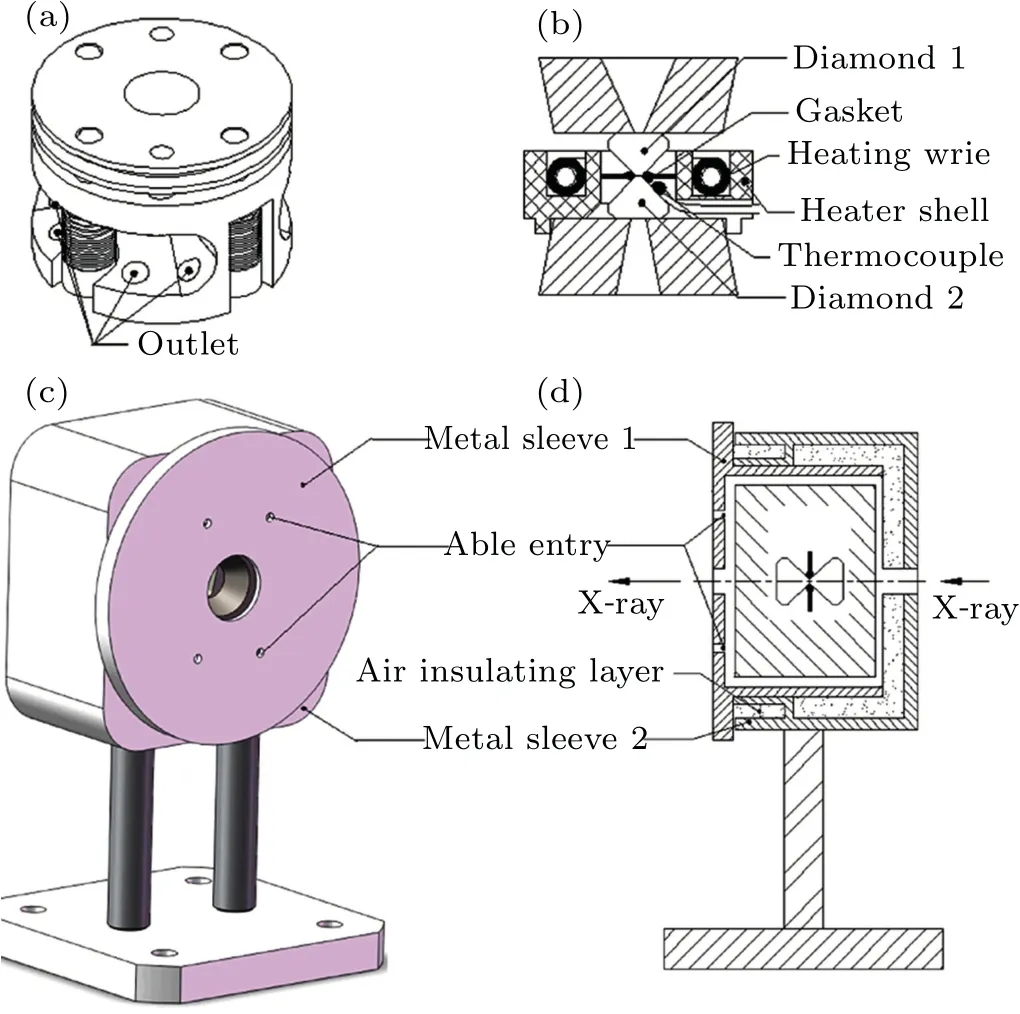
Fig. 1. The DAC and the double-layer cover in experiments.[36] (a) Wires of the furnace and K-type thermocouple to measure temperature through the outlet. (b) Section view of the ring heater assembly. (c) Schematic diagram of a DAC in the double-layer cover. (d) Section view of a DAC in the double-layer cover. The assembly can be installed directly to the optical platform of the Beijing synchrotron radiation source.
The resistive furnace has two parts, including the shell material and the heating wire. Al2O3ceramic, cement, and glass-ceramic are tried as the heater shell material and finally,Al2O3ceramic is selected as the heater shell material. Firstly,the thermal conductivity of Al2O3ceramic is much larger than that of glass-ceramic. What’s more,Al2O3ceramic has a high enough melting point up to about 2000 K and the melting point of glass-ceramic is only 1000 K. The nickel-chromium alloy is used as heating wire because of its appropriate resistance and the nickel-chromium alloy melting point of about 1700 K meets the experimental requirement for the highest sample temperature of 900 K. We wind the heating wire into a spiral to increase the heating efficiency and fix the heating wire through high-temperature cement.
When we prepared the DAC,bismuth(polycrystalline Bi,Alfa,purity 99.998%)was filled into a hole of 200 μm diameter and 30 μm thickness in a gasket of stainless steel T301.There was no pressure transmission medium as bismuth is relatively soft under high pressure. Note that the absorption spectrum curve of bismuth at room temperature changes little before and after heating, indicating that there is no chemical reaction between bismuth and the material of the gasket. The pressure was loaded by the diamond with a 600 μm culet and measured using the standard ruby fluorescence technique.[37]All pressure measurements were performed at room temperature. Here we have prepared three DACs at different initial pressures(2.48 GPa,3.10 GPa and 4.54 GPa).
Then the entire DAC was wrapped into a double-layer cover and fixed position using top wires,as shown in Figs.1(c)and 1(d). The heating wire and thermocouple go through the able entries with an insulation ceramic tube. The double-layer structure can save the heat in the cover and effectively reduce the temperature difference between the diamond bevel and the sample.In practical applications,the assembly can be installed directly to the optical platform of the Beijing synchrotron radiation facility (BSRF). These more advantages of the high pressure and high temperature system were investigated in our previous paper.[36]
The x-ray absorption fine structure(XAFS)spectrum was carried out at the 4W1B-XAFS experimental station(BSRF).Spectra were recorded in the transmission mode using a double crystal Si(111)monochromator with an energy resolution ΔE/E~10-4. Firstly we measured the absorption spectra at the BiL3-edge at 2.48 GPa and 3.10 GPa, and BiL2-edge at 4.54 GPa at room temperature. Because the thickness of the sample in the DAC of 4.54 GPa may be too thin,we chose BiL2-edge to obtain a suitable jump of the absorption spectrum.XAFS spectra were collected from 13220 eV to 13400 eV at BiL3-edge(15520 eV to 15690 eV at BiL2-edge)with 4 eV steps before the main edge,1 eV steps from-19 eV to 81 eV at BiL3-edge(-21 eV to 79 eV at BiL2-edge)across the main edge (13419 eV at BiL3-edge and 15711 eV at BiL2-edge)and 4 eV steps from 13500 eV to 13800 eV at BiL3-edge(15790 eV to 16090 eV at BiL2-edge) above the main edge.In the XAFS experiment,single crystal diffraction of diamond,which would be superposed onto the XAFS spectra as a drastic interference signal,was suppressed by rotating the DAC to adjust the angle between the DAC orientation and the incident x-ray. In this paper,we focus on the XANES area and do not obtain high quality long-range extended x-ray absorption fine structure(EXAFS)data suitable for analysis.
To investigate the temperature effect under different initial pressures, XAFS experiments were carried out along the heating pathways of paths 1,2 and 3 as shown in Fig.2. The automatic temperature control software is used to change the temperature and the thermocouple at the diamond bevel is chosen as the temperature control thermocouple for the target temperatures in all our experiments. The precise temperature of the diamond bevel can be measured and the temperature control accuracy was up to±0.2 K.When the temperature reached the preset temperature and the heat balance was maintained for 10 min,the spectrum was started to be recorded. We changed temperature after the spectrum was completed and repeated the spectrum acquisition process.
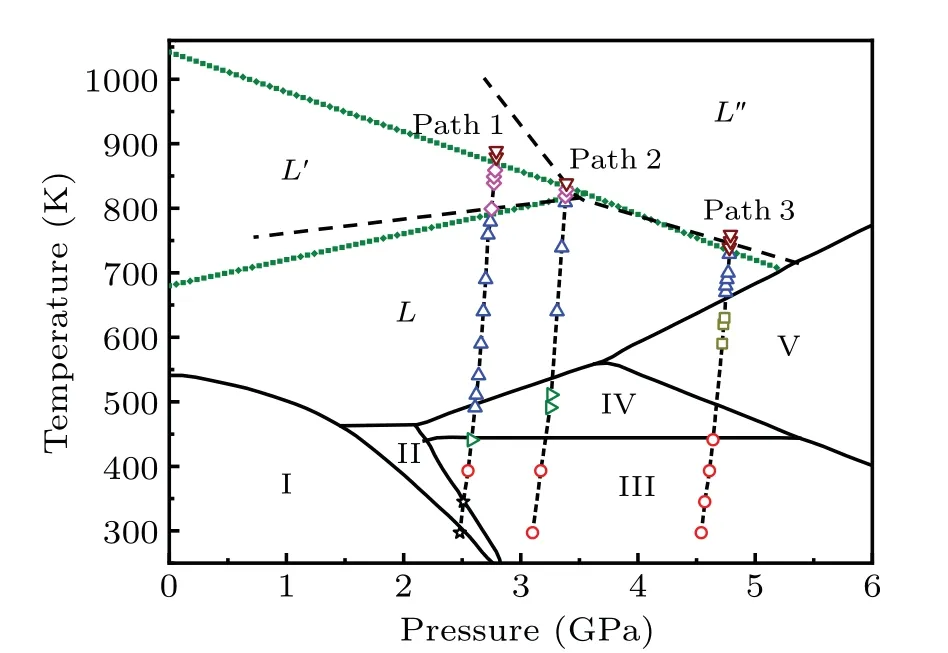
Fig. 2. Phase diagram of bismuth. The black solid lines are proven phase boundaries.[19—24] The dashed lines are possible liquid—liquid boundaries derived from changes in the electrical conductivity of the bismuth melt (we assume liquid—liquid phase boundaries to be linear).[27] The olive short dots are liquid—liquid phase boundaries obtained from this work. Paths 1, 2 and 3 are heating pathways of our absorption spectrum experiments with different initial pressures(2.48 GPa, 3.10 GPa and 4.54 GPa, respectively). The stars, circles,rightward triangles,upward triangles,downward triangles,squares and diamonds represent the temperature points in heating pathways measured in this work.
The temperature of the sample area was calibrated according to our previous experiment of temperature calibration.[36]Usually, the calibration of pressure in a DAC is by calculating the pressure of a standard material or ruby fluorescence method. However, calculating the pressure of the standard material, which depends on x-ray diffraction, is difficult to achieve in the x-ray absorption spectrum experiment under high temperature and high pressure. Also, ruby fluorescence is difficult to measure in our XAFS experiments.Therefore,we use the method of hot pressure estimation to calibrate the pressure, which has been successfully used in laser heating DAC experiments. For experiments of each path, we only measured the pressure of the sample at room temperature. Here the pressures at high temperatures were estimated through an extra thermal pressure. Note that we ignore the thermal effect of DAC and the effect of phase transition of bismuth on pressure. The thermal pressure for a substance that is held at constant volume (in the experiments, we assume that the volume of the sample is constant) can be calculated thermodynamically by[38]
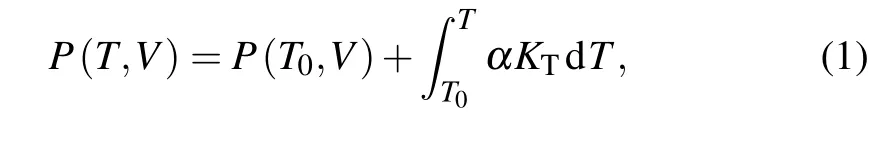
whereP(T,V)is the pressure at temperatureTand volumeVandP(T0,V)is the pressure at temperatureT0and volumeV,αis the volumetric thermal expansion coefficient andKTis the isothermal bulk modulus at temperatureT.The values of volumetric thermal expansion coefficientαand isothermal volume modulusKTvary with the pressure and temperature.[39,40]At the same pressure, the relationship between their values and temperature is very small. For the same phase and limited temperature changes, the values are unchanged, so the influence of temperature on each phase is ignored. In the actual experiment,we have three initial pressures(2.48 GPa,3.10 GPa and 4.54 GPa). For the same pressure point and in the same phase,the relative change of pressure is small with the increase of temperature, so we only care about the values at a certain pressure. the values ofαandKTin our calculation of the thermal pressure are listed in Table 1. In this paper,the values in different pressure ranges are fixed for the convenience of calculation. In our experiments,the temperature of the diamond bevel,and the corresponding calibration temperature and pressure of the sample area are given in Table 2.
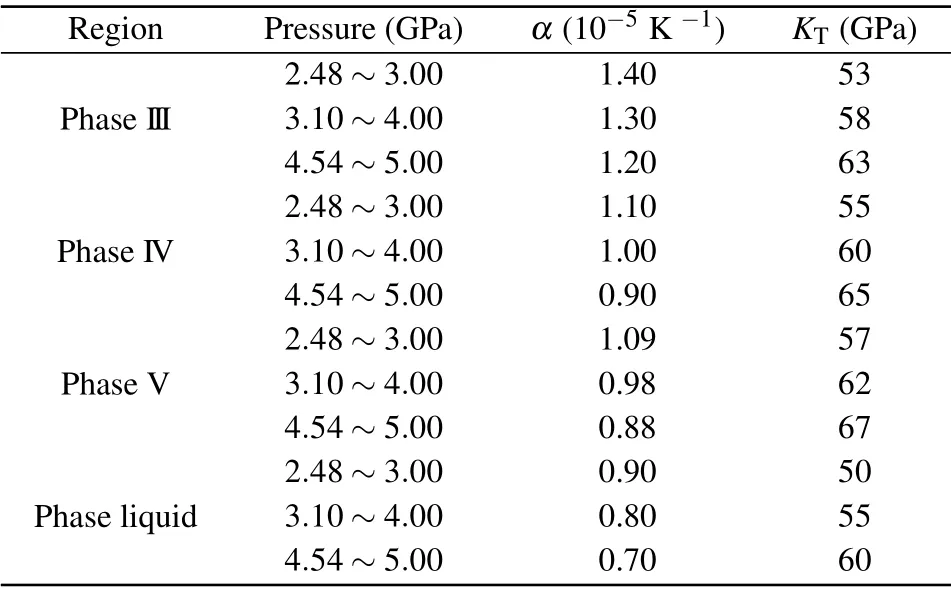
Table 1. The values of the volumetric thermal expansion coefficient α and the isothermal bulk modulus KT from Refs.[39,40].
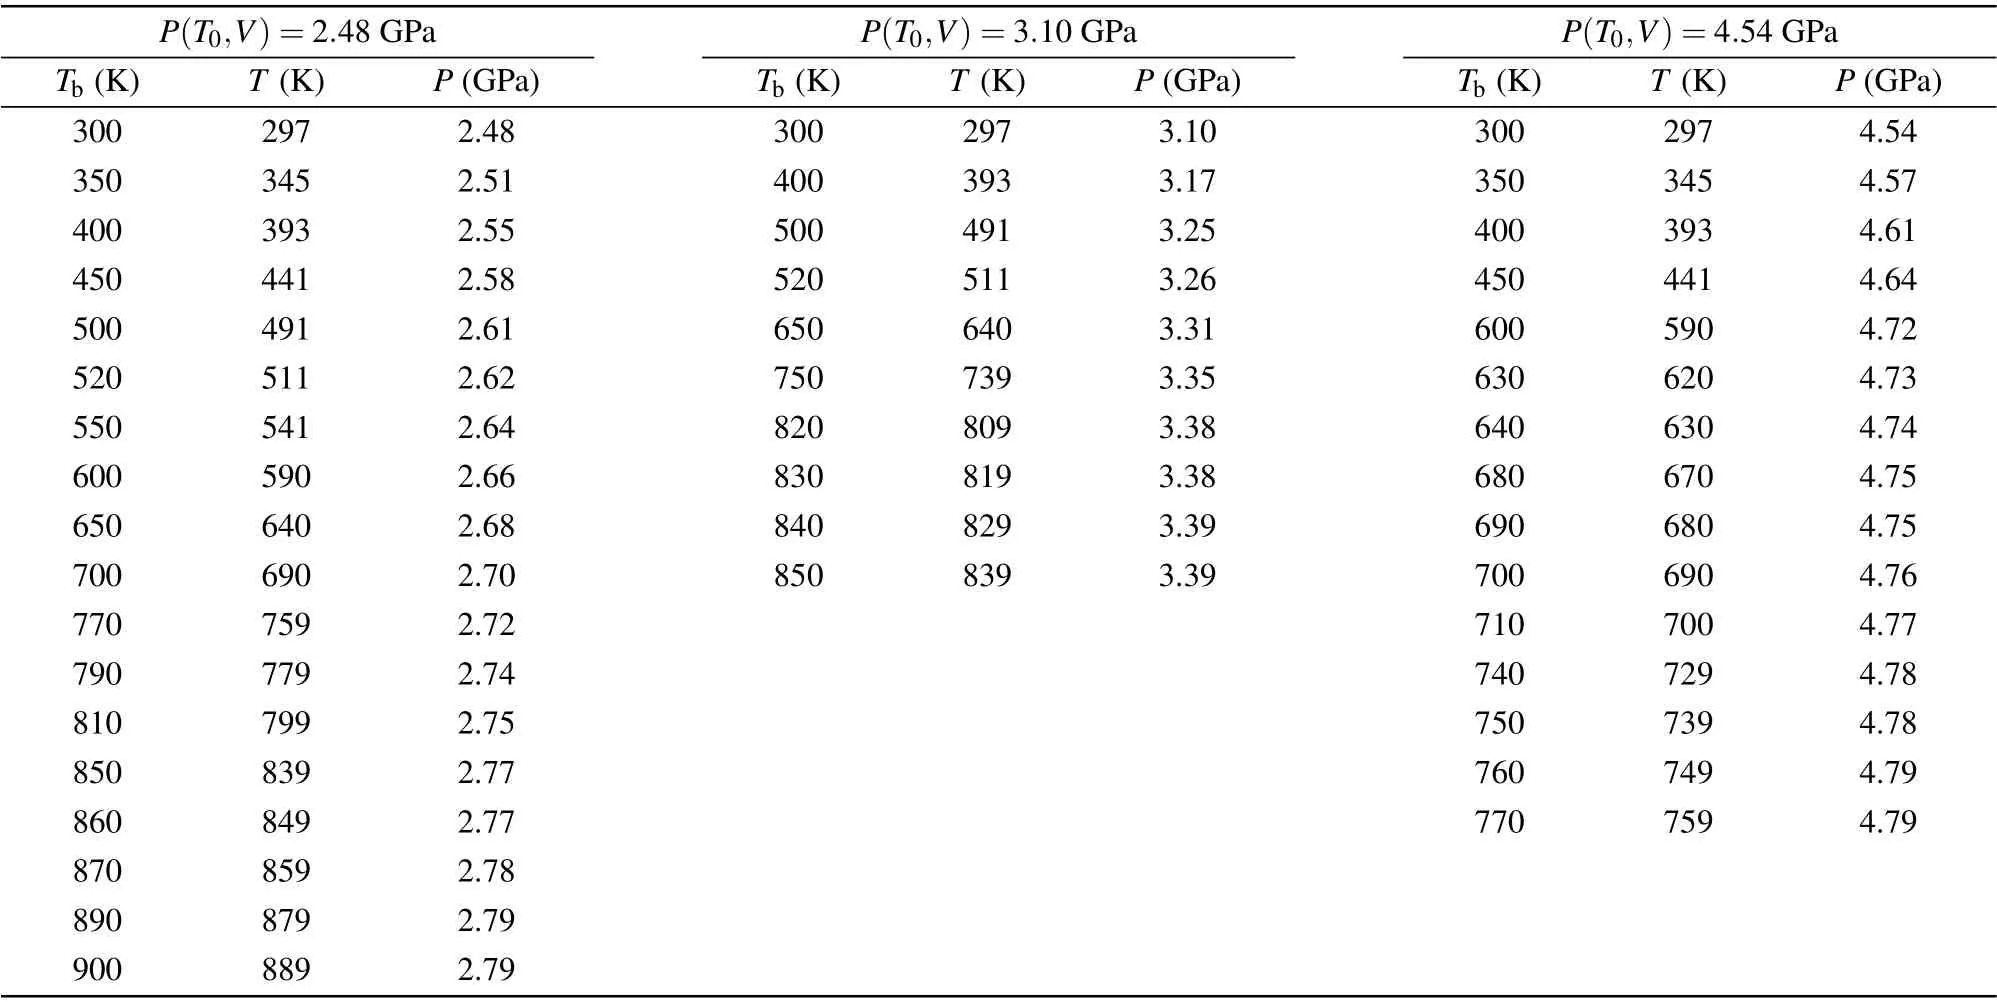
Table 2. Calibration of the temperature and pressure at high temperatures. Tb is the measurement temperature of the thermocouple. T and P are the calibration temperature and pressure at high temperatures.
3. Calculation methods
In our AIMD simulations, we applied the density functional theory in the framework of the projector augmented wave (PAW)[41]method as implemented in the code VASP(Viennaab initiosimulation package).[42]The exchangecorrelation potential was approximated by generalized gradient approximation(GGA)using the Perdew—Burke—Ernzerhof functional.[43]All the dynamical simulations were performed in the canonical ensemble (NVT) with the temperature controlled by the Nose thermostat method.[44]Newton’s equations of motion were integrated using the Verlet algorithm with a time step of 1 fs. Only theΓpoint was used for AIMD simulations. To study the temperature dependence of bismuth at different pressures, we construct the stable structure under different pressures (phase I, phase II, phase III, phase IV and phase V).[19—24]The supercell containing 162 atoms for phase I was adopted with a standard periodic condition (144 atoms for phase II, 128 atoms for phase III, 144 atoms for phase IV and 128 atoms for phase V).In the process of sample preparation,the structure was first melted and equilibrated at 1500 K for 20 ps. Then, the size of the supercell was gradually adjusted to make the static pressure reach about 1.50 GPa for phase I(2.70 GPa for phase II,3.20 GPa for phase III,3.20 GPa for phase IV, 6.00 GPa for phase V). After the system was equilibrated at 1500 K for 20 ps,the system of the supercell of phase I was rapidly cooled down to 300 K—1000 K at 1.50 GPa(2.70 GPa for phase II, 3.20 GPa for phase III, 3.20 GPa for phase IV, 6.00 GPa for phase V) and equilibrated for 20 ps.After the equilibration, another 12000 steps were performed for the collection of the trajectories to study the electronic and topological structures of the system.
To study the temperature effect on the electronic structure of these stable structures of bismuth at different temperatures and pressures, we have calculated their total density of states(DOS) of electrons around the Fermi level using the VASP code with GGA potential. The kinetic cutoff energy of 400 eV and Monkhorst—Packk-meshes with 2×3×3 and 6×6×9[45]were chosen for self-consistent and non-self-consistent calculations of the electronic density of states, respectively. In addition, we have calculated the partial density of states of bismuth 6d(occupied and empty)state above the Fermi level using the code FDMNES(Finite Difference Method for Near-Edge Structure package)[46]with muffin-tin potential instead of pseudopotential in the VASP package.[30,47,48]
To analyze the structures obtained from AIMD simulations, we consider the mean-square displacement (MSD) to check whether our simulated systems are in a liquid state. For a liquid state, MSD is linear with timetin the limit of large time. The time-dependent MSD Δr2(t) can be calculated according to the following equation:[49]
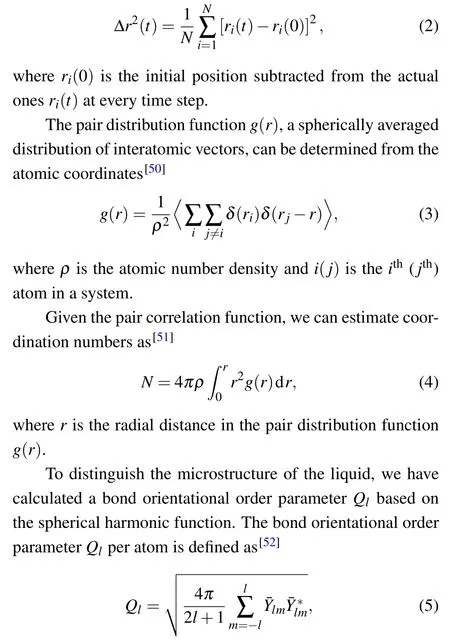
wherel(1,2,...,n)is degree andm=-l,...,0,...,l.Here,we choseQ6(l=6)as the specific local order parameter formula because it has good performance in liquid.[53,54]The spherical harmonic order parameters are defined as[52]
wherennnis the number of nearest neighbors,Ylmis the spherical harmonics function and the anglesθandφare the standard spherical polar angles defining the direction of the bond vectorrij.
4. Results and discussions
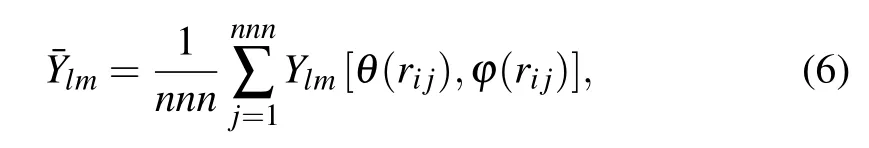
To compare the temperature effect on the absorption spectrum,the ATHENA software was used to process experimental raw data and there are some movements in the vertical direction for the sake of comparison.[55]Figure 3 shows XANES spectra of bismuth from 297 K to 889 K along with the heating series of 2.48 GPa, from 297 K to 839 K along with the heating series of 3.10 GPa and from 297 K to 759 K along with the heating series of 4.54 GPa. According to the wellestablished bismuth phase diagram, these XANES spectra of bismuth at BiL3-edge with the heating series of 2.48 GPa correspondingly divided into six groups, as shown in Fig. 3(a),can be attributed to phase I→phase III→phase IV→phase L→phase L′→phase L′′transitions. In the heating series of 3.10 GPa,the five groups XANES spectra of bismuth at BiL3-edge, as shown in Fig. 3(b), corresponding to phase III→phase IV→phase L→phase L′→phase L′′transitions. In Fig.3(c),in the series of 4.54 GPa,the XANES spectra of bismuth at BiL2-edge correspondingly divided into four groups can be attributed to phases III, V, L and L′′. Next, we analyze the temperature dependence of characteristic peaks of the XANES spectra of bismuth solids and liquids at different initial pressures.
The XANES spectra through the solid to liquid phase transitions are shown at initial pressure 2.48 GPa from 297 K to 511 K in Fig.4(a),at initial pressure 3.10 GPa from 297 K to 739 K in Fig.4(b)and initial pressure 4.54 GPa from 297 K to 680 K in Fig.4(c). The XANES spectrum of the BiL3-edge is largely determined by the empty Bi 6d state. Bi 6s state is filled with electrons owing to no feature in the onset region of XANES spectra. We assumed some components of characteristic peaks near the bismuth absorption edge as shown in Fig.4. The well-resolved characteristic peaks A and B correspond to the transition of a 2p3/2electron into 6d states. The features C and D correspond to multiple scattering of neighboring atoms at theL3-edge. The peaks E and F correspond to the transition of a 2p1/2electron into 6d states at BiL2-edge,respectively. The peak G is attributed to multiple scattering of neighboring atoms at BiL2-edge.
First,the phase transition from the solid phase to the liquid phase with increasing temperature under different pressures was confirmed by the change of XANES spectra. As shown in Fig.4(a),the XANES spectra at 297 K and 2.48 GPa obtained from theL3-edge of bismuth have four characteristic peaks,which is bismuth with phase I(A7 structure)consistent with previous studies.[23]At 345 K and 2.51 GPa,the characteristic peak C still exists,which may be caused for a mixture of phase I and phase II.[23]The peak C dramatically decreases from 345 K(2.51 GPa)to 441 K(2.58 GPa)in Fig.4(a),implying a change in the local structure of the absorbing atom corresponding to the transition of phase I to phase III and phase III to phase IV.The lack of phase II may be due to the narrow range of phase regions and phase I directly transforms into phase III. As the temperature rises from 441 K (2.58 GPa) to 491 K(2.61 GPa),the characteristic peak A of XANES spectra of bismuth decreases gradually, which suggests a change of the DOS of the 6d state. Meanwhile, a broadening feature B indicates a wider energy range of the DOS of the 6d state at 491 K (2.61 GPa). For the heating series of 3.10 GPa, we can divide the XANES spectra of bismuth into three groups corresponding to phases III,IV and L.As for the heating series of 4.54 GPa,according to the change of characteristic peak G in Fig.4(c),the curve can be divided into three groups,corresponding to phases III,V and L.
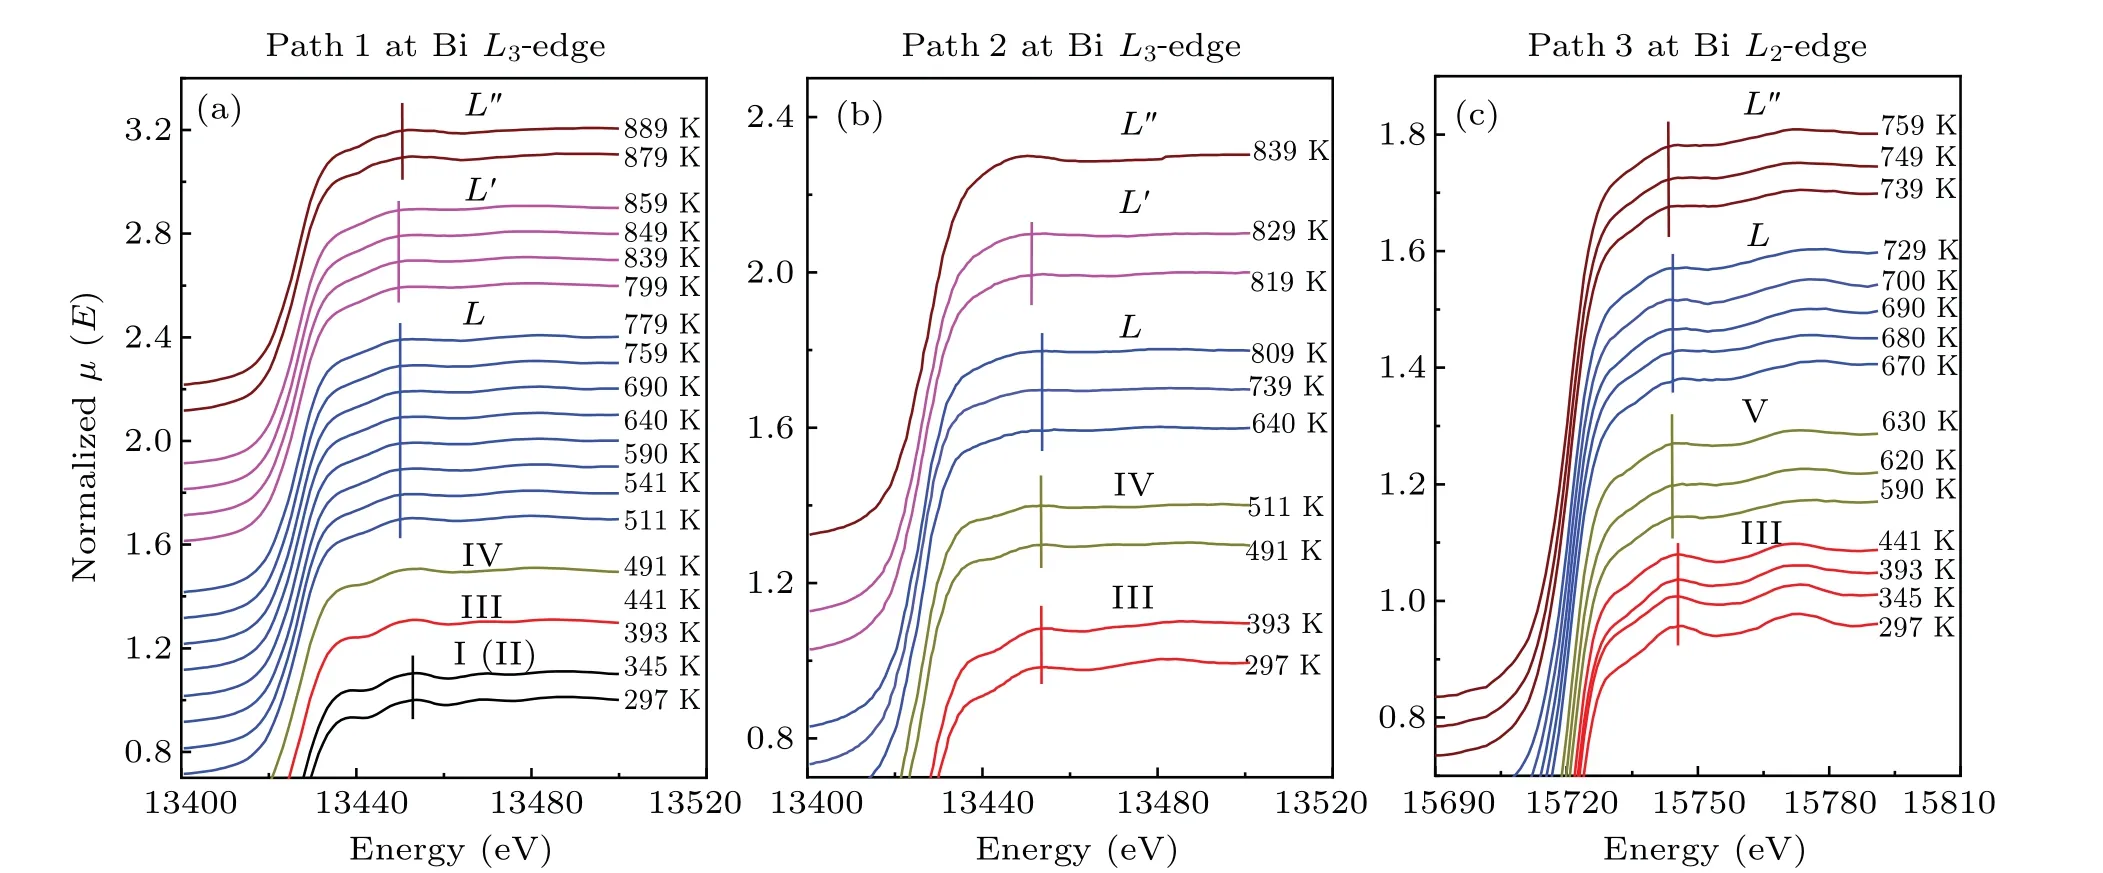
Fig.3. Normalized XANES spectra of bismuth at different pressures and temperatures. (a)Temperature dependence of the XANES spectra of bismuth at the Bi L3-edge(path 1 from 297 K to 889 K at initial pressure 2.48 GPa). (b)Temperature dependence of the XANES spectra of bismuth at the Bi L3-edge(path 2 from 297 K to 839 K at initial pressure 3.10 GPa). (c)Temperature dependence of the XANES spectra of bismuth at the Bi L2-edge(path 3 from 297 K to 759 K at initial pressure 4.54 GPa).
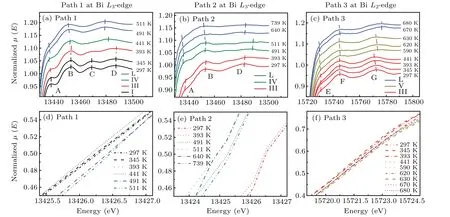
Fig. 4. Normalized XANES spectra at relatively low temperatures (features A, B, C, D in Bi L3-edge XANES and features E, F, G in Bi L2-edge XANES).(a)The XANES spectra of bismuth at the Bi L3-edge(path 1 from 297 K to 511 K).(b)The XANES spectra of bismuth at the Bi L3-edge(path 2 from 297 K to 739 K).(c)The XANES spectra of bismuth at the Bi L2-edge(path 3 from 297 K to 680 K).(d)The Bi L3 absorption edge of the bismuth melt(path 1 from 297 K to 511 K).(e)The Bi L3 absorption edge of the bismuth melt(path 2 from 297 K to 739 K).(f)The Bi L2 absorption edge of the bismuth melt(path 3 from 297 K to 680 K).The dashed lines in(a),(b),(c)correspond to the characteristic peak position of the absorption spectra.
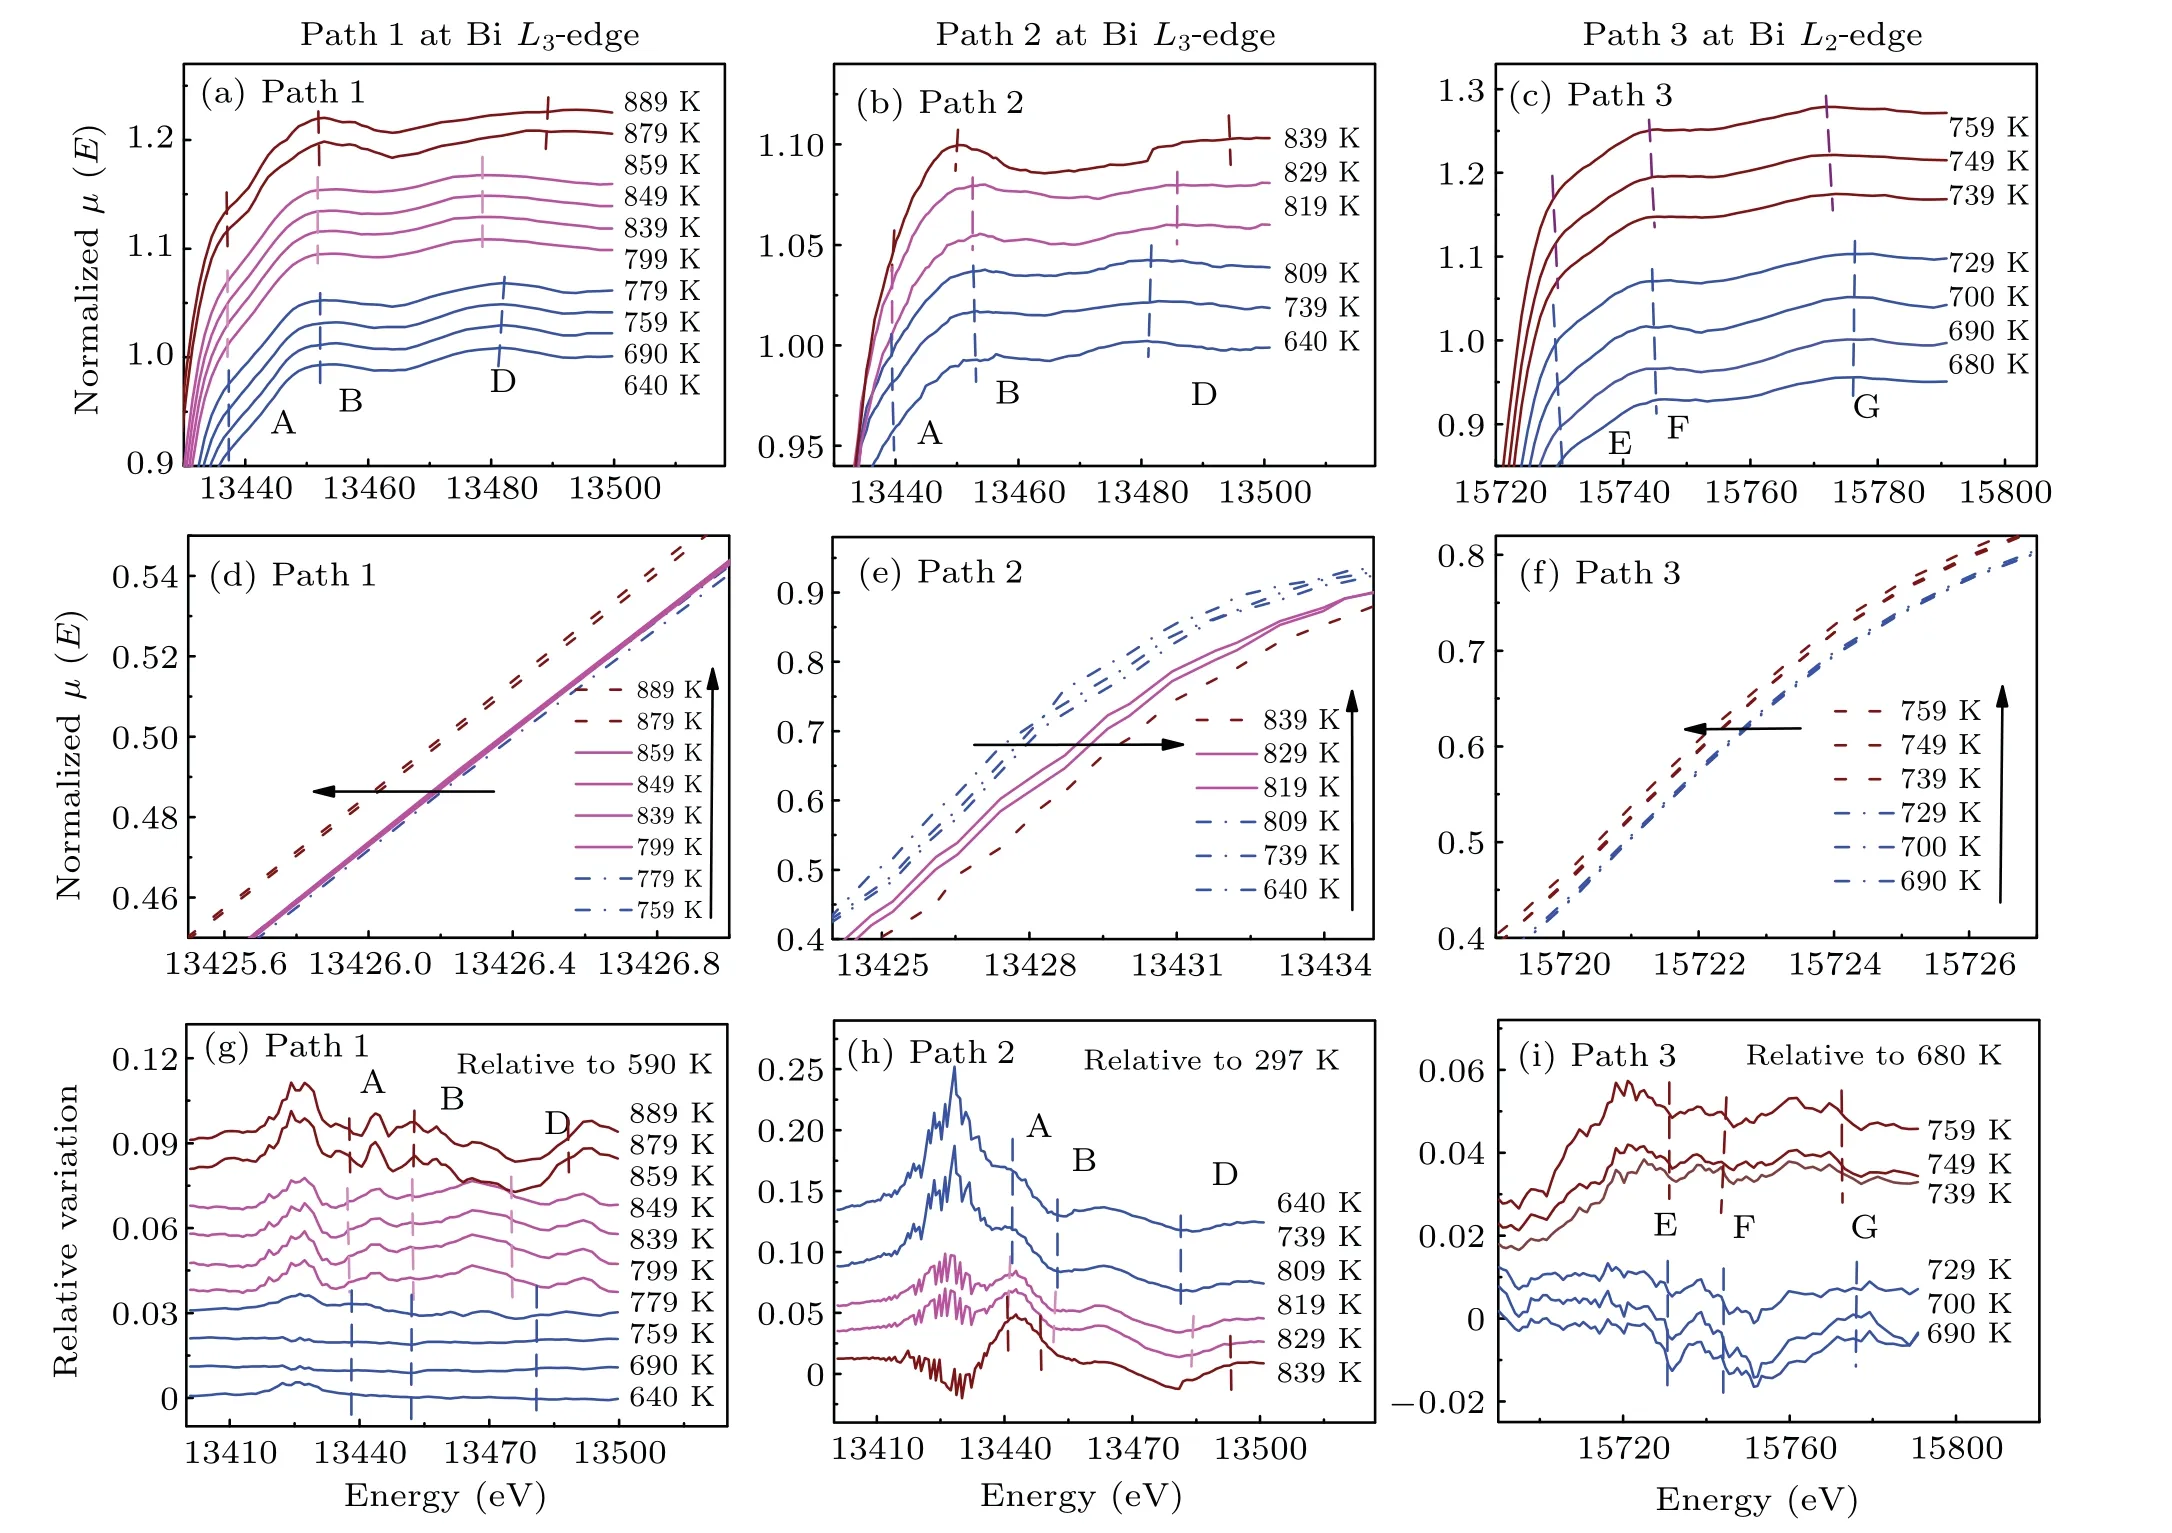
Fig. 5. Normalized XANES spectra of bismuth melts at relatively high temperatures. (a) The XANES spectra of bismuth at the Bi L3-edge(path 1 from 640 K to 889 K).(b)The XANES spectra of bismuth at the Bi L3-edge(path 2 from 640 K to 839 K).(c)The XANES spectra of bismuth at the Bi L2-edge(path 3 from 680 K to 759 K).(d)The Bi L3 absorption edge of bismuth(path 1 from 640 K to 889 K).(e)The Bi L3 absorption edge of bismuth(path 2 from 640 K to 839 K).(f)The Bi L2 absorption edge of bismuth(path 3 from 690 K to 759 K).(g)The XANES spectra difference of bismuth at the Bi L3-edge(path 1 from 640 K to 889 K relative to 590 K).(h)The XANES spectra difference of bismuth at the Bi L3-edge(path 2 from 640 K to 839 K relative to 297 K).(i)The XANES spectrum difference of bismuth at the Bi L2-edge(path 3 from 690 K to 759 K relative to 680 K).The dashed lines in(a),(b),(c),(g),(h),and(i)correspond to the characteristic peak positions of the absorption spectra.
Figures 4(d), 4(e), and 4(f) show the absorption edges,defined at an absorption coefficient of 0.5 of bismuth atL3-edge from 297 K to 511 K in the heating series of 2.48 GPa,297 K to 739 K in the heating series of 3.10 GPa andL2-edge from 297 K to 680 K in the heating series of 4.54 GPa. The shift of absorption edges implies a shift in the Fermi level or the density of states at the Fermi level. Figure 4(d) shows that absorption edges of the solid bismuth in the heating series of 2.48 GPa have a little change from 297 K(2.48 GPa)to 441 K(2.58 GPa),and the absorption edge of the bismuth melt moves about 0.3 eV in the high energy direction. As shown in Fig.4(e),relative to 297 K(3.10 GPa)and 393 K(3.17 GPa),the absorption edge of the bismuth from 491 K(3.25 GPa)to 739 K(3.35 GPa)moves about 2 eV toward the low energy direction. In Fig.4(f),all the absorption edges of bismuth solids and liquids in the heating series of 4.54 GPa are pretty close to each other.
As can be seen from Fig. 5, we discuss the probability of LLPT of bismuth at high temperature and high pressure in the standardized absorption spectrum. There are three characteristic peaks A (2p3/2→6d), B (2p3/2→6d) and D (multiple scattering of neighboring atoms) in the liquid curve at theL3-edge. In Fig. 5(c), the main peak F (2p1/2→6d) of theL2-edge changes slightly, while the characteristic peak G moves about 4 eV to the direction of low energy. Figure 5(d)shows that the absorption edge of the liquid L and L′phases from 759 K(2.72 GPa)to 859 K(2.78 GPa)is the same,while above 859 K (2.78 GPa), the absorption edge moves 0.3 eV towards the direction of low energy. Figure 5(e)shows that in the series of 3.10 GPa,the liquid phase absorption edge always moves towards the high energy direction with the increase of temperature, and has obvious large changes from 809 K(3.38 GPa) to 819 K (3.38 GPa) and from 829 K (3.39 GPa)to 839 K(3.39 GPa),indicating that the phase transition may occur in these temperature ranges. BiL2-edges in the series of 4.54 GPa show a significant abrupt change (about 0.5 eV)from 729 K to 739 K, indicating that there may be a phase transition below 759 K. In the bismuth melt, the absorption edge moves to the direction of low energy with increasing temperature,which may be due to the fracture of the metallic bonding that weakens the action potential of other surrounding atoms on valence electrons,and the enhanced binding effect of the central nucleus on valence electrons, making the originally delocalized valence electrons tend to be localized.On the contrary, the absorption edge moves towards high energy, probably because the energy level of the atomic orbital increases with the increase of temperature,and the influence of temperature effect on the valence electrons is greater than that of the inner electrons. Therefore, the energy level of the valence electrons increases rapidly,which requires more energy for the inner electrons to jump outward. The absorption edges have opposite trends at different pressures because of the different degrees of fracture of the metallic bonding. Therefore,we guess that the influence of the fracture of the metallic bonding at an initial pressure of 2.48 GPa is much larger than that at 3.10 GPa with increasing temperature.
To compare the XANES spectra of the bismuth melt at different temperatures,the relative variations of XANES spectra were used to analyze the spectra. As shown in Figs.5(g),5(h) and 5(i), the shape of the relative variations at different temperatures can be divided into several groups at each pressure. The changes before label A and B in the 2.48 GPa series (label A and B in the 3.10 GPa series, label E and F in the 4.54 GPa series) correspond to the changes of DOS of 6d state, respectively. The differences near the label D indicate the different surrounding structures around the absorption atom. Although the difference between XANES spectra of bismuth melts is very small, the liquid—liquid phase change exists,and whether it is a first-order change is unclear. A new liquid—liquid boundary was predicted based on the XANES spectra as shown in Fig.2,in which we assume liquid—liquid phase boundaries are linear and the temperature about 1042 K of liquid—liquid phase transition obtained from our prediction at 0 GPa agrees with the experimental result.[25]
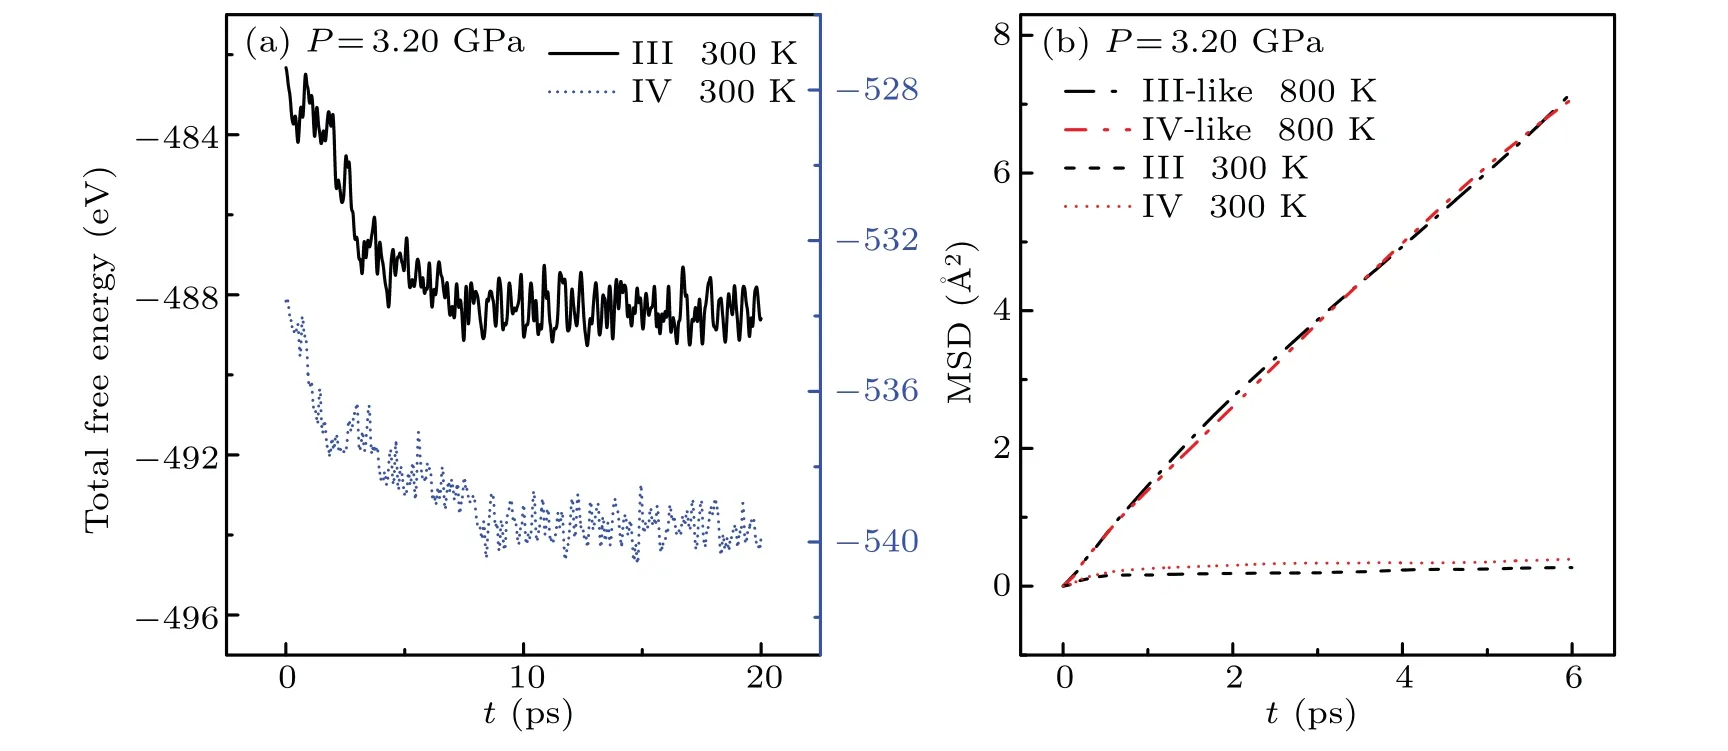
Fig.6. (a)Time-dependent total free energy of the simulation system with initial structure III or IV at 3.20 GPa and 300 K.(b)Time-dependent mean square displacement(MSD)of the simulation system with initial structure III or IV at 3.20 GPa and 300 K or 800 K.
To investigate the structure of bismuth melts using AIMD calculations, firstly, we explain the rationality of our AIMD simulations. As shown in Fig. 6(a), the two total free energies of the simulation system with initial structure III or IV at 3.20 GPa and 300 K trend to dynamic equilibrium after about 8 ps,indicating that our simulations have reached equilibrium for a time of 20 ps since the system of 300 K deviates furthest from the equilibrium system of 1500 K.MSD was calculated to evaluate whether the structure we obtained through AIMD is liquid or not. Figure 6(b)shows that both phase III-like and IV-like are liquid at 3.20 GPa and 800 K as their MSDs are linear with timetin the limit of large time.[49]For comparison,Fig.6(b)shows the MSDs of solid phases III and IV with 300 K at 3.20 GPa.
To study the electronic structures of the bismuth melt at different temperatures, we have calculated the total DOS of bismuth at low temperatures and high temperatures using the VASP code with different initial structures(phases I,II,III,IV and V),as shown in Figs.7(a), 7(b), 7(c), 7(d), and 7(e). All the calculations show that the total DOS of bismuth includes two broad bands from the Fermi energy to about-5 eV and-9 eV to-13 eV,which is similar to the amorphous and crystalline Bi.[23,34,56,57]The bandgap in all total DOS is decreasing as the pressure increases. Figures 7(a),7(b)and 7(e)show that the bandgap in the total DOS remains roughly constant when the temperature rises at pressures 1.50 GPa, 2.66 GPa and 5.97 GPa. However, in Figs. 7(c) and 7(d), the bandgap in the total DOS has opposite changes with increasing temperature, indicating that differentpelectron distributions at 3.20 GPa in different initial structures(phases III and IV).The non-zero total DOS of bismuth at Fermi level increases with rising temperature,which is consistent with the metallic properties of bismuth at high temperatures and pressures.[23,34]According to Fig. 7(f), with the increasing pressure, the Fermi energy of bismuth shifts to the high energy direction, which suggests that valence electrons become more localized as the pressure increases. On the contrary, the Fermi energy of bismuth shifts to the low energy direction with the temperature rising, which is expected because of the higher energy of the valence electrons with the temperature increasing, making it easier to excite.
According to the dipole transition theory, the absorption spectrum of theLedge of bismuth includes the contribution of transitions from 2pstates to 6s or 6d states. As the 6s state of bismuth is filled with electrons,so we only calculated the partial density of states(PDOS)of 6d orbital near the absorption edge using the FDMNES code to study the electronic structure characteristics of XANES spectra. We assume that there is no hybridization between the 6s and 6p states.As shown in Fig.8,the electronic PDOS of Bi 6d orbital has two peaks at 10 eV to 30 eV above the Fermi energy corresponding to the feature A and B in XANES spectra. When the temperature reaches 1000 K, the feature peaks of A and B decrease. Note that if there is a transition from IV-like to III-like, the PDOS of the 6d state increases, which is consistent with those of XANES spectra assuming that they undergo a phase transition from IVlike to III-like between 809 K and 819 K at 3.38 GPa as shown in Fig.5(h).

Fig.7. The total DOS of solid bismuth and liquid bismuth. (a), (b), (c), (d)and(e)Comparison of the electronic total DOS of bismuth with rising temperature from phases I,II,III,IV and V using the VASP code. (f)The shift of Fermi energy of bismuth structures(phases I,II,III,IV and V)with rising temperature using the VASP code.
According to Figures 8(c) and 8(d), comparing the 6d-PDOS of calculations from initial phase III and phase IV in the close pressure and temperature, the bismuth melts formed by different initial structures under different pressures have different electronic structures, which indicates that the liquid may have different structures. To investigate the relationship between the electronic structure and the bismuth melt from different initial structures, we have calculated PDOS of a series of configurations of stable bismuth melts from the thermodynamic equilibrium system phase III-like and phase IV-like at 3.20 GPa and 800 K, respectively. The PDOS of phase IIIlike melt and IV-like melt under the same condition(3.20 GPa and 800 K)can be divided into two different groups,as shown in Fig.8(f), which proves the relationship between electronic structure and the microstructure of the bismuth melt formed by different initial structures.
To prove that different initial structures may result in different structures of bismuth liquid,we calculated the pair distribution functions of phase III-like and IV-like at 3.20 GPa and 800 K in the equilibrium system of 1.2 ps. As shown in Fig.9(a),the nearest neighbor distance of the III-like phase is about 3.20 °A less than about 3.30 °A of the IV-like phase.The typical pair distribution function of Bi melt at atmospheric pressure has a main peak and shoulder.[25]According to the pair distribution function, the coordination numbers of the main peak ranging from 2.60 °A to 4.03 °A and the shoulder ranging from 4.03 °A to 5.42 °A of the III-like and IV-like phases are calculated. As shown in the inset of Fig.9(a),the coordination number of the main peak of the III-like phase is 9.07 and about 0.24 less than that of the IV-like phase. Both coordination numbers of the main peak ours and Ref. [35] are approximately 8.99. The coordination number of the shoulder of the III-like phase is 9.15 and about 0.73 greater than the shoulder of the IV-like.The calculated total coordination numbers of the main peak and shoulder at high pressure are close to those at atmospheric pressure, and we speculate that the atoms of the shoulder may be pushed into the main peak when the pressure increases.[25]Also, we compare the microstructure of these liquids through the bond orientational order parameterQl. Here, we choseQ6(l=6) as the specific local order parameter formula because it has good performance in liquid.[53,54]As shown in Fig. 9(b), when III-like liquid and IV-like liquids have the same total atoms,the number of atoms in different distribution ranges of order parameterQ6has a clear difference, suggesting their different structures. Note that phase III-like and phase IV-like can be obtained under the same conditions,which may be related to the existence of potential barriers between them.
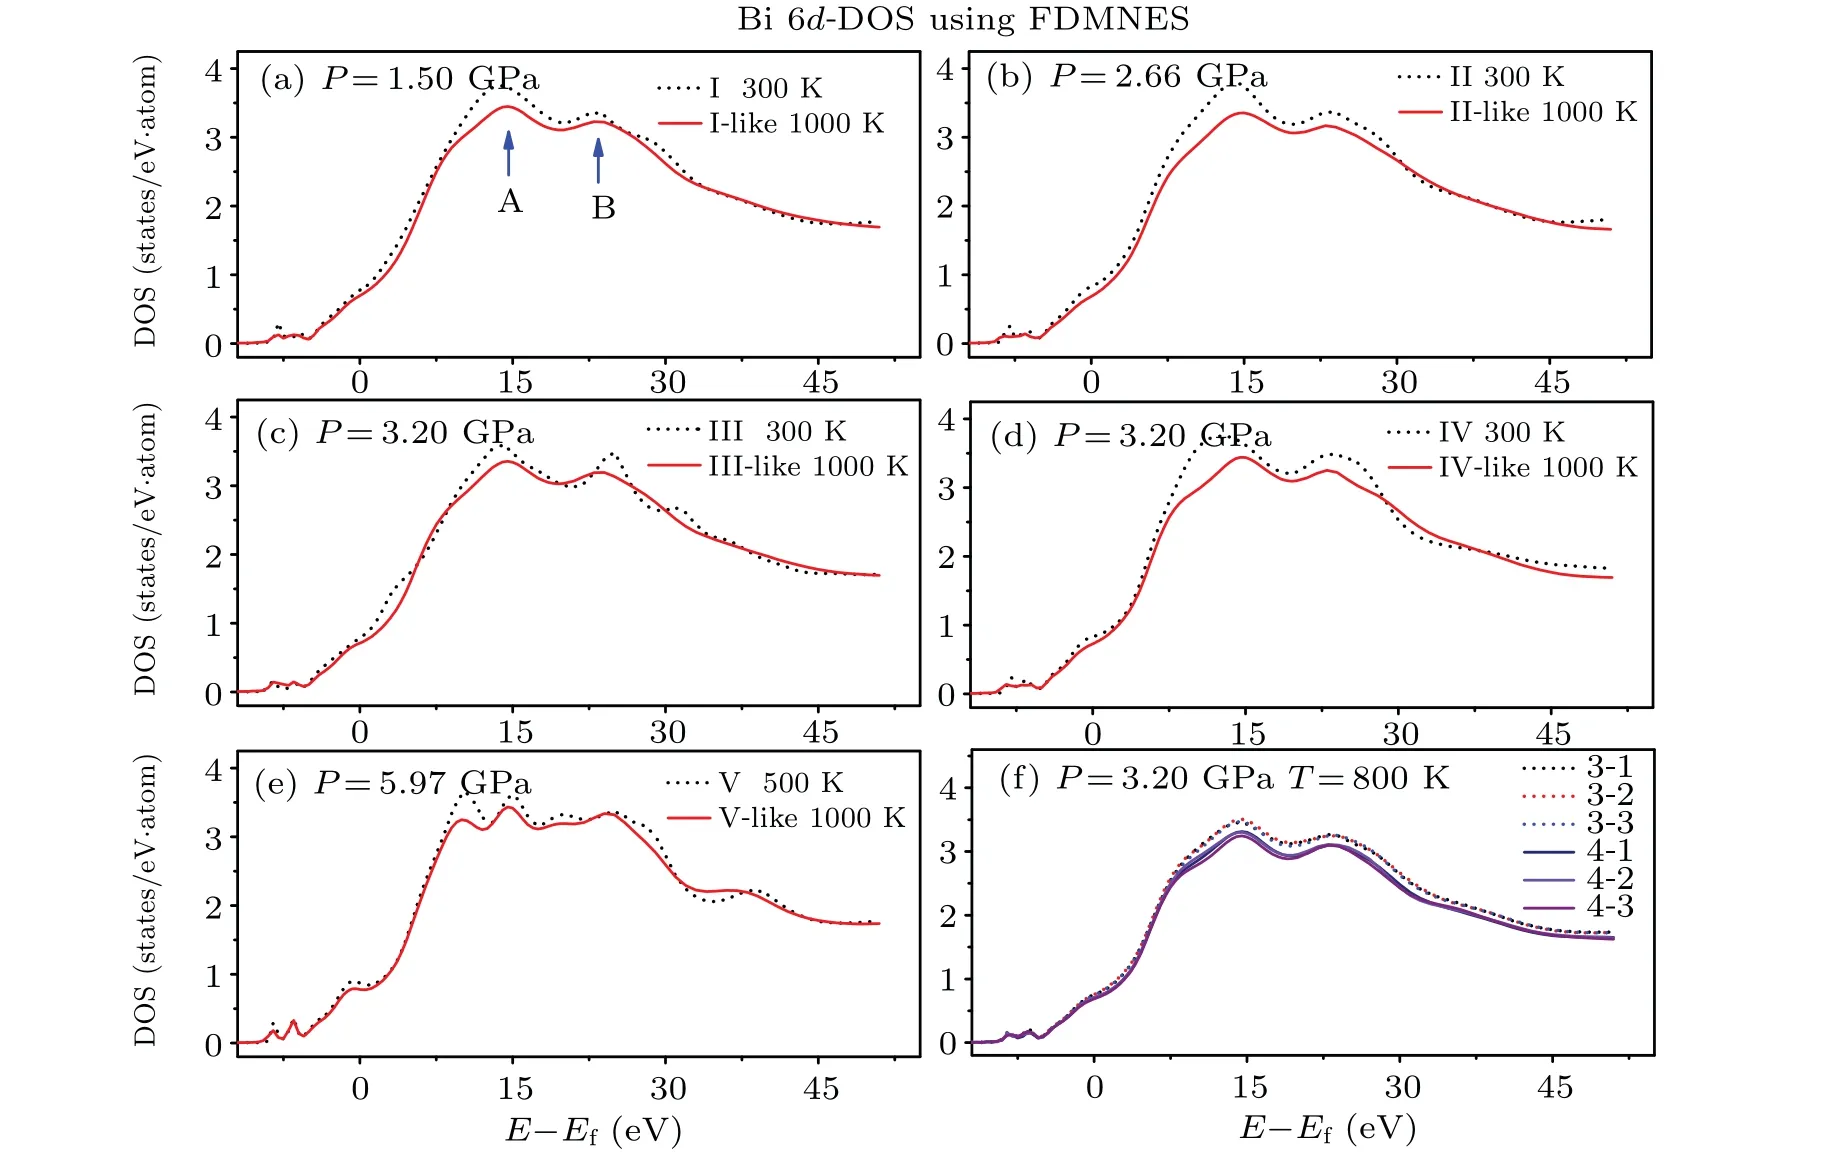
Fig.8. (a),(b),(c),(d)and(e)Comparison of the electronic PDOS of Bi 6d orbital with rising temperature from phases I,II,III,IV and V using the FDMNES code. (f)The electronic PDOS of bismuth melts at 3.20 GPa and 800 K from different initial structures.
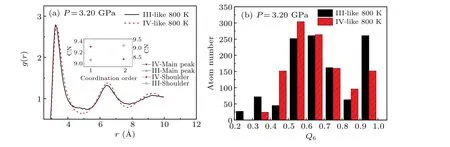
Fig. 9. (a) Comparison of the pair distribution function of bismuth melts at 3.20 GPa and 800 K from different initial structures (phase III and phase IV)using AIMD.The coordination number(CN)is calculated using the pair distribution function of bismuth melts. (b)Comparison of the distribution of the order parameter in bismuth melts(phase III-like and phase IV-like). We calculated the order parameter employing 1152 atoms.
5. Conclusion
In summary, we have investigated the phase transitions of bismuth with increasing temperature at the initial pressures 2.48 GPa,3.10 GPa and 4.54 GPa using XANES spectra measurements. According to the similarity of characteristic peaks of XANES spectra at high pressures and temperatures,the sequences of phase transitions of bismuth are phase I→phase III→phase IV→phase L→phase L′→phase L′′at initial pressure 2.48 GPa,phase III→phase IV→phase L→phase L′→phase L′′at initial pressure 3.10 GPa and phase III→phase V→phase L→phase L′′at initial pressure 4.54 GPa.The lack of phase II in the 2.48 GPa series and phase IV in the 4.54 GPa series is probably due to their narrow phase region. The other phases obtained from the XANES spectra are well consistent with the previous research results. Two stable phases (III-like and IV-like) of bismuth melt under the same condition (3.20 GPa and 800 K) are obtained, which are consistent with those of the XANES spectra assuming that they undergo a phase transition from IV-like to III-like between 809 K and 819 K at 3.38 GPa by calculating their PDOS of Bi 6d states. The possible phase boundaries of LLPTs are 779—799 K at 2.74 GPa and 859—879 K at 2.78 GPa, 809—819 K at 3.38 GPa and 829—839 K at 3.39 GPa and 729—739 K at 4.78 GPa,respectively.
Acknowledgements
The authors would like to acknowledge the contribution of Lirong Zheng (BSRF). The X-ray absorption experiments were carried out at the 4W1B-XAFS experimental station (BSRF). Experiments of XANES were performed at the BL15U experimental station(SSRF).
This work was supported by the CAEP Foundation(Grant No.CX2019002),the Science Challenge Project(Grant No. TZ2016001), and the National Natural Science Foundation of China (Grant Nos. 11602251, U1730248, and 11802290).
猜你喜欢
凤凰动漫(军事大王)(2022年9期)2022-11-05
凤凰动漫(军事大王)(2022年5期)2022-08-22
凤凰动漫(军事大王)(2022年1期)2022-04-19
颂雅风·艺术月刊(2020年6期)2020-05-26
小学科学(学生版)(2019年7期)2019-08-01
作文大王·低年级(2019年3期)2019-04-19
爱你(2018年10期)2018-11-14
爱你·心灵读本(2018年4期)2018-09-10
初中生世界·九年级(2017年7期)2017-09-06
军事文摘·科学少年(2017年4期)2017-06-20

- Chinese Physics B的其它文章
- A nonlocal Boussinesq equation: Multiple-soliton solutions and symmetry analysis
- Correlation and trust mechanism-based rumor propagation model in complex social networks
- Gauss quadrature based finite temperature Lanczos method
- Experimental realization of quantum controlled teleportation of arbitrary two-qubit state via a five-qubit entangled state
- Self-error-rejecting multipartite entanglement purification for electron systems assisted by quantum-dot spins in optical microcavities
- Pseudospin symmetric solutions of the Dirac equation with the modified Rosen–Morse potential using Nikiforov–Uvarov method and supersymmetric quantum mechanics approach