
Nanobubbles produced by hydraulic air compression technique
2022-05-16 07:10XiaodongYang杨晓东QingfengYang杨庆峰LiminZhou周利民LijuanZhang张立娟andJunHu胡钧
Chinese Physics B 2022年5期
关键词:利民
Xiaodong Yang(杨晓东) Qingfeng Yang(杨庆峰) Limin Zhou(周利民)Lijuan Zhang(张立娟) and Jun Hu(胡钧)
1Shanghai Institute of Applied Physics,Chinese Academy of Sciences,Shanghai 201800,China
2Shanghai Advanced Research Institute,Chinese Academy of Sciences,Shanghai 201204,China
3Shanghai Tech University,Shanghai 201210,China
4University of Chinese Academy of Sciences,Beijing 100049,China
Keywords: nanobubble,water remediation,nanobubble generation,dissolved oxygen,hydraulic air compression
1. Introduction
Nanobubbles are gas filled bubbles with the size less than 1 micron in bulk water or solution and proved to have a long lifetime of several hours to months.[1–4]Even though their stable mechanism is still unclear currently, they have already displayed excellent applications in a wide range of fields, such as higher efficiency in mineral flotation,[5]fast transportation,[6–8]good carriers in biomedicine,[9–11]oxygen enrichment in agricultural and aquaculture,[12–14]surfactantfree cleaning,[15]etc.Another promising application of nanobubbles is sewage disposal and odorous water treatment.It was reported that nanobubbles can effectively improve the water quality by increasing the oxygen content and degrading organic matters in water.[16–20]However, face to the coastal water anoxia which has already been a serious problem all over the word,[21–25]the existing techniques, such as subsurface aeration or surface water downwelling,are very costly and complicated to operate,[23,26]even causing some negative effects.[21,23,26,27]For example, the major fishery areas— the Baltic, Kattegat, Black Sea, Gulf of Mexico, and East China Sea — are suffering ecological degradation and loss of biomass as a result of coastal hypoxia.[22]Main research to restore coastal hypoxia mainly focuses on the approaches of artificial downwelling of nearly saturated dissolved oxygen surface water to hypoxic bottom. Unfortunately, considering to the expensive cost, artificial downwelling of surface water could not be used on a large scale. It also brings some serious risks,such as associated changes in bottom water habitats,exacerbating the bottom hypoxia by surface organic matter and microorganism,low density surface water floating up.[23]Therefore,a low cost and effective technique need to be developed urgently.
The key issue for improving the situation of coastal water anoxia is how to create oxygen enriched water and transport them to the bottom of ocean. Nanobubbles are proved a good way to bring high concentration oxygen. For the production of nanobubbles,there are many methods to produce nanobubbles currently, such as the exchange of water and ethanol,[28]electrochemical method,[29,30]direct immersion,[31]dynamic cavitation,[32]temperature change,[33]cold water adding,[34]ultrasonic generation, and vibration,[35]etc.Although these methods are good for the research in laboratories, their production efficiency and costs limit the application in large area and high depth coastal water.
A technique,hydraulic gas compression(HAC),was used firstly to collect compressed air at a very low cost for mine ventilation in 1890 in Ontario by Charles Taylor.[36,37]This HAC technique utilizes the height difference to create a hydropower to entrain gas(air)to form a certain amount of bubbles under the water.[36,38]Figure 1 gave the main parts of this technique. It includes dam, down/up pipes and one separation tank. The general principle was described as follows. At first water flows downward through a downpipe, then passes the large tank at depth, finally rises up through the uppipe.A small tube, connecting the atmosphere, is set at the entrance of the downpipe. Since the pressure in the entrance of the downpipe is below atmospheric pressure, air is entrained into the downpipe. The air bubbles are carried down by the down-moving water in the downpipe. In the large separation tank,bubbles are released from the water and compressed air is collected.[36,38]However, whether nanoscale gas bubbles could be formed by this HAC technique or not? If it could produce nanobubbles,this technique might be used to resolve the deficiency of ocean.
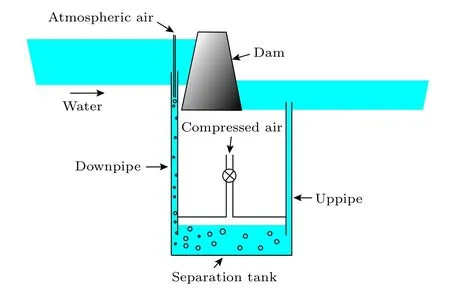
Fig.1. Schematic diagram of HAC.
In this paper,we improved the HAC technique and proved it could produce nanobubbles in water. The size distribution and concentration of produced nanobubbles were detected by nanoparticle tracking analysis (NTA). Degassed experiments were performed to prove that the formed “nanoparticles” are gas nanobubbles. Furthermore, the dependence of nanobubble concentration on the height of the downpipe was investigated. At the same time, dissolved oxygen was measured.Finally,the possible mechanism of nanobubble formation was also presented.
2. Experimental details
2.1. Materials
Two water plastic tanks (about 25 L) and tap water (at room temperature)were used in this experiment. Transparent teflon pipes with an inner diameter of 6 mm and an outer diameter of 8 mm were used as downpipe as showed in Fig.2. To eliminate the influence of pollutants, the glass container and syringes used in the experiment were cleaned by ultrasound and dried at 150°C in the vacuum chamber(Keelrein Instrument Co.,Ltd)before use.A valve used in air entrance to open or close the air entering to downpipe.
2.2. The setup of HAC and the production of nanobubbles
According to the principle of HAC, we designed the setup to produce nanobubbles in our experiments as showed in Fig. 2. It was simplified and slightly adjusted. Tap water was first put into water tank 1 and flowed out horizontally,then vertically downward into water tank 2. The position of air entrance was located near the corner of horizontal and vertical tubes. During the experiments, macro or microscale gas bubbles could be observed in downpipe by eye. This might provide the air resource for the formation of nanoscale gas bubbles. We called the water in tank 2 as HAC water in the followed experiment.
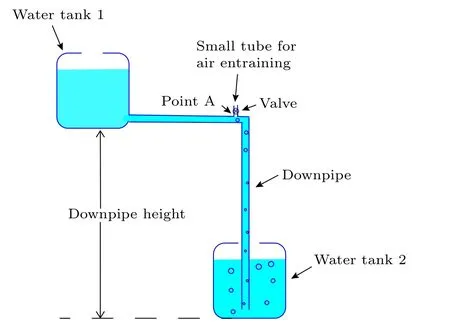
Fig.2. Schematic diagram of experimental setup.
We measure the concentration of“nanoparticles”in HAC water with NTA.We conducted the experiments at 6 different downpipe heights(the vertical height of water tank 1 and water tank 2), namely, 0.5 m, 1.0 m, 2.0 m, 3.5 m, 7.0 m, and 10.5 m. At each height, experiments were repeated for several times and the results were averaged. When measuring the concentration of “nanoparticles”, we also measured the dissolved oxygen of each HAC water by Thermo Scientific Orion VERSA STAR Advanced Electrochemistry Meter&Modules.
2.3. Controlled experiments
In order to prove that the “nanoparticles” generated by this HAC method are indeed nanobubbles,three kinds of controlled experiments were conducted. First,the concentrations of nanoparticles in ordinary tap water in the water tank 1 were measured. Second, the concentration of nanoparticles in degassed HAC water were measured. The operation was as follows.After measured the concentration of the“nanoparticles”,the HAC water was put in the vacuum drying oven for 4 hours.After degassing for 4 hours,the concentration of the“nanoparticles”in such degassed HAC water was measured again. The measuring of the tap water and the degassed HAC water was also repeated for several times and the results were also averaged.Thirdly,to exclude the contamination from teflon pipe or water tank,we closed the air intaking tube,letting water flow,with no air taking in,from the water tank 1 down to water tank 2.Again,we measured the concentration of“nanoparticles”in water tank 2.
2.4. Nanoparticle tracking analysis measurement
The NTA(NS300,NanoSight instrument)was used with a blue laser light source(65 mW,λ=405 nm)to measure the size and concentration of nanobubbles. It was equipped with a 20-magnification microscope and a high speed camera. When the laser light struck on the bubbles,scattering faculae formed.The track of scattering faculae was recorded by the high-speed camera. Each result was obtained from the average of five measurements, and the movie was last for 60 s, captured at 20 frame/s. The camera level was usually set at 10,the threshold was set at 15 and the solution viscosity was 1 CP.The optical field of view was fixed(approximately 100 μm×80 μm)and the depth of the illuminating beam was approximately 10 μm. Here, the size of the individual nanobubble could be calculated with its diffusion from Brownian motion. The number of nanobubbles was counted by NTA. In this experiment,the measurements of concentration of formed nanobubbles were repeated 3 times for each sample.
3. Results and discussion
3.1. Nanobubbles generated by HAC method
In the whole experiments, NTA was used to detect the size distribution and concentration of formed nanobubbles using HAC method. Tap water without HAC was used as the control. As shown in Fig.3(a),the concentration of nanobubbles without HAC detected by NTA in tap water was about(1.6±0.4)×107mL-1.But the concentration of nanobubbles in HAC water would increase to(4.6±1.0)×107mL-1when the height of downpipe was about 10.5 meters,which is about 3 times than that of tap water. Figure 3(b) gave the size distributions of nanobubbles formed in tap water and HAC water.It was found that the concentration of the total“nanoparticles”shows a sharp increase from tap water to HAC water.The sizes of most of “nanoparticles” are below 300 nm. For tap water,the peaks are at 110 nm and 140 nm but they change to 60 nm,90 nm, and 120 nm for HAC water. These results indicated that nanobubbles would be produced by HAC method.
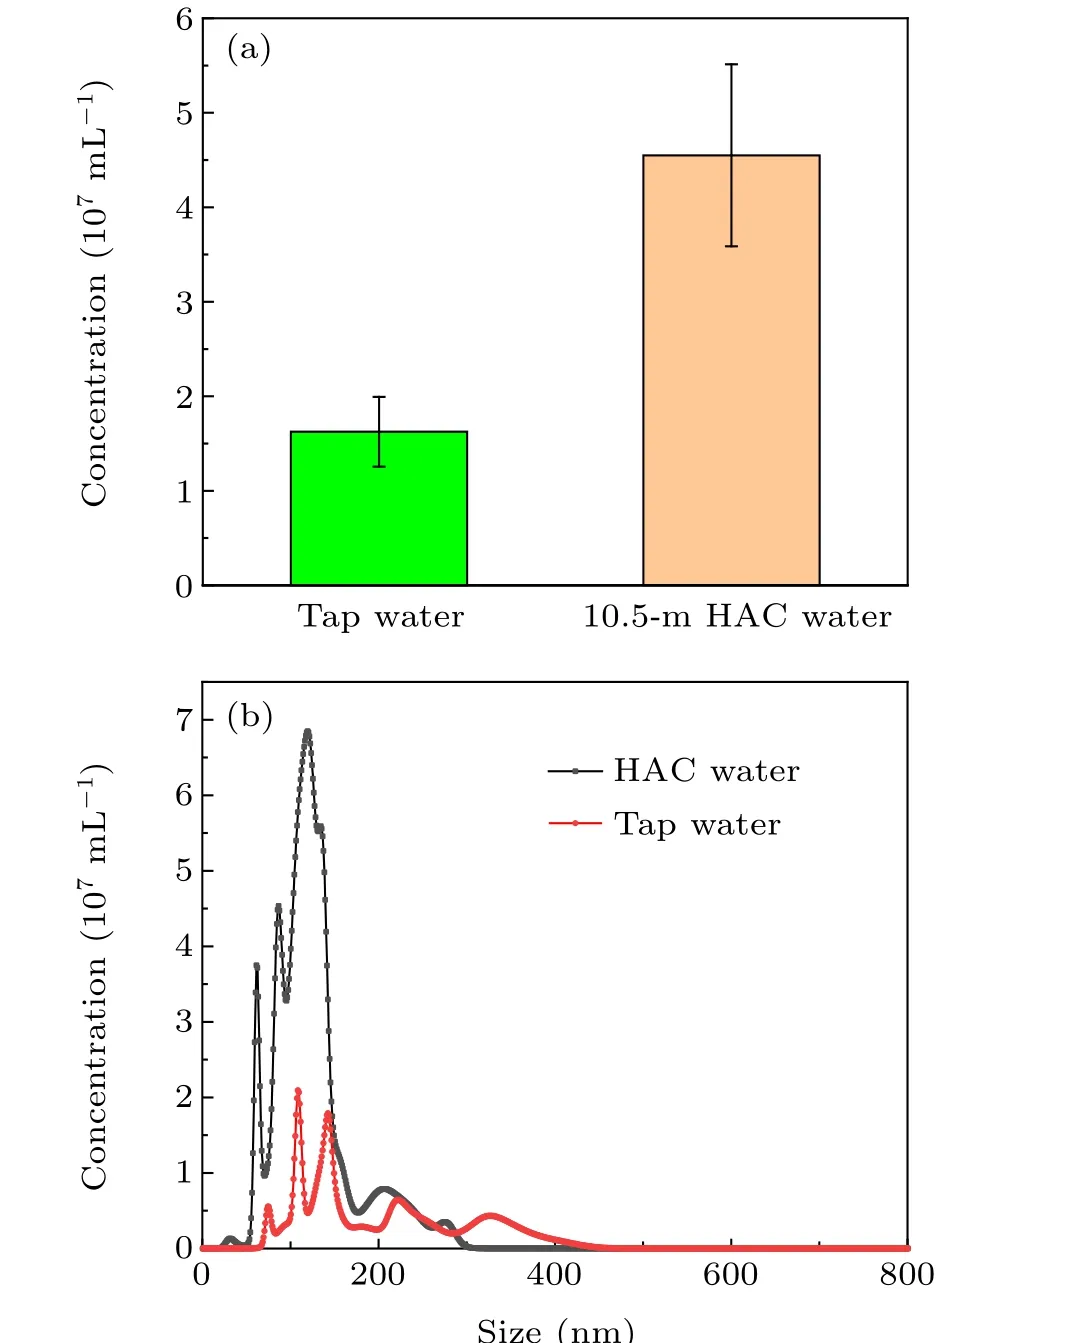
Fig.3. (a)The concentration of nanobubbles produced by HAC method. (b)Size distribution of nanobubbles in HAC water and tap water.
3.2. The confirmation of formed nanobubbles
In order to verify that the observed “nanoparticles” produced by the HAC were indeed gas nanobubbles rather than contaminations, two controlled experiments were conducted.First, degassed experiments of HAC water were performed after nanobubble measuring in HAC water. Secondly, the HAC water was measured while the air intaking tube was closed and no extra gas entered the downpipe. We measured the concentration of “nanoparticles” in water obtained by above two control experiments. The typical results were shown in Fig. 4. It was found that the nanobubble concentration ((4.6±1.0)×107mL-1) of HAC water (10.5-m height)was much higher than that of water without air intaking((1.7±0.1)×107mL-1)and it would decrease largely after degassing ((1.3±0.2)×107mL-1), which also excluded the possibility of volatile oil droplets. Those results proved that the formed“nanoparticles”are gas inside,not contaminations. Therefore, it can be concluded that a large number of nanobubbles could be produced using HAC method.
In order to know that whether more oxygen was dissolved in HAC water or not, we measured the concentration of dissolved oxygen in tap water and HAC water. The main results were shown in Fig. 5. The average dissolved oxygen in tap water was about 7.0±0.4 mg/L but it increases to 12.3±2.7 mg/L in HAC water. This proved that more oxygen (air) dissolved into the water using HAC method, which will be the main source for the formation of nanobubbles.
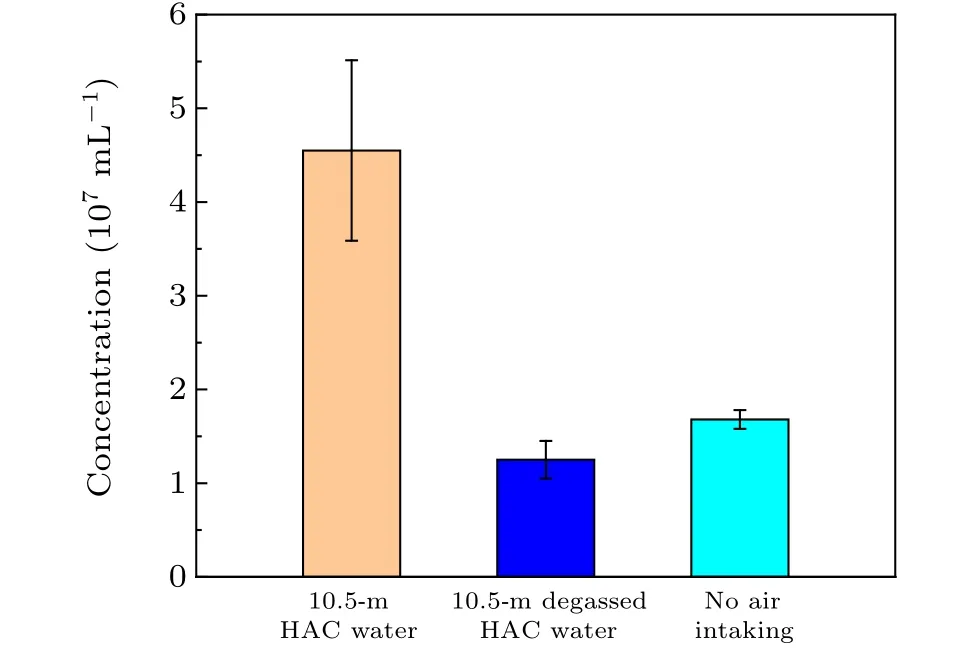
Fig. 4. The comparison of concentrations of nanobubbles in HAC water(10.5-m height),the degassed HAC water(10.5-m height),and tap water just flowed down without air intaking.
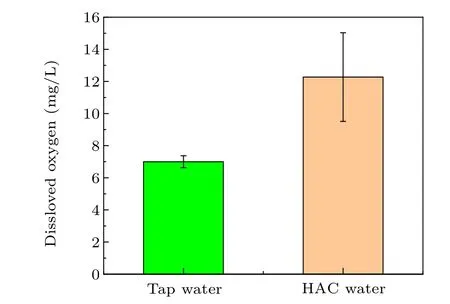
Fig.5. The concentration of dissolved oxygen in tap water and HAC water.
3.3. Dependence of nanobubble concentration on the downpipe heights
We further explored the influence of downpipe height on the concentration of nanobubbles.As mentioned in the experimental section,we measured the concentration of nanobubbles by changing the height of downpipe,such as 0.5 m,1 m,2 m,3.5 m,7 m,and 10.5 m,respectively.The degassed HAC water was also be measured as control in different downpipe heights accordingly.
Figure 6 presented the average concentrations of nanobubbles in each HAC water and degassed HAC water at different downpipe heights. As the downpipe height increases,the concentration of formed nanobubbles in HAC water would increase gradually. It could increase from (2.9±0.4)×107mL-1to(4.6±1.0)×107mL-1when the height of downpipe increases from 0.5 m to 10.5 m.Quite obviously,the concentrations of nanobubbles in degassed HAC water were at the range of 1.2×10⁷mL-1to(1.8±0.2)×107mL-1,almost equal to that of tap water,independent on the downpipe heights.This also indicated that nanobubbles produced are gas inside.
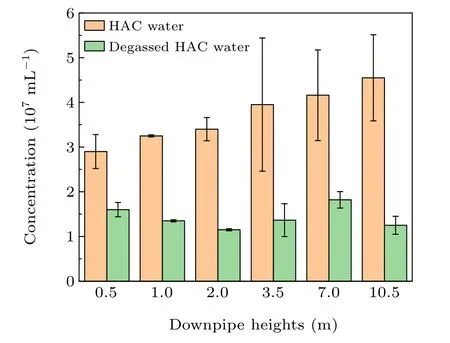
Fig.6. The dependence of concentration of nanobubbles in HAC water(yellow)on the downpipe heights. The degassed HAC water(green)at different downpipe heights was also measured as controlled experiments.
As the experimental results showed above,the height difference is a key point for the concentration of nanobubbles.It could be imaginative that if the downpipe height is higher enough, the concentration of nanobubbles would increase largely.
3.4. Possible mechanism of the formation of nanobubbles by HAC method
Here we would give our explanation how HAC method could produce nanobubbles. As shown in Fig.2,an air intake design is set at the corner. Using Bernoulli equation at point A,we get
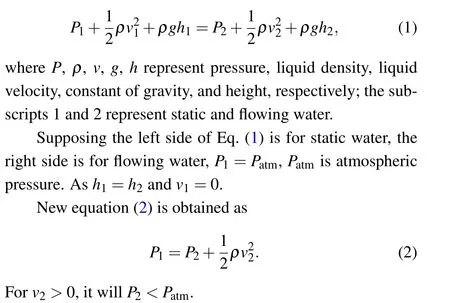
The pressure at point A for flowing water is below atmospheric pressure.As a result,air is entrained into the pipe,then carried along by the deepening water. In the downpipe, the intaking air will undergo sufficient churning, turbulence and shearing, mixing well with down-moving water. During the experiments,macro and tiny bubbles can be seen in the downpipe. These reasons would induce the formation of nanobubbles.
The dependence of the concentration of nanobubbles on the downpipe height may be attributed to three reasons. First,the higher downpipe height means the higher velocity of the flowing water. According to Bernoulli equation,higher speed indicates lower pressure. Lower pressure will cause more air entrained into the pipe.More bubbles could be produced.Second,the higher downpipe heights mean more flowing time in the downpipes,so the air may form more nanobubbles. Third,according to liquid pressure formula, ΔP=ρgh, the higher water column in the downpipe will cause higher water pressure,which will help to compress big bubbles to tiny and nano bubbles.
4. Conclusion
In our experiments, the nanobubbles were produced by the method of HAC and their size distribution and concentrations were measured by NTA. Results showed that sufficient nanobubbles could be produced by HAC method. More importantly, the concentration of nanobubbles was directly proportional to the downpipe heights. The measurements of dissloved oxygen in tap water and HAC water indicated that higher concentration dissolved oxygen might be the source of the formation of nanobubbles.Degassed results further proved that produced“nanoparticles”are indeed gas nanobubbles.
For improving the anoxia of ocean water, the advantage of HAC technique not only lies in low cost and high efficiency,but also can avoid some negative effects. For example,we can use bottom water as circulating water instead of surface water,avoiding the potential risks of destruction of seabed ecology or increasing oxygen consumption on the seafloor. Therefore,it is expected that the HAC technique would be used in water oxygenation and remediation in ocean in the future.
Acknowledgments
Project supported by the National Natural Science Foundation of China (Grant Nos. 11874379, 11575281, and U1532260) and the Knowledge Innovation Program of the Chinese Academy of Sciences (Grant Nos. KJZD-EW-M03 and QYZDJ-SSW-SLH019).
猜你喜欢
——戎利民教授
生物骨科材料与临床研究(2022年4期)2022-08-18
选煤技术(2022年1期)2022-04-19
民间文学(2021年6期)2021-11-20
文化交流(2020年12期)2020-12-28
新农业(2020年9期)2020-10-30
少先队活动(2020年9期)2020-10-28
华人时刊(2019年13期)2019-11-26
小学生作文·小学低年级适用(2016年8期)2017-01-16
党的生活(黑龙江)(2016年8期)2016-08-15
营销界(2015年22期)2015-02-28

- Chinese Physics B的其它文章
- A nonlocal Boussinesq equation: Multiple-soliton solutions and symmetry analysis
- Correlation and trust mechanism-based rumor propagation model in complex social networks
- Gauss quadrature based finite temperature Lanczos method
- Experimental realization of quantum controlled teleportation of arbitrary two-qubit state via a five-qubit entangled state
- Self-error-rejecting multipartite entanglement purification for electron systems assisted by quantum-dot spins in optical microcavities
- Pseudospin symmetric solutions of the Dirac equation with the modified Rosen–Morse potential using Nikiforov–Uvarov method and supersymmetric quantum mechanics approach