
Regional Differences in the Income of Farmers and Herdsmen in Inner Mongolia
2014-04-10 06:56MiaomiaoXU
Asian Agricultural Research 2014年2期
Miaomiao XU
College of Economics and Management,Southwest University,Chongqing 400700,China
1 Introduction
Inner Mongolia Autonomous Region,is an autonomous region of the People's Republic of China,located in the northern region of the country.Inner Mongolia shares an international border with Mongolia and Russia.Its capital is Hohhot.Other major cities include Baotou,Chifeng,and Ordos.It is the third-largest subdivision of China spanning about1 200 000 km2or12%of China's total land area.It has a population of24 706 321 as of2010 census,sharing 1.84% of Mainland China's population,Inner Mongolia is the 23rd populous province-level division.Due to the great expanse,there are great differences in resource endowments and levels of economic development between the leagues or cities,and the regional differences in the per capita net income of farmers and herdsmen are obvious.Since the reform and opening up in 1978,China's economy has maintained rapid growth,and especially in 2006 and 2007,China's GDP growth rate reached 10.7%and 11.4%,respectively.During the"Eleventh Five-Year"period,the economic development was dramatic in rural pastoral areas of Inner Mongolia,and the food production continued to hit new highs;the prices of agricultural and livestock products rose,and the non-farm employment opportunities of farmers and herdsmen increase,with rising wage rates;the state and the autonomous region intensified subsidy to"agriculture,countryside and farmers".
Despite the economic boom and constantly rising living standards of residents in recent years,the income gap between urban and rural residents in Inner Mongolia is expanding and this widening gap still continues,from the Gini coefficient as a measure of income distribution gap.From 2000 to 2008,the average annual growth rate of per capita GDP in Inner Mongolia was17.3%,but disposable income growth rate of urban residents was only 11.3%in the same period,and per capita net income growth rate of farmers and herdsmen was only 8.7%,which was significantly lower than GDP growth rate.In 2008,the per capita GDP in Inner Mongolia was equivalent to 146.3%of the national average,but the per capita net income of farmers and herdsmen was 4 656 yuan,equivalent to only 97.8%of the national average.And in 2009 this figure fell to 95%.
2 Current situation of income of farmers and herdsmen in Inner Mongolia
2.1Per capita net income of farmers and herdsmen The income of farmers and herdsmen has grown rapidly,and Inner Mongolia continues to strengthen various policies for benefiting agriculture and animal husbandry,make every effort to broaden the income channels for the farmers and herdsmen,and adopt various measures to increase farmers'income.Per capita net income of farmers and herdsmen was increased from 2 086 yuan in 2002 to 5 530 yuan in 2010,and it even reached 12%in 2010.
At present,the ranking of the per capita income of farmers and herdsmen in Inner Mongolia among provinces and autonomous regions in the country has risen from 22nd in2002 to16th,leading the western provinces for nine consecutive years.

Table 1 The grow th of income of farmers and herdsmen in Inner M ongolia during the period 2001-2010 Unit:yuan/person
In 2005,the per capita cash income of farmers and herdsmen in Inner Mongolia was 2 988.87 yuan,and increased to 5 529.6 yuan in 2010,an average annual increase of13.1%,0.4 percentage points higher than the national average growth rate.In 2006,2007,2008,2009 and 2010,the net income of farmers and herdsmen reached 3 341.9 yuan,3 953.1 yuan,4 656.2 yuan,4 937.8 yuan and 5 529.6 yuan,respectively,an increase of 11.8%,18.3%,17.8%,6.1%and 12.0%.
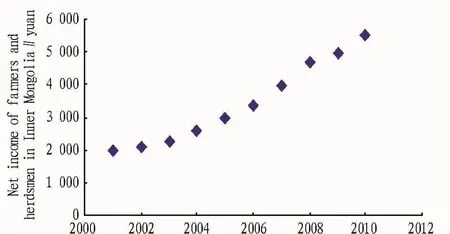
Fig.1 The scatter plot of net income of farmers and herdsmen in Inner Mongolia during the period 2001-2010
As can be seen from Fig.1,the per capita net income of farmers and herdsmen Y,changes exponentially with time t.According to the characteristics of scatter plot,the exponential model of Y and t is established:

Take logarithm of both sides:ln Y=ln a+t×ln b.
We use the logarithm of per capita net income of farmers and herdsmen in Inner Mongolia during the period 2001-2010 to carry out year regression.The value was1 in 2001 and 10 in 2010.The regression analysis is carried out in SPSS and we get the following table results.

Table 2 The model summarization
As can be seen from Table2,the coefficient of determination R=0.983,indicating that the year explains98.3%of total variance of net income of farmers and herdsmen.
As can be seen from Table 3,at the 5%significance level,the regression coefficients pass t test,and p value is very small,close to 0.It indicates that the regression effect is good,and we get the following regression equation:

We further get the function relationship between rural and pastoral per capita net income and year:


Table3 Per capita net income of farmers and herdsmen-annual regression coefficient table
2.2Changes in the structure of per capita net income of farmers and herdsmen
2.2.1 The monetization of income form.With agricultural production socialization and accelerated marketization process,the self-sufficient peasant economy has been gradually replaced by the market economy.The constant growth of wage income,property and transfer income promotes the cash income of farmers and herdsmen to increase rapidly(Table 4).
In 2005,the per capita cash income of farmers and herdsmen in the region was 2 462.5 yuan,and it reached 4 575.1 yuan income in 2010,five-year increase of2 112.6 yuan,an average annual increase of422.5 yuan.The proportion of cash net income to annual net income also increased from 82%in 2005 to82.7%in 2010.

Table 4 The structure of per capita income of farmers and herdsmen in Inner Mongolia during the period 2001-2010 Unit:yuan/person
2.2.2 The diversification of income sources.Inner Mongolia is a traditional agricultural and pastoral area,and the income structure of farmers and herdsmen has long been simple.But in recent years the situation has changed.The proportion of family operating income to net income continuously declines,and the proportion of wages,property,transfer and other non-farming incomes is gradually increased,so there is a trend of diversification of income of farmers and herdsmen in this region.A lot of financial subsidies have broadened the income sources,and directly contribute to the increase in farmer income.
In 2010,the per capita wage income of farmers and herdsmen reached 1036.8 yuan in this region,accounting for 18.2%of net income,an increase of 1.9 percentage points compared with 2005;the property net income reached 164.3 yuan,accounting for 3%of net income,an increase of0.6 percentage points compared with 2005;the transfer net income reached 658.6 yuan,accounting for11.9%of net income,an increase of5.6 percentage points compared with 2005.
Meanwhile,it can be seen from Fig.2 that the proportion of transfer and property incomes shows relatively stable upward trend over the past 10 years,and the proportion is increasingly higher;the proportion of family operating income shows a clear downward trend,and despite the absolute proportion,the proportion declines significantly;the proportion of wage income is small,and the change is relatively stable,without clear upward or downward trend.
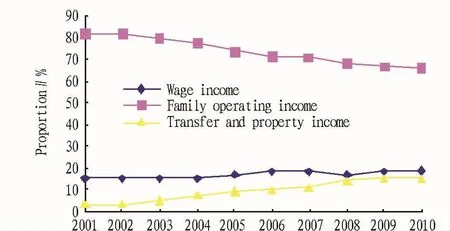
Fig.2 The line chart of proportion composition of per capita net income of farmers and herdsmen
2.2.3 Stably ranking first among the 12 western provinces and municipalities.In 2001,the CPC Central Committee launched the western development strategy initiatives.The western regions refer to Shaanxi, Gansu, Ningxia, Qinghai, Xinjiang, Sichuan,Chongqing,Yunnan,Guizhou,Tibet,Guangxi,and Inner Mongolia.
During the"Eleventh Five-Year"period,the income of farmers and herdsmen in Inner Mongolia was always in the first place among 12 provinces,autonomous regions and cities.In 2005,the income was 180 yuan higher than that of Chongqing which was in the second place;the income was 1112 yuan higher than that of Guizhou Province which was at the bottom.The income was 253 yuan higher than that of Chongqing which was in the second place;the income was 2 105 yuan higher than that of Gansu Province which was at the bottom.
3 Empirical analysis of econom ic integration in Inner Mongolia
Due to the great expanse,there are great differences in resource endowments and levels of economic development between the leagues or cities,and the regional differences in the per capita net income of farmers and herdsmen are obvious.In order to better analyze the per capita net income of farmers and herdsmen in various regions,we use factor and cluster analysis to classify the 12 leagues and cities in Inner Mongolia Autonomous Region.
To further understand the net income of farmers and herdsmen in Inner Mongolia,we use the published statistics on some leagues and cities of Inner Mongolia(Table 5),and use modern statistical methods to process these data for analysis.We carry out KMO test and Bartlett's test of sphericity on some economic indicators in various leagues and cities of Inner Mongolia in 2009(Table 6),and KMO test value is0.632,indicating that there is correlation between the original variables,suitable for factor analysis.

Table 5 Some economic indicators on leagues and cities in Inner Mongolia in 2009

Table 6 KMO and Bartlett's test
Table 7 shows the eigenvalues and variance contribution rate at various stages of the factor analysis,and there are three factors with eigenvalues greater than 1.The two corresponding common factors should be extracted.At the same time it can be seen that the first three factors can explain 84.572%variance of the original variables,and have already contained most of the information.
The rotated coefficient of load has been clearly differentiated(Table 8).The first common factor has a greater load on Rate of non-farm and livestock practitioners and the number of persons with education level of high school per one hundred labor forces,indicating that these indicators have higher correlation and can be classified as a class,named social factors.
The second common factor hasa great load on added value of secondary industry and added value of tertiary industry,indicating that there is correlation between these indicators.They can be classified as a class,named social factors.
The third common factor has a great load on electricity consumption,crop growing area,total power of agricultural and animal husbandry machinery,added value of service industry in agriculture,forestry,animal husbandry and fishery and chemical fertilizer application rate.They can be also classified as a class,named agricultural and animal husbandry factor.

Table 7 Total variance explained
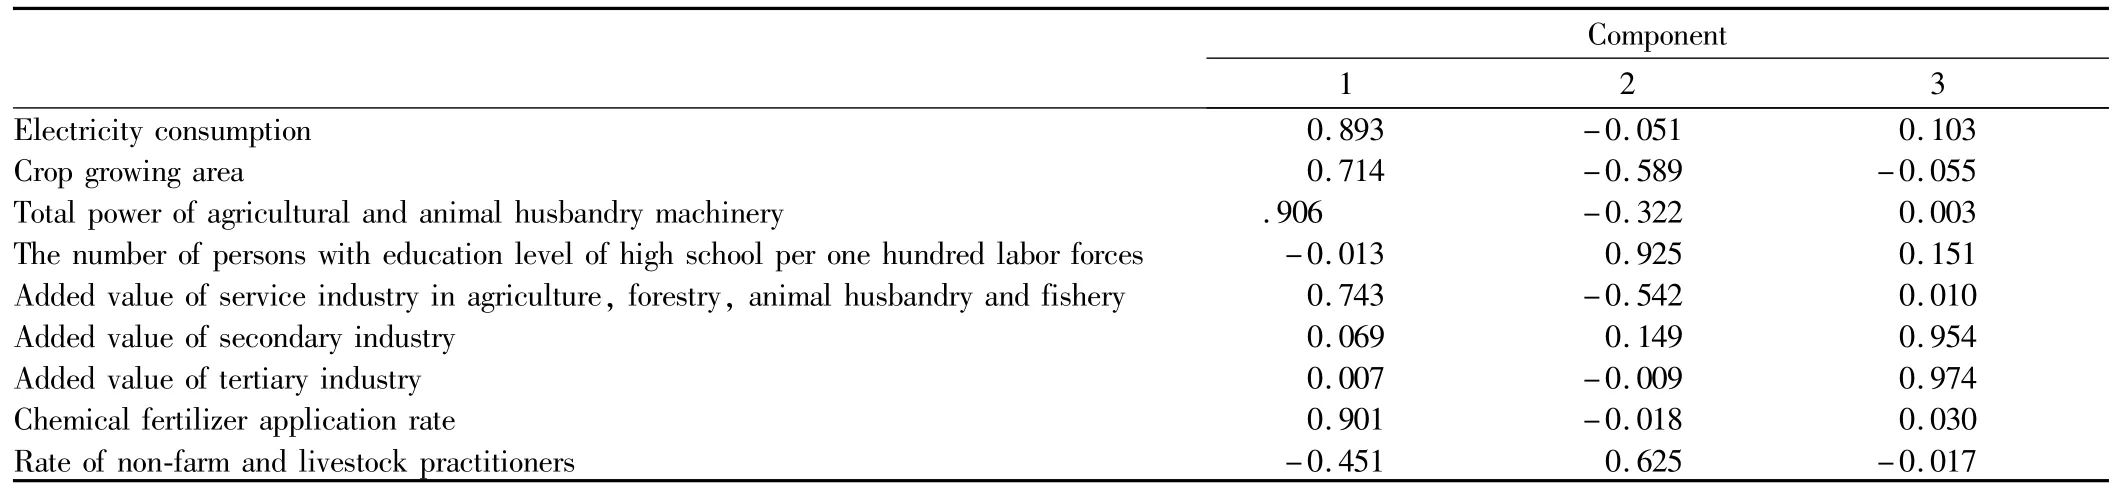
Table 8 Rotated component matrix
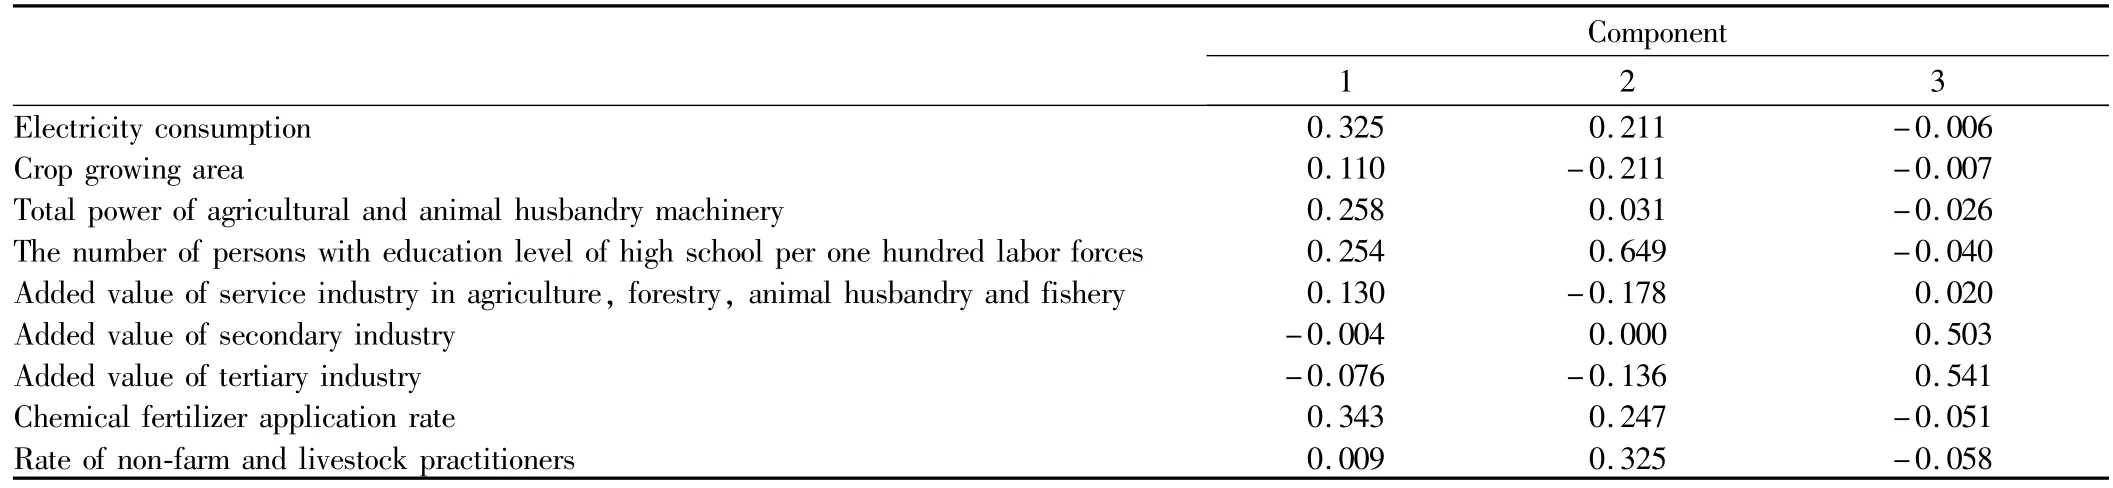
Table 9 Component score coefficient matrix
By the observed common factor values,the factor score coefficient matrix is given.According to the factor score coefficients and the normalized value of the original variables in Table 9,we calculate the factor score of each observed value.
Using the above economic factors and farming and animal husbandry factors obtained from the factor analysis results,we carry out the clustering of 12 leagues and cities in Inner Mongolia,and the cluster analysis results using SPSS are as follows:
The first category:Hohhot,Baotou,Ordos;
The second category:Wuhai,Xilin Gol,Xingan,Ulanqab,Hulunbeier;
The third category:Tongliao,Chifeng,Bayannur;
The fourth category:Alashan.
From the clustering results,the cities of the first category are the three citieswith the highest level of added value of secondary and tertiary industries.
In addition to Erdos,the farmers and herdsmen in Hohhot and Baotou are relatively well educated.In the cities of the second category,the educational level of farmers and herdsmen is considerably lower.In the cities of the third category,the values in the electricity consumption and total power of agricultural and animal husbandry machinery are high.In the cities of the fourth category,the rate of non-farm and livestock practitioners and the educational level are both high.

Fig.3 Tree diagram of the net income of farmers and herdsmen in Inner M ongolia
4 Analysis of the main problems
4.1The per capita net income of farmers and herdsmen has not yet reached the national average,especially lagging behind that of the developed regions The per capita net income of farmers and herdsmen in Inner Mongolia has not yet reached the national standard of per capita net income of farmers.In 1990,the per capita net income of farmers and herdsmen in Inner Mongolia was647 yuan,and the national average was 686 yuan,39 yuan lower than the national average;in 2000,the per capita net income of farmers and herdsmen in Inner Mongolia was2 038 yuan,and the national average was 2 253 yuan,215 yuan lower than the national average;in 2005,the per capita net income of farmers and herdsmen in Inner Mongolia was 2 989 yuan,and the national average was 3 255 yuan,266 yuan lower than the national average;in 2006,the per capita net income of farmers and herdsmen in Inner Mongolia was 3 342 yuan,and the national average was 3 587 yuan,245 yuan lower than the national average;in 2007,the per capita net income of farmers and herdsmen in Inner Mongolia was 3 953 yuan,and the national average was 4 140 yuan,187 yuan lower than the national average;in 2008,the per capita net income of farmers and herdsmen in Inner Mongolia was 4 656 yuan,and the national average was 4 761 yuan,105 yuan lower than the national average;in 2009,the per capita net income of farmers and herdsmen in Inner Mongolia was 4 938 yuan,and the national average was 5 153 yuan,215 yuan lower than the national average;in 2010,the per capita net income of farmers and herdsmen in Inner Mongolia was 5 530 yuan,and the national average was 5 919 yuan,still 389 yuan lower than the national average.
It can be seen that from 1990 to 2005,the gap between the per capita net income of farmers and herdsmen in Inner Mongolia and the national average showed an increasingly widening gap;from 2006 to 2008,the gap between the per capita net income of farmers and herdsmen in Inner Mongolia and the national average was gradually narrowed;from 2009 to 2010,the gap between the per capita net income of farmers and herdsmen in Inner Mongolia and the national average waswidened again.
4.2The sources of income of farmers and herdsmen are relatively simple,and the actual grow th rate of per capita net income is slow In 2009,the wage income accounted for 18.23%of the per capita net income of farmers and herdsmen in Inner Mongolia;the family operating income accounted for 66.38%of the per capita net income of farmers and herdsmen in Inner Mongolia;the transfer and property income accounted for 15.39%of the per capita net income of farmers and herdsmen in Inner Mongolia.In the same period,the wage income accounted for 40%of national per capita net income of farmers and herdsmen;the family operating income accounted for 49.03%of national per capita net income of farmers and herdsmen;the transfer and property income accounted for 10.97%of national per capita net income of farmers and herdsmen.The proportion of family operating income from the primary industry is more than 90%in Inner Mongolia and about78%in the country.We can see that the per capita net income of farmers and herdsmen in Inner Mongolia is mainly from family operating income and especially the farming and animal husbandry income;the proportion of wage income is low,and the source of income is relatively simple.
4.3The sharp increase in the production material prices of farming and animal husbandry makes the production costs climb and restricts the income increase In 2010,the overall level of consumer prices in Inner Mongolia rose by 3.2%(3%of rise in the cities and 3.5 of rise in the rural and pastoral areas).From the prices of production materials,the rise in the prices of production materials for farm and pasture products is the highest,reaching 11.4%.This would increase the cost of farming and animal husbandry production,and decrease the economic benefit.
4.4The natural disasters are serious,affecting the income increase of farmers and herdsmen From late 2010 to early 2011,the snow and drought disasters were serious in Inner Mongolia.Severe snow disaster area was210918 square kilometers,and moderate snow disaster area was 64783 square kilometers;the snow depth was 21-39 cm in most of Hulunbeier,northwestern Xing'an and northwestern Xilin Gol,continuous time of up to 100 days,and 70%of pasture was buried.
Meanwhile,the drought was serious in rural and pastoral areas,and the region's severe drought area reached 280000 square kilometers.Snow and drought disasters will bring some degree of adverse effects on the production of farming and animal husbandry,thereby increasing the difficulty of income increase for farmers and herdsmen.
5 Conclusions and recommendations
5.1Establishing the price protection system for farming and animal husbandry products Farming and animal husbandry is the main source of income for farmers and herdsmen in Inner Mongolia,and the establishment of price protection system will not only help to maintain the stable development of farming and animal husbandry production,but also help to ensure the income and life quality of farmers and herdsmen,and resolve the regional income gap of farmers and herdsmen.
5.2Accelerating the strategic input and improve the investment environment Accelerating the strategic input is to increase the input for long-term development and resource advantages.It is necessary to choose those investment projects that can fundamentally have a sustainable impact on economic development.
5.3Actively improving the urbanization in various leagues and cities Small towns are important for the economic development of rural and pastoral areas.Small towns provide a gathering place for population in rural and pastoral areas and surplus labor,and create more non-farm employment opportunities for the surplus labor in rural and pastoral areas.The development of non-farm and livestock industries in turn further strengthens the urban construction.Therefore,the development of small towns is the need of further development of non-farm industry and small towns can promote the township enterprises to conglomerate to reduce costs and improve efficiency.
5.4Actively promoting the farming and animal husbandry industry structure transformation It is necessary to accelerate the transformation of traditional farming and animal husbandry production techniques,to gradually realize the modernization of agricultural means of production.At the same time,it is necessary to accelerate the region's non-agricultural and non-animal husbandry development,and increase the share of modern agriculture and animal husbandry industry in the overall economic development of farming and animal husbandry,to enhance its economic competitiveness,thus speeding up the transformation of the regional economic structure,and promoting the transformation of overall economic pattern in the rural and pastoral areas.
5.5Strengthening regional economic integration and economic exchanges Good economic ties are the basic conditions for each region to effectively get a variety of production inputs.In the extensive economic exchanges and contacts,the rich resources and labor advantages of all regions can get the financial and technical support of developed areas,so that the potential advantages become a reality,and the industry in the rural and pastoral areas truly becomes the leading force for non-farm and non-animal husbandry development in the rural and pastoral areas.
[1]Michela Addis.New technologies and cultural consumption-edutainment is born.[J].European Journal of Marketing,2006,(39):729-734.
[2]Yuko Aoyama.The role of consumption and globalization in a cultural industry[J].Geoforum,2007,(38):103-113.
[3]ZHANGDF.Study on regional economy development[M].China Light Industry Press.(in Chinese).
[4]FANGCL.Regional development strategy[M].Beijing:Science Press.(in Chinese).
[5]YE YM.On regional development of China[M].Beijing:China Light Industry Press.(in Chinese).
[6]WANG J.Influencing factors of cultural industry's economic contributions in China[J].Statistics and Decision,2008(3):111-114.(in Chinese).
[7]WANG GL.The talent development strategies of poor areas in China[M].China Financial&Economic Publishing House,2004.(in Chinese).
[8]LUOY,CAO LL.The experimental analysis of development trend of concentration and centralization ofmanufacturing of China[J].Economic Research Journal,2005(8):106-127.(in Chinese).
[9]CUIXS,CUIYF.Evaluation on strategic implementation effectiveness of the western development based on the level of industry concentration[J].Inquiry into Economic Issues,2009(11):128-132.(in Chinese).
 Asian Agricultural Research2014年2期
- Asian Agricultural Research的其它文章
- Drought and Waterlogging Characteristics during the Grow th Period of Summer Maize in Luxi Plain Areas
- The Coordinated Development of Sports Industry and Tourism under the Perspective of Soft Power:A Case Study of Henan Province
- Incentives for the Quality and Safety Traceability System of Agricultural Products
- Assessment of Cultivation M ethod for Energy Beet Based on LCA Method
- Model for Predicting Climatic Yield of Sugarcane in Nanning City
- Efficiency Evaluation of Vegetable Specialized Cooperatives Based on Data of Chongqing Municipality