
A step-by-step protocol for formaldehyde-assisted isolation of regulatory elements from Arabidopsis thaliana
2014-11-22 03:37MohammadAminOmidbakhshfardFlaviaVischiWinckSamuelArvidssonDiegoRiaPachandBerndMuellerRoeber
Mohammad Amin Omidbakhshfard,Flavia Vischi Winck,Samuel Arvidsson,Diego M.Riaño-Pachón and Bernd Mueller-Roeber*
1University of Potsdam,Institute of Biochemistry and Biology,Potsdam-Golm 14476,Germany,2Max-Planck Institute of Molecular Plant Physiology,Potsdam-Golm 14476,Germany,3Brazilian Bioethanol Science and Technology Laboratory(CTBE),Brazilian Center of Research in Energy and Materials(CNPEM),Campinas,Brazil.†Current address:Laboratório Nacional de Biociências,Centro Nacional de Pesquisa em Energia e Materiais,Campinas,Brazil.‡Current address:LGC Genomics,Ostendstraße 25,Haus 8,Berlin 12459,Germany.*Correspondence:bmr@uni-potsdam.de
INTRODUCTION
The regulation of gene expression in eukaryotes is a particularly complex process and involves sophisticated control at different levels.It includes the transcriptional activation at promoters by DNA-binding transcription factors(TFs)and accessory proteins,RNA splicing for intron removal and processing of RNA molecules at their 5′-and 3′-ends(capping,polyadenylation),RNA degradation,initiation of translation,and others(Gesteland 2006;Parker 2012;Braunschweig et al.2013).The control of gene expression is central for organ developmental and is also critically important for cellular responses to hormonal or environmental cues.The Arabidopsis thaliana genome encodes approximately 2,000 TFs(Perez-Rodriguez et al.2010),many of which have been characterized functionally over the last two decades,although,however,direct downstream target genes and hence gene regulatory networks(GRNs)are currently unknown for most of them.Chromatin immunoprecipitation(ChIP)allows the isolation of genomic regions using antibodies directed against a DNA-binding protein of interest(e.g.,a TF)and the subsequent analysis of the isolated genomic DNA by genetargeted or genome-wide detection methods like deep sequencing(ChIP-seq),hybridization to nucleic acid microarrays(ChIP-chip),or gene-specific quantitative polymerase chain reaction(ChIP-qPCR).ChIP-based methods have been used to identify or confirm TF target genes or to reveal the complexity of chromatin remodeling during development or stress responses(Kaufmann et al.2009;Wu et al.2012;Cheng et al.2013).
In eukaryotic cells,DNA is organized in the form of chromatin,comprised of nucleosome particles consisting of the core histone octamer around which the DNA is wrapped(~147 bp of DNA per nucleosome;e.g.,Peterson and Laniel 2004;Chodavarapu et al.2010).DNA packed in nucleosomes may not be freely accessible by regulatory DNA-binding proteins such as TFs,and thus the presence of nucleosomes and their distribution(and density)along a given genomic stretch will affect DNA-related processes such as the transcription into RNA.The distribution of nucleosomes along nuclear DNA is dynamic and may be altered by developmental and environmental cues,which trigger the opening or closing of distinct genomic segments,allowing or restricting,respectively,the access by DNA-interacting proteins.Of note,several transcriptional regulatory proteins in for example,yeast(Saccharomyces cerevisiae)and mammalian cells are known to interact with proteins regulating chromatin open state(Cirillo et al.2002;Gaspar-Maia et al.2009).Evidently,studies analyzing the genome-wide dynamics of nucleosome occupancy throughout developmental programs,in individual cells or in response to stress treatments,will greatly support efforts aiming at the detailed understanding of transcriptional control networks in eukaryotic organisms.Recent investigations of global nucleosome positioning have revealed a fairly organized nucleosomal arrangement along genes with the following characteristics:(i)a nucleosome-depleted region(NDR)just upstream of the transcription start site which typically is enriched for TF binding sites;(ii)a relatively regular spacing of nucleosomes along the gene body encompassing the transcribed part of the gene;and(iii)a gradual fading of nucleosome occupancy towards the 3′-end of the gene.In addition,many genes contain a second NDR within their 3′-untranslated region(3′-UTR)(Yuan et al.2005;Lee et al.2007).
Thus,experimental tools for global nucleosome profiling are expected to reveal new insights into gene expression control.A frequently used method is DNase I hypersensitive site(DHS)mapping which identifies open chromatin regions by virtue of their preferred accessibility for nuclease digestion(Cockerill 2000;Follows et al.2006;Shi et al.2009).Recently,DHS mapping has been performed in combination with nextgeneration sequencing allowing the genome-scale identification of open chromatin sites(Wang et al.2012;Zhang et al.2012).Although successfully employed in a number of studies,DHS mapping is technically challenging due to the fact that equal access to different open-state genomic regions by the nuclease(DNase I)cannot be guaranteed.
An alternative to DHS mapping is formaldehyde-assisted isolation of regulatory elements(FAIRE),which does not require enzyme-mediated DNA cleavage simplifying the isolation and analysis of open chromatin regions.In FAIRE,histones are cross-linked to DNA by formaldehyde treatment,followed by shearing chromatin by sonication.Subsequently,a phenol/chloroform/isoamyl alcohol(PCI)extraction is performed,separating protein-free genomic DNA fragments into the aqueous phase and histone-DNA complexes to the interphase.DNA extracted into the aqueous phase can be analyzed by,for example,next-generation sequencing(FAIRE-seq)to reveal open chromatin sites at genome scale,or by genomic site-specific quantitative PCR if only a small number of loci is to be analyzed(FAIRE-qPCR).FAIRE has recently been used in a range of eukaryotic organisms(Giresi et al.2007;Louwers et al.2009;Gaulton et al.2010;Ponts et al.2010;Song et al.2011)and an appreciable overlap in the open chromatin sites identified in FAIRE and DHS mapping experiments was reported although each individual dataset also included specific open chromatin regions(Song et al.2011;Simon et al.2012).To our knowledge,FAIRE has so far not been used for genome-wide analyses in higher plants;only one report has been published to uncover NDRs specific for the high expression of the booster 1(b1)locus in maize(Zea mays)(Louwers et al.2009).However,the fact that no detailed protocol for FAIRE studies in plants is available may explain why plant scientists have not yet used this technique frequently,in contrast to animal and yeast researchers.
Formaldehyde-assisted isolation of regulatory elements has several advantages over other methods like ChIP or DHS mapping.First,in contrast to ChIP,it does not require antibodies directed against DNA-binding proteins;this may be particularly relevant for studies on plants,as suitable antibodies are often not commercially available.In ChIP,genomic fragments are enriched by immunoprecipitation using antibodies directed against defined chromatin-binding proteins(e.g.,transcription factors or histones),and the enriched fragments are then identified by ChIP-seq or the enrichment of individual genomic fragments over the remaining genome is determined by ChIP-qPCR.In contrast to this,FAIRE provides a non-biased insight into NDRs at a global scale.Thus,FAIRE allows a genome-wide identification of NDRs after,for example,a given treatment even if the chromatin-binding proteins triggering NDR formation are unknown.Second,in contrast to DHS mapping,FAIRE does not require a nuclease for DNA cleavage.This minimizes potential bias as different open regions of the formaldehyde-cross-linked chromatin may be differentially accessible to the nuclease.Third,in particular,FAIRE-seq experiments can be carried out without control treatments as NDRs in the FAIRE samples are identified by mapping sequence reads to the sequenced reference genome which allows the identification of enriched versus non-enriched genomic regions;however,the real power of FAIRE-seq is realized when control experiments are available.Furthermore,if only a small number of genomic locations are analyzed,such as in FAIRE-qPCR studies,control samples(e.g.,from untreated tissues)have to be included and processed in parallel.
As FAIRE is now widely accepted and used in human research,we recently employed FAIRE-seq to identify regulatory elements in Arabidopsis;more specifically,we used FAIRE to discover regulatory genome regions involved in the response to a cellular increase in hydrogen peroxide levels in Arabidopsis seedlings(Omidbakhshfard MA et al.unpubl.data,2013;next-generation sequence data are available from the European Bioinformatics Institute(EBI)Sequence Read Archive,accession no.ERP002464).In addition,we used FAIRE-seq for the genome-wide identification of regulatory elements and the reconstruction of gene regulatory networks in the green alga Chlamydomonas reinhardtii subjected to carbon deprivation(Winck et al.2013).Both experiments and the one by Louwers et al.(2009)on maize highlight the usefulness of the FAIRE method also for research on photosynthetic organisms.
Here,we present a step-by-step FAIRE protocol for studies in A.thaliana established on the basis of the original FAIRE method described for human and yeast cells(Nagy et al.2003;Giresi et al.2007),but modified to include plant-specific adjustments.Importantly,both the waxy cuticle covering the leaf surface and the presence of spongy mesophyll cells with air spaces in between make plant tissues relatively resistant to formaldehyde penetration(compared to animal and yeast cells),requiring longer exposure times and generally harsher conditions such as vacuum infiltration for proper fixation.Furthermore,as plant cells contain a rigid cell wall and often large vacuoles(e.g.,in leaves),the number of nuclei per gram of tissue is generally lower than in human and yeast cells;thus,a larger amount of tissue is normally required for nuclei isolation and the extraction of sufficient amounts of chromatin of high quality(Haring et al.2007).Therefore,chromatin crosslinking and isolation in plants require more experimental steps than experiments with human and yeast cells.The FAIRE protocol provided here for work with plants is straightforward and can be established in every standard molecular biology laboratory where most of the equipment needed to perform FAIRE is available.
RESULTS
A FAIRE protocol for Arabidopsis
The flowchart of the FAIRE method,which typically includes the following major steps(i–v),is given in Figure 1.A detailed step-by-step protocol(steps 1–41)is given in the Materials and Methods section.
i.First,samples are treated with formaldehyde to cross-link DNA and proteins.We used 1%formaldehyde for fixation,a concentration commonly employed in FAIRE and ChIP studies.In general,cross-linking occurs more efficiently between histones and DNA than between transcription factors and DNA,for two reasons.First,cross-linking requires the direct interaction between DNA and protein which occurs 10–15 times between histone proteins(Luger et al.1997)and DNA strands(as the DNA strand two times surrounds the histone proteins)whereas a typical regulatory protein like a TF interacts with DNA only via a small number of bases(5–15 bp)which potentially allows for one or two direct interactions(Bulyk 2004;Wittkopp 2010).Second,histones have a high percentage of basic amino acids which favors cross-linking to DNA.Although regulatory proteins also often contain stretches of basic amino acids,their overall percentage is lower than in histones(Solomon and Varshavsky 1985).These differences allow for generally shorter fixation times in FAIRE compared to ChIP experiments.
ii.The second major step in FAIRE is chromatin isolation which in contrast to ChIP does not require the use of antibodies.To find optimal conditions for our FAIRE setup,we initially tested different protocols published for ChIP experiments in plants of which the procedures of Saleh et al.(2008)and Bowler et al.(2004)gave the most reproducible results,although the Bowler protocol performed better in our hands and was therefore chosen and slightly modified for chromatin isolation in the FAIRE method presented here.Note that prior to the extraction of chromatin,nuclei are isolated(enriched)from both samples(FAIRE and UN-FAIRE;steps 9–20).
iii.In this step,chromatin is sheared to DNA fragments of 0.2–0.8 kb length(note,that fragment length determines the resolution of the FAIRE peaks);the exact experimental conditions need to be optimized for each experiment and tissue(Figure 2).Checking fragment sizes can be done by analyzing aliquots of the unsheared(from step 20)and sheared chromatin samples(from step 22)on standard 1%agarose gels after de-cross-linking and PCI extraction,both of which are needed to free DNA from bound proteins.Figure 3 shows DNA samples before and after de-crosslinking and PCI extraction,before and after sonication.
iv.In this step,which distinguishes FAIRE from ChIP,the sheared chromatin is directly subjected to PCI extraction to separate NDRs(i.e.the open chromatin regions partitioning into the aqueous phase)from chromatin containing bound nucleosomes(which will accumulate in the interphase).In the UN-FAIRE control sample,all DNA regions will be extracted into the aqueous phase.
v.In this step,FAIRE and control samples are compared to identify FAIRE peaks(NDRs)containing potential regulatory elements.
To establish FAIRE for A.thaliana,we used approximately 2 g(fresh weight)of 2 week old seedlings(Col-0 accession).The seedlings were fixed using 1%formaldehyde(FAIRE sample);formaldehyde fixation was omitted from control seedlings(UN-FAIRE sample).The core FAIRE protocol(from step 9 onwards)was applied to both samples.After chromatin extraction and DNA shearing(Figure 3),PCI extraction was performed to isolate DNA fragments,which in the case of the FAIRE sample only contains the open chromatin parts(NDRs),while in the control(i.e.,UN-FAIRE)sample,all genomic fragments are collected regardless of their location in open or closed chromatin(Figure 4).

Figure 2.Optimization of the sonication protocol for formaldehyde-assisted isolation of regulatory elementsDNA was size-fractionated on a 1%agarose gel.Lanes 1–6 show DNA from non-cross-linked samples after 0,3,6,10,15,and 20 sonication cycles,respectively.Lanes 7–11 show DNA of samples treated with formaldehyde for 8 min and sheared by 0,6,10,15,or 20 sonication cycles,respectively.Each cycle took 15 s,and power was set to 70%,setting 7(×10);the break time between cycles was 100 s on ice.Ten or more sonication cycles produced DNA fragments of suitable sizes from 0.2 to 0.8 kb.In the non-cross-linked sample in the absence of shearing(lane 1),high-molecular-weight genomic DNA is visible(white arrow).Typically,partial fragmentation of genomic DNA is also observed without sonication due to shear forces acting on the DNA during extraction and pipetting(visible above the 0.8 kb marker line).M,molecular size marker.

Figure 3.Analysis of genomic DNA before and after sonication(A)Non-cross-linked and(B)cross-linked chromatin before and after sonication was separated by 1%agarose gel electrophoresis.As phenol/chloroform/isoamyl alcohol(PCI)extraction was not applied to samples shown in(A)and(B),highmolecular-weight DNA–protein complexes remain in the loading wells.Fragments of 0.2–0.8 kb length accumulate after sonication.(C)Cross-linked and non-cross-linked DNA samples after sonication and phenol/chloroform/isoamyl alcohol extraction(which removes high-molecular-weight DNA–protein complexes).Representative results from three different biological replicates are shown.
Identification of FAIRE peaks
To test whether the FAIRE experiment properly worked in our hands and to check whether we can identify NDRs,we tested our samples by qPCR.To this end,we selected four housekeeping genes mostly based on the research of Czechowski et al.(2005).Due to their constitutive nature of expression,we expected them to have open chromatin parts(with potential regulatory elements)in the genomic regions just upstream of their transcription start sites(TSSs)(Myers et al.2001;Nagy et al.2003).qPCR primers covering short,overlapping 60–150 bp segments spanning approximately 1.5 kb promoters,5′-UTRs,exons,and introns were designed and tested for specificity using the QuantPrime web-based tool(Arvidsson et al.2008)with a customized FAIRE wholegenome reference.The sequences of the qPCR primers for the selected genes are listed in Table S1.As can be seen in Figure 5,open chromatin at approximately 200–300 bp upstream of TSSs was significantly enriched compared to the other gene regions tested.We repeated this experiment with six different biological replicates and additionally included plants of different developmental stages;in all cases,NDRs(i.e.FAIRE peaks)were found to be significantly enriched just upstream of the TSSs.We also subjected FAIRE DNA from 2 week old Arabidopsis seedlings to next-generation sequencing(Illumina HiSeq2000,50 bp,paired-end;LGC Genomics,Berlin,Germany)and observed FAIRE peaks for the same set of housekeeping genes(Figure 6;the full dataset is available at the EBI Sequence Read Archive under accession no.ERP002464).Prominent FAIRE peaks were also observed for thousands of other regions across all five chromosomes(D.Urbina-Gómez et al.unpubl.data,2013);an example is shown in Figure 7.

Figure 4.Schematic presentation of the formaldehyde-assisted isolation of regulatory element(FAIRE)methodPlant tissue is treated with formaldehyde to cross-link histone proteins(in nucleosomes)to DNA(FAIRE sample;cross-linked nucleosomes shown in dark blue).Depending on experimental needs,either whole seedlings or individual organs can be subjected to protein–DNA cross-linking.Nucleosome-depleted regions(NDRs),shown in green,contain regulatory elements to which transcription factors may bind.As described in the main text,regulatory proteins have a lower propensity for cross-linking to DNA.For control experiments,formaldehyde-mediated cross-linking is omitted(UN-FAIRE;non-cross-linked nucleosomes shown in light blue).Chromatin is subjected to phenol/chloroform/isoamyl alcohol(PCI)extraction and after centrifugation(cf.)NDRs(FAIRE sample)or whole genomic DNA(UN-FAIRE sample)are recovered from the upper,aqueous phase,and subjected to further analysis(by quantitative polymerase chain reaction(qPCR),hybridization to microarrays or deep sequencing).Nucleosomes with bound genomic DNA(FAIRE)or without genomic DNA(UN-FAIRE)fractionate into the interphase.The panel at the bottom of the figure shows a schematic presentation of a FAIRE-seq profile and how it aligns with NDRs(green)and nucleosomal DNA(black)of the genomic DNA from which the FAIRE pattern was retrieved.
DISCUSSION
The FAIRE protocol is simple and easy to establish in any standard molecular biology laboratory.As FAIRE does not require antibodies for chromatin precipitation or the inclusion of nucleases for DNA fragmentation,it is less difficult to establish than ChIP and DHS mapping.Considering that FAIRE allows the isolation of NDRs at genome-wide scale,it has the great potential to speed up the unbiased discovery of regulatory regions across genomes,even if regulatory proteins binding to them are not known yet.Open chromatin sites can be identified or validated using one of the three following methods:
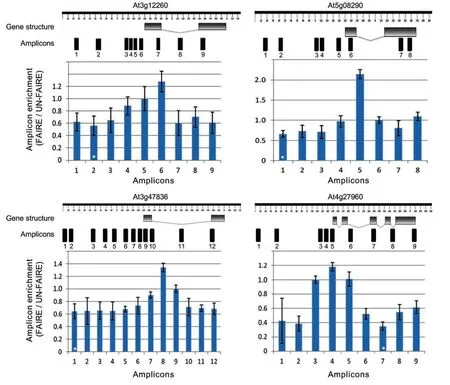
Figure 5.Formaldehyde-assisted isolation of regulatory element(FAIRE)quantitative polymerase chain reaction(qPCR)analysisFour housekeeping genes were selected mostly based on Czechowski et al.(2005).qPCR primer pairs were designed to cover~1.5 kb upstream sequence,5′-untranslated regions,exons,and introns of each gene(gene structures were drawn using the FancyGENE tool;http://bio.ieo.eu/fancygene/;Rambaldi and Ciccarelli 2009).qPCR was performed on sheared chromatin after phenol/chloroform/isoamyl alcohol extraction for both,FAIRE and UN-FAIRE(i.e.control)samples.Amplicon enrichment is calculated from the amplification signal obtained for the FAIRE signal relative to the enrichment obtained for the UN-FAIRE sample.Data were normalized to the enrichment observed for the genomic regions highlighted by a white star(*),which shows the minimum ratio between FAIRE and UN-FAIRE samples.[Correction added on 28 March 2014,after first online publication:“Black star” has been changed to “white star” in the figure caption of Figure 5.]
1.FAIRE-qPCR:This method can be used when only a small number of genes or a small genomic segment are to be tested.Note,that primers for qPCR analysis should be designed such that they cover major(if not all)parts of the selected DNA region.Amplicons should not be longer than 200 bp(ideally,60–150 bp)to allow amplification of enriched regions around FAIRE peaks from sheared DNA fragments(0.2–0.8 kb)with standard real-time PCR protocols.Primer design for qPCR experiments on genomic DNA fragments is critical and requires particular attention.Aspects to be considered include:location of the primers in the genomic region to be analyzed;selection of appropriate genomic reference regions;and methods for the quantification of the PCR amplification results(for detailed discussions see Giresi and Lieb 2009;Gaulton et al.2010;Simon et al.2012).In general,qPCR reactions are performed like standard quantitative reverse transcription polymerase chain reactions “qRT-PCRs”.We typically run them in 5 μL final volume which includes 0.5 μL of sheared DNA(50–100 ng/μL),2 μL of primer mix(200 nM of each gene-specific primer)and 2.5 μL SYBR Green PCR Master Mix(Applied Biosystems,Foster City,CA,USA;containing SYBR Green I dye,DNA polymerase and deoxyribonucleotide triphosphates).To increase accuracy,we mix the components using a pipetting robot(Evolution P3 precision pipetting system;Perkin Elmer,Rodgau,Germany).However,larger reaction volumes can be employed as well,obviating access to a robot.To increase the accuracy and the robustness of the FAIRE-qPCR results,it is recommended to perform at least three technical replicates;biological replicates will also increase experiment accuracy.For the quantification of the relative enrichment of each PCR amplicon we use the comparative Ctmethod(Schmittgen and Livak 2008).In this approach,the amplification ratio for each amplicon is calculated from the signal obtained for the FAIRE sample and the signal obtained from chromatin not cross-linked with formaldehyde(the UN-FAIRE sample).The ratios obtained for the different amplicons are then normalized against the amplicon that shows the lowest ratio in the experiment.Typically,this is expected to be the ratio obtained for the reference genomic segments which are regions flanking a FAIRE peak(as those are nucleosome-rich regions).The two steps of normalization and enrichment measurement of different regions(for further discussion see Giresi and Lieb 2009)are expressed by the following mathematical terms: ΔCt=Ct(FAIRE)-Ct(reference)and 2(-ΔΔCt)(where ΔΔCt=Ct(FAIRE)-Ct(UN-FAIRE)),respectively.Note that qPCR can also be used to validate FAIRE peaks previously identified by DNA microarray analysis or deep sequencing(see below).

Figure 6.Formaldehyde-assisted isolation of regulatory element next-generation sequencing(FAIRE-seq)patterns across housekeeping genesFAIRE-seq patterns of the four housekeeping genes for which FAIRE-qPCR results are shown in Figure 5.High numbers of sequence reads(y-axis)of each gene are observed right upstream of transcription start sites.Other FAIRE peaks,including those downstream of the gene’s transcribed regions,may also contain potential regulatory elements.The location of the 5′-upstream region(5′up)of each gene is shown;alternative splice variants are indicated(blue bar representations;introns shown as thin lines).Graphs were drawn using the IGV program(Robinson et al.2011).

Figure 7.Formaldehyde-assisted isolation of regulatory element next-generation sequencing(FAIRE-seq)pattern at a genomic region of chromosome IV(A)Schematic view of chromatin showing nucleosome-depleted regions(NDRs)to which regulatory proteins,such as transcription factors,bind.(B)FAIRE-seq result shown for gene loci At4g06500 to At4g06509(indicated by blue bars below the FAIRE profile)of chromosome IV.Strong FAIRE peaks,which correspond to NDRs,are highlighted.Data were obtained for 2 week old Arabidopsis seedlings treated for 3 h with 3-amino-1,2,4-triazol(3-AT).The graph was drawn using the IGV program(Robinson et al.2011).
2.Tiling arrays(FAIRE-ChIP):Hybridization of isolated chromatin to tiling arrays can be used to identify FAIRE peaks genome wide(Giresi et al.2007;Gaulton et al.2010).In this case,FAIRE and control(UN-FAIRE)samples are typically labeled with different fluorescent dyes and both samples are hybridized onto a DNA microarray.Relative color intensities indicate genomic regions enriched in the FAIRE sample compared to control.
3.FAIRE-seq:This method allows the unbiased genomewide identification of FAIRE peaks(Gaulton et al.2010;Song et al.2011).After running sheared DNA on a 1%agarose gel,0.2–0.8 kb long fragments are purified and used for library construction followed by deep sequencing.For data analysis,cleaned short reads are mapped to the genome of interest,using,for example,Bowtie(Langmead et al.2009)or BWA(Li and Durbin 2009).Regions where reads are piling up are identified using standard software employed for the analyses of ChIP-seq data,such as MACS,CSAR,and MOSAiCS(Zhang et al.2008;Kuan et al.2011;Muino et al.2011).NDRs can be visualized using different genome browsers(e.g.,IGV;Robinson et al.2011).Finally,putative functions can be assigned to peaks by,for example,transferring functional information from their closest genes,and statistics(e.g.,distance to TSSs)can be easily computed.The combined use of these computational methods for the analysis of FAIRE-seq data will provide insight into hundreds of potential new regulatory regions along the plant genome and will lead to ample new working hypotheses that can be tested experimentally.However,as seamlessly linking the various bioinformatics tools may be tedious for the untrained wet-laboratory researcher,we have recently established a computational analysis pipeline for FAIRE-seq data(D.Urbina-Gómez et al.unpubl.data,2013).We expect that employing the FAIRE protocol provided here in combination with the new analysis setup will greatly support FAIRE-seq studies in plants in the future.
Formaldehyde-assisted isolation of regulatory element has already been employed very successfully in a number of animal and yeast studies.Potential applications of FAIRE in plant research include:(i)the identification of gene-proximal anddistal regulatory regions that are under developmental or stress-dependent control;(ii)the identification of target promoters of TFs by comparing global FAIRE patterns of wild-type and mutant plants(lacking a TF of interest);(iii)the identification of genomic elements controlled by upstream signaling cascades by comparing FAIRE patterns of wild-type plants with those of signaling mutants;(iv)the identification of natural variation of genomic regulatory regions across different accessions or ecotypes;and(v)as only minor modifications of the FAIRE protocol presented here will be needed to adapt it to other plants,the global inventory of regulatory regions across species will be facilitated.We hope that by presenting a FAIRE protocol for Arabidopsis,FAIRE studies will also catch up in the plant field soon.
MATERIALS AND METHODS
Plants
Arabidopsis thaliana(L.)Heynh.(Col-0)seeds were obtained from the A.thaliana Resource Centre for Genomics(INRA,France;http://dbsgap.versailles.inra.fr/publiclines/)and plants were cultured as reported(Omidbakhshfard et al.2012).In brief,seeds were surface-sterilized using sodium hypochlorite solution(50%),sown on agar medium plates(1×Murashige-Skoog(MS),1%sucrose,pH 5.8),and plates were stored for 2 d under vernalization condition and then transferred to long-day growth condition(16 h light,22 °C and 8 h dark,18 °C).After 2 weeks,seedlings were transferred to liquid MS medium(1%sucrose)and kept overnight under the same environmental condition,and then treated for 3 h with 3-amino-1,2,4-triazol(3-AT)to block catalase activity.Seedlings were fixed with formaldehyde and processed further as explained in the protocol.
Reagents
The following reagents and consumables were used to set up the FAIRE protocol for A.thaliana:1.5 and 2 mL safe-lock tubes(Eppendorf tubes);β-ME(β-mercaptoethanol;cat.no.63690,Fluka,Buchs,Switzerland);double-distilled autoclaved water(cold and room temperature(RT));ethylenediaminetetraacetic acid(EDTA;1 M,adjusted to pH 8.0 with NaOH),autoclaved,kept at RT(cat.no.8040.2;Roth,Karlsruhe,Germany);ethanol(cat.no.5054.2;Roth,Karlsruhe,Germany);Falcon tubes(15 and 50mL);formaldehyde(cat.no.F8775;Sigma-Aldrich,St Louis,MO,USA);GelRed(Biotrend Chemikalien,Cologne,Germany);glycine(2.5M stock solution,cat.no.3908.2;Roth,Karlsruhe,Germany);glycogen(cat.no.10901393001;Roche Applied Science,Indianapolis,IN,USA);HyperLadder 1 kb(cat.no.BIO-33053;Bioline,Luckenwalde,Germany);liquid nitrogen;MgCl2(cat.no.172571;Merck,Darmstadt,Germany);Miracloth or nylon mesh(50–75μm);NaCl(5 M stock solution,cat.no.9265.1;Roth);PCI,25:24:1(cat.no.A 156.3;Roth);phenylmethylsulfonyl fluoride(PMSF,cat no.6367.2;Roth);Complete Protease Inhibitor Tablets(cat.no.05892791001;Roche,Applied Science,Indianapolis,IN,USA);Proteinase K (cat.no.0311588700;Roche);RNase A(DNase-free,cat.no.A3832;Applichem,Darmstadt,Germany);sodium dodecylsulfate(SDS,cat.no.4360.1;Roth);sucrose(cat.no.4621.1;Roth);SYBR Green PCR Master Mix(cat.no.4309155;Applied Biosystems,Foster City,California,USA);TE buffer(10 mM Tris-HCl,1 mM EDTA,pH 8.0);Tris-HCl(1 M,adjusted to pH 8.0 with HCl)(cat.no.T5941;Sigma,St.Louis,MO,USA);Triton X-100(cat.no.39795.01;Serva,Heidelberg,Germany).[Correction added on 28 March 2014,after first online publication:“10M/L” and“1 M/L”have both been amended to “10mM” and “1 mM”respectively.]
Solutions
All solutions should be prepared freshly and kept on ice or in a fridge until use(unless stated otherwise).
Buffer 1(crosslinking buffer)for 100 mL:400 mM sucrose(20 mL of 2 M stock),10 mM Tris-HCl,pH 8.0(1 mL of 1 M stock),5 mM b-ME(35 μL of 14.3 M stock),0.1 mM PMSF(50 μL of 0.2 M stock).Add 1 tablet of Complete Protease Inhibitor Cocktail to 50 mL Buffer 1 immediately before use.
Buffer 2 for 10 mL:250 m M sucrose(1.25 mL of 2 M stock),10 mM Tris-HCl,pH 8.0(100 μL of 1 M stock),10 mM MgCl2(100 μL of 1 M stock),1%Triton X-100(0.5 mL of 20%stock),5 mM b-ME(3.5 μL of 14.3 M stock),0.1 mM PMSF(5 μL of 0.2 M stock).Immediately before use dissolve half a Complete Protease Inhibitor Tablet in Buffer 2.
Buffer 3 for 10 mL:1.7 M Sucrose(8.2 mL of 2 M stock),10 mM Tris-HCl,pH 8.0(100 μL of 1 M stock),0.15%Triton X-100(75 μL of 20%stock),2 mM MgCl2(20 μL of 1 M stock),5 mM b-ME(3.5 μL of 14.3 M stock),0.1 mM PMSF(5 μL of 0.2 M stock).Immediately before use dissolve half a Complete Protease Inhibitor Tablet in Buffer 3.
Nuclei Lysis Buffer(NLB)for 5 mL:50 mM Tris-HCl,pH 8.0(0.25 mL of 1 M),10 mM EDTA(24 μL of 0.5 M),1%SDS(0.25 mL of 20%),0.1 mM PMSF(5 μL of 0.2 M stock).Immediately before use dissolve one fourth of a Complete Protease Inhibitor Tablet in NLB.TE buffer for 10 mL:10 mM Tris-HCl,pH 8.0(100 μL of 1 M stock),1 mM EDTA(10 μL of 1 M stock).TE buffer can be kept at RT.
Step-by-step protocol for NDR isolation by FAIRE
Sampling of plant material
1.Sow Arabidopsis seeds on soil or on semi-solid MS plates.
2.Harvest 1–2 g fresh tissue of preferably 2–3 week old seedlings and transfer to a 50 mL Falcon tube.To minimize environmental impact on the FAIRE patterns,sampling should be done as quickly as possible.Generally,all types of tissues suitable for ChIP studies can also be used for FAIRE experiments.However,younger tissues tend to have less lignin and woody structures than older ones which facilitates formaldehyde penetration,cross-linking,and chromatin isolation.
3.Wash seedlings three times with RT,double-distilled autoclaved water and every time gently invert the tube two to four times and discard the water.This step is necessary to clean tissues and make them wet and ready for formaldehyde penetration.In case a treatment was applied to the plants(e.g.,hormone or stress treatment),a fraction of the seedlings can be harvested for RNA extraction and gene expression analysis using microarrays,by RNA-seq,or by qRT-PCR.By checking transcript levels,potential regulatory elements identified through FAIRE may be linked to differentially expressed genes.
Formaldehyde cross-linking(fixation)
4.Thoroughly remove the water and fix tissues in 40 mL of RT cross-linking buffer(Buffer 1)supplemented with 1%formaldehyde(1,010 μL of 37%stock);vacuum-infiltrate for 8–10 min.After 5 min of vacuum infiltration,stop vacuum pump and shake Falcons to remove air bubbles.Note,that fixation time is dependent on the tissue and age of the samples,but often the fixation time for FAIRE experiments is shorter than for ChIP experiments on similar samples.Make sure that seedlings or tissues are kept in fixation solution while the vacuum pump is working;it may be necessary to softly push back the tissue into the buffer;this can be done with the help of a blue pipette tip or a little sponge.
5.Stop the cross-linking process by adding glycine to a final concentration of 0.125 M(2 mL of 2.5 M glycine in 40 mL of Buffer 1)and applying vacuum for 5 min to allow the glycine to penetrate the tissue.At this stage,leaves of seedlings should turn translucent and develop a slightly darker green appearance(due to penetration of liquid into the tissue).
6.Discard Buffer 1 from the Falcon tube.
7.Quickly rinse seedlings twice with cold double-distilled,autoclaved water(to clean the tissue from formaldehyde and glycine).
8.Remove the water and quickly dry tissues between paper towels before transferring them to a new Falcon tube.Cross-linked samples can either be snap-frozen in liquid nitrogen and stored at–80°C until use,or be directly processed for chromatin isolation.For the preparation of control(i.e.,non-cross-linked)samples(“UN-FAIRE”),seedlings are processed in the same way with the exception that formaldehyde and glycine are omitted from Buffer 1.Isolation and sonication of chromatin
9.Grind tissues to a fine powder using a pre-cooled mortar and pestle.This step is very important for efficient chromatin isolation.Grinding samples for 10–15 min(without thawing)should produce a fine powder suitable for chromatin isolation.
10.Resuspend the powder in 30 mL Buffer 1(4°C)in a new 50 mL Falcon tube.Incubate for 10–15 min on ice to obtain a completely homogenized suspension(if needed,gently shake the Falcon tube).
11.Filter the homogenized suspension through four layers of Miracloth or nylon mesh(50–75 μm)into a new pre-cooled 50 mL Falcon tube kept on ice.
12.Centrifuge for 20 min at 2,880 g and 4°C.A white pellet(with a green layer)should form at the bottom of the Falcon tube.
13.Carefully remove the supernatant and resuspend the pellet in 1 mL of Buffer 2.
14.Transfer the suspension to a 1.5 mL Eppendorf tube.
15.Centrifuge at 12,000 g for 10 min at 4°C.
16.Repeat steps 13–15 for two more times to wash the pellet.The green overlay should disappear(or diminish)after three times of washing.
17.Discard the supernatant and resuspend pellet in 300 μL of ice-cold Buffer 3.
18.Overlay the resuspended pellet onto 300 μL of ice-cold Buffer 3 in a fresh pre-cooled 1.5 mL Eppendorf tube.
19.Spin at 16,000 g for 70 min at 4°C.
20.Carefully discard the supernatant and resuspend the chromatin pellet in 300 μL of ice-cold nuclei lysis buffer(NLB)by vortexing or pipetting up and down on ice.Keep an aliquot(5–10 μL)of the suspension to check for sonication efficiency by gel electrophoresis(see step 22).This will represent unsheared chromatin.
21.Once resuspended,sonicate the chromatin for 10 cycles on ice,using a Bandelin SONOPULS HD 2070 sonicator(Bandeling Electronic,Berlin,Germany)(each cycle 15 s,on 70%power,setting 7(×10),with 100 s breaks between cycles,on ice),to shear DNA to fragments of approximately 0.2–0.8 kb length.Sonication conditions may vary depending on the equipment used;therefore,test experiments should be run to determine instrumental settings and treatment times appropriate for the generation of DNA fragments of 0.2–0.8 kb length.During sonication,the temperature of the chromatin suspension should not rise and the formation of foam and bubbles should be prevented.The sonicated chromatin can be stored at-80°C until use or directly processed further in the next experimental steps.
22.Spin the sonicated chromatin suspension for 10 min at 4°C(16,000 g)to pellet debris.Transfer the supernatant to a new tube and store at-20°C for later use or directly proceed for the isolation of nucleosome-depleted regions using PCI extraction(step 23 and following).Use an aliquot(5–10 μL)from this step(sheared chromatin)and step 20(unsheared chromatin)to check sonication efficiency.To this end,both samples are de-cross-linked by overnight incubation at 65°C and a 1–2 h treatment with 1 μL Proteinase K at 37 °C.Check decross-linked DNA by electrophoresis on a standard 1%agarose gel.Although samples can also be checked without de-crosslinking,the separation of the DNA fragments will work better upon removal of the bound histones prior to electrophoresis.Note,that in some studies only a limited amount of tissue is available for FAIRE analysis.In such cases,a third or half(i.e.,100–150 μL)of the secured supernatant may be retained and subjected to de-cross-linking.To this end,incubate at 65°C overnight,add 10 μL Proteinase K and incubate for another 2 h at 37°C.The de-cross-linked DNA is then subjected to PCI extraction(essentially as described in step 23 and following)and may serve as an internal control for the identification of enriched genomic regions(NDRs)in the non-de-cross-linked fraction of the same sample.
Isolation of NDRs
23.Add an equal volume of PCI to the sample(300 μL).
24.Vortex for 2 min,to establish a milky suspension.
25.Spin at 12,000 g for 10 min at RT.Three different layers should be visible;the upper aqueous phase contains the NDRs,the milky inter-phase contains proteins and cross-linked genomic DNA(nucleosome-rich regions),and the lower yellowish phase is the organic phase.This step should be repeated if three layers are not well separated.
26.Transfer the upper,aqueous phase to a new Eppendorf tube.
27.Repeat steps 23–26 two more times to gain highly pure DNA.
28.Add 0.1 volume of 3 M sodium acetate(to a final concentration of 0.3 M).
29.Add 2.5 volume of absolute pure ethanol and mix well.To increase yield of DNA,1 μL glycogen suspension may be added.
30.Keep the solution at-20 °C overnight or at-80 °C for 1 h.
31.Spin at 16,000 g(maximum speed)for 45 min at 4°C.
32.Discard the supernatant.
33.Wash the pellet with 1 mL of 70%ethanol(RT).
34.Spin at 11,000 g for 5–10 min at RT.
35.Discard the supernatant.
36.Repeat steps 33–35 for two more times to increase the purity of the DNA pellet.
37.Dry DNA pellet at RT(or at 56°C for 5–10 min).
38.Dissolve DNA pellet in TE buffer(pH 8.0)or DNase-free water.
39.Check DNA concentration using a Nanodrop ND 2000(PEQLAB Biotechnologie,Erlangen,Germany).
40.Check fragment sizes by electrophoresis on a standard 1%agarose gel(fragment lengths should range from 0.2–0.8 kb,with a peak concentration at~0.5 kb).
41.The isolated DNA can be used directly for the identification of nucleosome-depleted regions by qPCR(for a small number of loci),or by microarray hybridization or nextgeneration sequencing(for genome-wide assessment),as explained in the Discussion section.
ACKNOWLEDGEMENTS
We thank David Alejandro Urbina Gomez from the Universidad de los Andes,Bogotá,Colombia,for supporting us during the analysis of the FAIRE-seq data.
Arvidsson S,Kwasniewski M,Riano-Pachon DM,Mueller-Roeber B(2008)QuantPrime—A flexible tool for reliable high-throughput primer design for quantitative PCR.BMC Bioinformatics 9:465
Bowler C,Benvenuto G,Laflamme P,Molino D,Probst AV,Tariq M,Paszkowski J(2004)Chromatin techniques for plant cells.Plant J 39:776–789
Braunschweig U,Gueroussov S,Plocik AM,Graveley BR,Blencowe BJ(2013)Dynamic integration of splicing within gene regulatory pathways.Cell 152:1252–1269
Bulyk ML(2004)Integrative functional genomics.Genome Biol 5:331
Cheng MC,Liao PM,Kuo WW,Lin TP(2013)The Arabidopsis ETHYLENE RESPONSE FACTOR1 regulates abiotic stress-responsive gene expression by binding to different cis-acting alements in response to different stress signals.Plant Physiol 162:1566–1582
Chodavarapu RK,Feng SH,Bernatavichute YV,Chen PY,Stroud H,Yu YC,Hetzel JA,Kuo F,Kim J,Cokus SJ,Casero D,Bernal M,Huijser P,Clark AT,Kramer U,Merchant SS,Zhang XY,Jacobsen SE,Pellegrini M(2010)Relationship between nucleosome positioning and DNA methylation.Nature 466:388–392
Cirillo LA,Lin FR,Cuesta I,Friedman D,Jarnik M,Zaret KS(2002)Opening of compacted chromatin by early developmental transcription factors HNF3(FoxA)and GATA-4.Mol Cell 9:279–289
Cockerill PN(2000)Identification of DNaseI hypersensitive sites within nuclei.In:Tymms MJ,ed.Transcription Factor Protocols.Springer,Totowa,NJ,USA.pp.29–46
Czechowski T,Stitt M,Altmann T,Udvardi MK,Scheible WR(2005)Genome-wide identification and testing of superior reference genes for transcript normalization in Arabidopsis.Plant Physiol 139:5–17
Follows GA,Dhami P,Gottgens B,Bruce AW,Campbell PJ,Dillon SC,Smith AM,Koch C,Donaldson IJ,Scott MA,Dunham I,Janes ME,Vetrie D,Green AR(2006)Identifying gene regulatory elements by genomic microarray mapping of DNaseI hypersensitive sites.Genome Res 16:1310–1319
Gaspar-Maia A,Alajem A,Polesso F,Sridharan R,Mason MJ,Heidersbach A,Ramalho-Santos J,McManus MT,Plath K,Meshorer E,Ramalho-Santos M(2009)Chd1 regulates open chromatin and pluripotency of embryonic stem cells.Nature 460:863–868
Gaulton KJ,Nammo T,Pasquali L,Simon JM,Giresi PG,Fogarty MP,Panhuis TM,Mieczkowski P,Secchi A,Bosco D,Berney T,Montanya E,Mohlke KL,Lieb JD,Ferrer J(2010)A map of open chromatin in human pancreatic islets.Nat Genet 42:255–259
Gesteland RF,ed.(2006)The RNA World,3rd edition.Spring Harbor Laboratory Press:New York.
Giresi PG,Kim J,McDaniell RM,Iyer VR,Lieb JD(2007)FAIRE(formaldehyde-assisted isolation of regulatory elements)isolates active regulatory elements from human chromatin.Genome Res 17:877–885
Giresi PG,Lieb JD(2009)Isolation of active regulatory elements from eukaryotic chromatin using FAIRE(formaldehyde assisted isolation of regulatory elements).Methods 48:233–239
Haring M,Offermann S,Danker T,Horst I,Peterhansel C,Stam M(2007)Chromatin immunoprecipitation:Optimization,quantitative analysis and data normalization.Plant Meth 3:11
Kaufmann K,Muino JM,Jauregui R,Airoldi CA,Smaczniak C,Krajewski P,Angenent GC(2009)Target genes of the MADS transcription factor SEPALLAT A3:Integration of developmental and hormonal pathways in the Arabidopsis flower.PLoS Biol 7:854–875
Kuan PF,Chung DJ,Pan GJ,Thomson JA,Stewart R,Keles S(2011)A statistical framework for the analysis of ChIP-Seq data.J Amer Statist Assoc 106:891–903
Langmead B,Trapnell C,Pop M,Salzberg SL(2009)Ultrafast and memory-efficient alignment of short DNA sequences to the human genome.Genome Biol 10:R25
Lee W,Tillo D,Bray N,Morse RH,Davis RW,Hughes TR,Nislow C(2007)A high-resolution atlas of nucleosome occupancy in yeast.Nat Genet 39:1235–1244
Li H,Durbin R(2009)Fast and accurate short read alignment with Burrows–Wheeler transform.Bioinformatics 25:1754–1760
Louwers M,Bader R,Haring M,van Driel R,de Laat W,Stam M(2009)Tissue-and expression level-specific chromatin looping at maize b1 epialleles.Plant Cell 21:832–842
Luger K,Mäder AW,Richmond RK,Sargent DF,Richmond TJ(1997)Crystal structure of the nucleosome core particle at 2.8 resolution.Nature 389:251–260
Muino JM,Kaufmann K,van Ham RCHJ,Angenent GC,Krajewski P(2011)ChIP-seq analysis in R(CSAR):An R package for the statistical detection of protein-bound genomic regions.Plant Meth 7:11
Myers FA,Evans DR,Clayton AL,Thorne AW,Crane-Robinson C(2001)Targeted and extended acetylation of histones H4 and H3 at active and inactive genes in chicken embryo erythrocytes.J Biol Chem 276:20197–20205
Nagy PL,Cleary ML,Brown PO,Lieb JD(2003)Genomewide demarcation of RNA polymerase II transcription units revealed by physical fractionation of chromatin.Proc Natl Acad Sci USA 100:6364–6369
Omidbakhshfard MA,Omranian N,Ahmadi FS,Nikoloski Z,Mueller-Roeber B(2012)Effect of salt stress on genes encoding translationassociated proteins in Arabidopsis thaliana.Plant Signal Behav 7:1095–1102
Parker R(2012)RNA degradation in Saccharomyces cerevisiae.Genetics 191:671–702
Perez-Rodriguez P,Riano-Pachon DM,Correa LG,Rensing SA,Kersten B,Mueller-Roeber B(2010)PlnTFDB:Updated content and new features of the plant transcription factor database.Nucl Acids Res 38:D822–D827
Peterson CL,Laniel MA(2004)Histones and histone modifications.Curr Biol 14:R546–R551
Ponts N,Harris EY,Prudhomme J,Wick I,Eckhardt-Ludka C,Hicks GR,Hardiman G,Lonardi S,Le Roch KG(2010)Nucleosome landscape and control of transcription in the human malaria parasite.Genome Res 20:228–238
Rambaldi D,Ciccarelli FD(2009)FancyGene:Dynamic visualization of gene structures and protein domain architectures on genomic loci.Bioinformatics 25:2281–2282
Robinson JT,Thorvaldsdottir H,Winckler W,Guttman M,Lander ES,Getz G,Mesirov JP(2011)Integrative genomics viewer.Nat Biotech 29:24–26
Saleh A,Alvarez-Venegas R,Avramova Z(2008)An efficient chromatin immunoprecipitation(ChIP)protocol for studying histone modifications in Arabidopsis plants.Nat Protoc 3:1018–1025
Schmittgen TD,Livak KJ(2008)Analyzing real-time PCR data by the comparative CTmethod.Nat Protoc 3:1101–1108
Shi B,Guo X,Wu T,Sheng S,Wang J,Skogerbo G,Zhu X,Chen R(2009)Genome-scale identification of Caenorhabditis elegans regulatory elements by tiling-array mapping of DNase I hypersensitive sites.BMC Genomics 10:92
Simon JM,Giresi PG,Davis IJ,Lieb JD(2012)Using formaldehydeassisted isolation of regulatory elements(FAIRE)to isolate active regulatory DNA.Nat Protoc 7:256–267
Solomon MJ,Varshavsky A(1985)Formaldehyde-mediated DNA–protein crosslinking:A probe for in vivo chromatin structures.Proc Natl Acad Sci USA 82:6470–6474
Song L,Zhang Z,Grasfeder LL,Boyle AP,Giresi PG,Lee BK,Sheffield NC,Graf S,Huss M,Keefe D,Liu Z,London D,McDaniell RM,Shibata Y,Showers KA,Simon JM,Vales T,Wang T,Winter D,Clarke ND,Birney E,Iyer VR,Crawford GE,Lieb JD,Furey TS(2011)Open chromatin defined by DNaseI and FAIRE identifies regulatory elements that shape cell-type identity.Genome Res 21:1757–1767
Wang G,Zhu QG,Meng QW,Wu CA(2012)Transcript profiling during salt stress of young cotton(Gossypium hirsutum)seedlings via Solexa sequencing.Acta Physiol Planta 34:107–115
Winck FV,Arvidsson S,Riaño-Pachón DM,Hempel S,Koseska A,Nikoloski Z,Urbina Gomez DA,Rupprecht J,Mueller-Roeber B(2013)Genome-wide identification of regulatory elements and reconstruction of gene regulatory networks of the green alga Chlamydomonas reinhardtii under carbon deprivation.PLoS ONE 8:e79909
Wittkopp PJ(2010)Variable transcription factor binding:A mechanism of evolutionary change.PLoS Biol 8:e1000342
Wu A,Allu AD,Garapati P,Siddiqui H,Dortay H,Zanor MI,Asensi-Fabado MA,Munne-Bosch S,Antonio C,Tohge T,Fernie AR,Kaufmann K,Xue GP,Mueller-Roeber B,Balazadeh S(2012)JUNGBRUNNEN1,a reactive oxygen species-responsive NAC transcription factor,regulates longevity in Arabidopsis.Plant Cell 24:482–506
Yuan GC,Liu YJ,Dion MF,Slack MD,Wu LF,Altschuler SJ,Rando OJ(2005)Genome-scale identification of nucleosome positions in S.cerevisiae.Science 309:626–630
Zhang W,Zhang T,Wu Y,Jiang J(2012)Genome-wide identification of regulatory DNA elements and protein-binding footprints using signatures of open chromatin in Arabidopsis.Plant Cell 24:2719–2731
Zhang Y,Liu T,Meyer CA,Eeckhoute J,Johnson DS,Bernstein BE,Nussbaum C,Myers RM,Brown M,Li W,Liu XS(2008)Modelbased analysis of ChIP-Seq(MACS).Genome Biol 9:R137
SUPPORTING INFORMATION
Additional supporting information can be found in the online version of this article:
Table S1.Sequences of quantitative polymerase chain reaction(qPCR)primers
 Journal of Integrative Plant Biology2014年6期
- Journal of Integrative Plant Biology的其它文章
- A new loss-of-function allele 28y reveals a role of ARGONAUTE1 in limiting asymmetric division of stomatal lineage ground cell
- Polycomb-group histone methyltransferase CLF is required for proper somatic recombination in Arabidopsis
- Rice MtN3/saliva/SWEET gene family:Evolution,expression profiling,and sugar transport
- Molecular characterization and expression analysis of Triticum aestivum squamosa-promoter binding protein-box genes involved in ear development
- BnWRI1 coordinates fatty acid biosynthesis and photosynthesis pathways during oil accumulation in rapeseed
- Genetic analysis of biomass and photosynthetic parameters in wheat grown in different light intensities