
住宅景观绩效评价:基于现场数据的视觉与生物气候学分析
2015-09-28 08:22撰文杨波美国帕梅拉布莱克默美国克里斯宾德
风景园林 2015年1期
撰文:杨波 (美国)帕梅拉·布莱克默 (美国)克里斯 宾德
翻译:刘京一 周珏琳
校对:吴丹子

1瀑布花园住宅,科罗拉多州皮特金县(照片由DesignWorkshop 景观建筑设计和规划研究事务所授权提供)Cascade Garden residence in Pitkin County,Colorado (Image courtesy: Design Workshop, Inc. Used with permission).

2 从可以直接看到景观缓冲带的休憩空间拍摄的全景照片(照片由D.A. Horchner/Design Workshop 景观建筑设计和规划研究事务所授权提供)Panoramas were taken from this prominent seating area looking directly towards the landscape buffer. (Image courtesy: D.A. Horchner / Design Workshop, Inc. Used with permission).
1 引言
正如在建筑和工程领域中普遍存在的情况一样,风景园林师从多方面阐释设计的效益也变得日益重要。虽然现在景观绩效的度量方面已有进步,但风景园林师们还必须继续寻找量化景观绩效的方法为其设计提供依据。这个量化评估的过程为理论和实践提供了一个重要的联系,而这种联系有助于为指导未来循证的设计建立研究基础,因此必须得到加强。(布朗、科里,2011;戴明、斯沃菲尔德,2011;Design Workshop 景观建筑设计和规划研究事务所,2007)
许多研究已经探讨过关于景观设计的效益和价值(布考特等,1994;那藻尔,1995,2012;恩杜比斯,2002,2008;戴明和斯沃菲尔德,2011;卡波特森和马丁尼奇,2012)。2010年,美国风景园林基金会(Landscape Architecture Foundation,简称LAF)提出了一个新的研究和实践领域——景观绩效(landscape performance)。LAF将景观绩效定义为“景观实现预期目标和助力于可持续发展的衡量指标。”其核心是量化地评估一个项目在环境、社会、与经济3个方面的效益。
作为2013LAF案例研究调查(Case Study Investigation,简称CSI)计划的一部分,我们的研究评估了3个住宅景观项目,量化了它们各自在经济、社会与环境方面的效益。基于最初的绩效目标,项目分析与案例研究由犹他州立大学(USU)的一个研究小组与来自Design Workshop景观建筑设计和规划研究事务所的该项目的设计团队合作完成。
2 住宅景观绩效评估概述
调查小组分析了位于美国科罗拉多州皮特金县的3个住宅景观项目的19项绩效指标。本文介绍2个社会效益研究项目:一项是对不美观景物的缓冲效果的视觉评估,另一项是户外活动空间的生物气候学设计。其中一个住宅项目设计了景观缓冲带以遮蔽附近一条道路的不佳景色。另一个项目则精心设计了层次丰富的植被以营造舒适的室外微气候条件。
选择这些进行分析主要有如下两个原因:首先,对视觉质量和户外舒适度的维护和提高是客户对设计的首要要求,因而评估相关的效益可以证明相应的设计策略在多大程度上是有效的。其次,由于缺乏研究数据与方法等原因,之前的CSI研究员们在公共项目的社会效益量化评估上都曾遇到过挫折,因此在住宅项目尺度上的难度也可想而知。本文展示了方法论上的创新,以期推动社会效益评价方法的进步。
2.1 瀑布花园住宅(Cascade Garden Residence)的视觉质量评估
瀑布花园是一个宁静的高海拔项目,设计保留了原场地的自然环境与生态系统,同时也满足了业主对便利的户外服务设施的需求(图1)。场地原有的老房子被拆除,取而代之的是一个与环境融为一体且尽可能小地干扰原场地的新建筑。场地上有一个池塘,栽植了水生植物以给鳟鱼提供一个适宜的栖息环境。池塘里的水可以用来浇灌。由于基地气候条件对植物生长较为苛刻,还有野生动物出没,因此在植物的选择上挑选了易成活、低维护的种类。大部分传统草坪被需要较少的水和肥料的乡土植物代替。同时,这个住宅还采用了可再生能源,有一个地热泵用以维持户外设施的运行。
设计中一个重要考虑是遮挡场地前方邻近道路的不良景观,同时保留远山美丽的景致。设计团队设计了一道土坡和植物来达到此目标。调查小组用数码摄影技术模拟人在景观中的体验,从而评估设计对不良景观的屏蔽程度(杨等,2013a)。
过去早已有过大量有关视觉质量评估的研究,下面的步骤借鉴并改进了克莱和马尔什(1997)与陈等人(2009)的方法。然而,与之前着重研究静态对象不同的是,这个研究涉及到动态对象的视觉质量评估。研究使用的都是普通易得的硬件设备(数码相机和电脑)以及相对便宜的软件(Adobe Photoshop)。
首先,全景照片是在场地的关键地点拍摄的:露台中间的休憩空间上。选取这个位置是因为屋主显然将它作为一个观赏道路较远一侧的群山景致的主要区域(图2)。照片想要模拟一辆汽车开过公路的场景,于是我们也拍了一张汽车的照片。照片被导入Photoshop,给那辆车的图层叠加了一个易于辨认的颜色。图片用Photoshop调整了大小以匹配车的大小,使其看起来好像本来就处于照片中。汽车图层被反复地复制粘贴,从场地的一端到另一端成一个带状轨迹,代表了汽车驶过这段道路时将会占据的总的视觉空间。若没有景观缓冲带,这块视觉区域将被屋主看到。

3位于科罗拉多州皮特金县的国会谷住宅(照片由D.A.Horchner/Design Workshop 景观建筑设计和规划研究事务所授权提供)Fig.3 Capitol Valley residence in Pitkin County, Colorado(Image courtesy: D.A. Horchner / Design Workshop, Inc.Used with permission)

4生物气候学设计策略,如使用植被减缓风速以及太阳直射,创造三季适宜的户外空间(照片由D.A. Horchner/Design Workshop 景观建筑设计和规划研究事务所授权提供)Bioclimatic design strategies, such as the use of vegetation to mitigate wind and sun exposure, produce comfortable outdoor spaces for three-season use.(Image courtesy: D.A. Horchner / Design Workshop, Inc. Used with permission)

5位于国会谷住宅的房屋主人的户外行为模式和生物气候学抽样调查点Homeowner's use patterns and sampling locations of bioclimatic study at Capitol Valley residence
Photoshop中的直方图工具用来检测汽车的行驶轨迹图层中一共有多少个像素点。若没有景观缓冲区的存在,这些像素点将被看见。然后将轨迹图层移至全景照片图层之下,选择全景照片图层,用容差非常低的魔棒工具选中并擦除在道路较远的一侧,仅显示汽车运动轨迹中没有被景观缓冲带遮挡的部分。最后,合并图层,选择运动轨迹中能被看见的部分。再次使用直方图工具检测行驶轨迹还留下多少可见的像素点。计算出完整汽车运动轨迹与被景观缓冲带遮挡后剩余的轨迹像素数之差,即可以判定景观缓冲带在多大程度上达到设计目标。
2.2 国会谷农场住宅(Capitol Valley Ranch Residence)的生物气候学评估
国会谷农场是一个大型牧牛农场上面积为1英亩(约4 047m2)的住宅场地,基地周围是科罗拉多州高海拔的美景(杨等,2013b)。设计包含了马厩、马场、谷仓以及住宅,因此,保留现状活动,保护文化和开放空间需得到重视(图3)。
设计目标是通过考虑场地的自然环境并合理布局相关的景观元素,如住宅、露台、种植和铺装等,从而为业主创造一个舒适的户外空间(图4)。另外,材料的使用同样也有助于营造舒适的小气候。例如硬质景观中的砂岩石板,当暴露在太阳直射下时积蓄热量,处于阴影中时则可以通过辐射放出热量。这些因素可以通过现场测量得到量化,与已有标准对比,从而表明这些状况有助于提高人们的舒适度。
虽然生物气候学分析在建筑领域已经很普遍,但在风景园林领域还处于普及阶段。本研究主要建立在建筑师维克多·欧尔焦伊(1973)的著作《设计结合气候》“人体舒适区”这一章节中所使用的方法和参数的基础上。调查小组需要确认当房屋主人在一天中的特定时间使用这些空间时,设计能将气候舒适等级提升到什么程度。我们对房屋的主人进行询问以确定其行为模式,并将抽样点布置在场地中(图5)。问卷调查表在研究开展之前经犹他州立大学(USU)的机构审查委员会(IRB)审查并通过(IRB协议5225)。
3 分析与结果
3.1 瀑布花园住宅的视觉质量评估
分析所使用的交通工具的照片如图6。我们选用了一辆丰田普锐斯,因为它是一种常见的交通工具,而且我们手头就有一辆。将照片在Photoshop中进行颜色叠加并垂直翻转,匹配汽车在全景照片中的行驶方向。
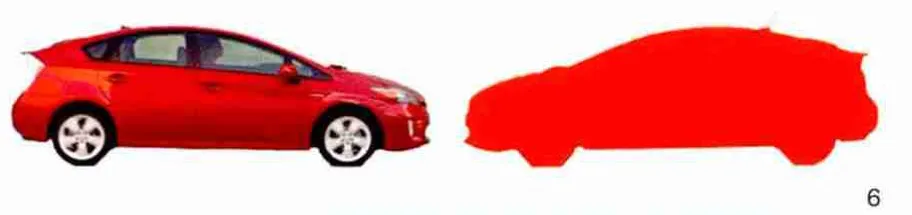
6(a)用于检验对临近道路视觉屏蔽效果的交通工具(b)使用颜色叠加后的图像(a)Vehicle used to determine effectiveness of landscape buffer in blocking views of nearby road (b) the color overlay applied

7 汽车行驶轨迹图层位于全景照片图层之上The line of travel swath layered atop the panoramic photograph

8 所选图层(行驶轨迹)的像素数Pixel count for the selected layer (the traffic swath)

9 删去背景透露出行驶轨迹的可见部分Removing the background revealed the visible parts of the traffic swath
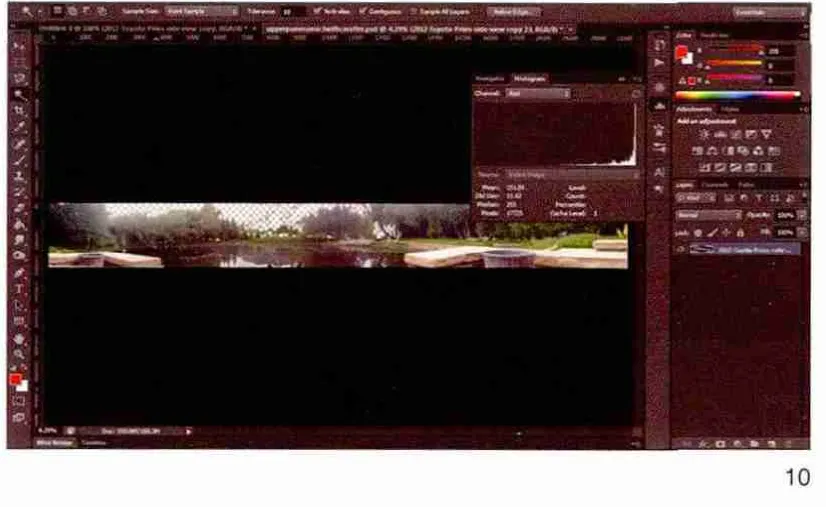
10直方图显示仍然可见的像素数量Fig.10 The histogram reveals how many pixels are visible

11使用Kestrel牌仪器收集国会谷住宅的气候数据Using the Kestrel device to gather climatic data at the Capitol Valley residence

12国会谷住宅的相对湿度、风速和温度数据在ArcMap中的内插值处理结果Relative humidity, wind velocity, and temperature data interpolated in ArcMap for Capitol Valley residence

13上午、中午和下午的人体舒适度图表Human comfort chart in morning, afternoon, and evening
在户外休憩空间拍摄的全景照片如图7。照片的取景范围延伸至该项目的边界,毗邻着需要被遮挡的道路。调整颜色叠加后的图像大小,使之与照片的尺度相吻合。最终得到一条着色的轨迹,代表汽车在路上行驶时所占据的视觉空间(图7)(即观察者与道路之间毫无遮挡时交通工具所占据的视觉空间)。
直方图显示这条轨迹由796 196个像素点组成(图8)。注意需要将直方图中的高速缓存级别设为1,从而确保计算的是整个图层而不是随机选择。
将着色的轨迹移至全景照片图层之下,使用魔棒工具将全景照片中道路较远一侧的植被选取并擦除(图9)。这时,轨迹只剩下了未被土坡、植被、围篱和住宅大门遮住的部分。
最终,选取被遮挡轨迹的可见部分,直方图显示这条轨迹未被缓冲带遮挡的部分由17 725个像素点组成(图10)。该结果显示,不佳景观仅剩下约2.2%的仍然可见,即97.8%的不佳景观被遮住。这说明了设计成功地达到了遮蔽住宅紧邻道路上不良景观的设计目标。
3.2 国会谷农场住宅项目的生物气候学评估
我们在场地上选取了66个点,分3个时段(上午9:15,中午12:30,下午5:00)测量了每个位置的温度、相对湿度和风速(图11)。测量仪器为Kestrel 4000便携式天气预报装置(风速精度:±3%,温度精度:±1℃,相对湿度精度±3%),每个点上都进行相同的测量流程。现场收集的数据可见附录。
为了将数据在空间中表达出来,我们使用ArcMap10.1软件,将这些数据按克里金法(一种在土壤学和地质学中常用的插值方法——译者注)以内插值进行替换(图12)。这些图片显示了场地在上午、中午和下午的风速、相对湿度和温度的总体趋势。

14早上的人体舒适度测量结果Human comfort measurements in morning
接下来我们将温度和相应的相对湿度数据放入人体舒适度图表(图13)中。人体舒适度图表根据维克多·欧尔焦伊提出的参数,以相对湿度和温度的关系确定人体舒适度。落在红色区域内表示该位置此时此地的气候状况在人体舒范围内,我们认为它符合设计的目标。
在所有取样点中,我们将位于房屋主人日常使用空间中的31个点进行统计:上午时段有24个点(占77%)在人体舒适范围内,中午为13个(占42%),下午为15个(占48%)。
最后,我们分析了在某个时间段中哪些空间得到了使用,这样我们便可以在很大程度上了解不同时间段中房屋主人的舒适程度(图14-15)。将不同时段房主使用空间中的点进行统计,计算出在舒适范围内的点占该空间中所有取样点的百分比,结果为上午占83%,中午占44%,下午占90%。
4 讨论
现场调研的数据分析结果已经表明景观设计的有效性,问题是设计如何在此基础上进一步提高。在瀑布花园中,茂盛植被覆盖的土坡一年四季都可以提供视觉缓冲。虽然落叶植物在夏季以外的季节缓冲作用十分有限,但瀑布花园本身主要是一个夏季住所。将来在类似的住宅项目中也需要考虑其他季节的视觉质量。另外,植被尚未成熟时的缓冲效果较差,这是在选择植物以及确定土坡高度时需要注意的方面。
在国会谷牧场案例的生物气候学分析表明,成为人体舒适区的户外空间与业主自我感知的区域相一致。研究还表明,有设计介入的地点更加舒适(图15)。图16显示了不那么舒适的空间,这些空间在白天并不会太冷,而且当中至少有一个数据点显示它们太热。这说明了这些地方的阳光过于强烈,可以通过栽植植物来解决。需要注意的是,房屋北边绿化区中的一些数据点显示这里过于潮湿。在创造舒适空间的同时,还要求在绿地中设计一个蔬菜园,这需要不加遮蔽的阳光,因而与人的舒适感形成了一定矛盾。
这项研究也存在一定局限性,需要在将来的研究中加以针对性处理。视觉分析方面的局限性主要在于摄影技术并不能完全再现人在景观中的体验。拍照的地点到道路上每个点的距离虽然几乎不变,但并非完全一样,因此,现实中观察到的汽车的尺寸应该是略有变化的。另外,在现实中,汽车在人的视野的边缘会变得较小和不易察觉,而照片提供的轨迹无法反应这些。同时,丰田普锐斯或许不能代表所有交通工具,例如卡车的尺寸会大一些,因而可见性会更强。
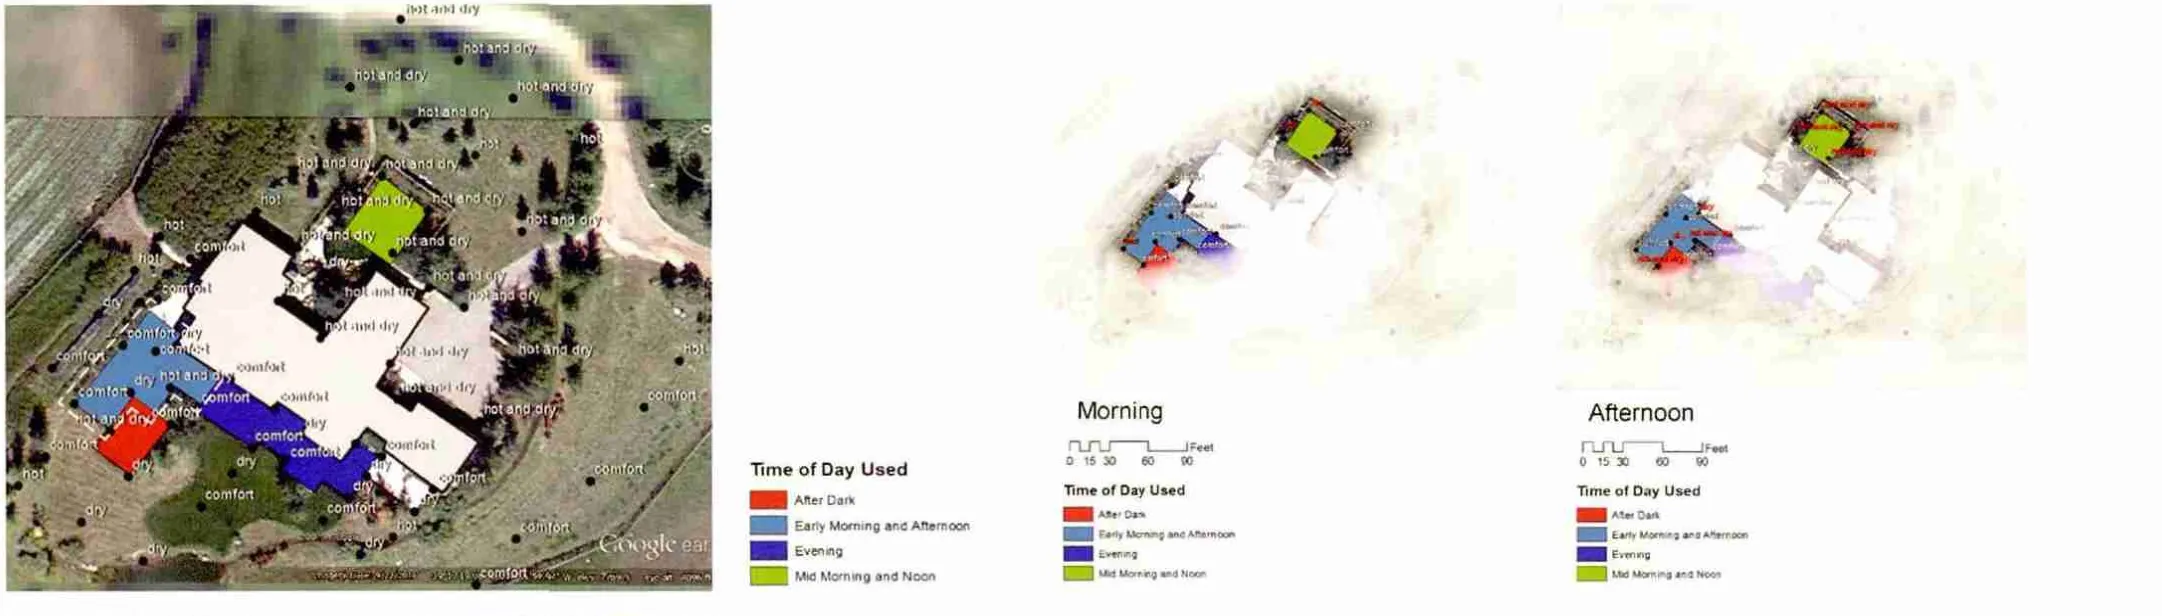
15下午和晚上的人体舒适度测量结果Human comfort measurements in afternoon and evening

16不在人体舒适范围内的取样点Sampled locations that are not within the human comfort zone
同样,生物气象学的分析也存在着局限性。首先,数据点并非完全同时取样,而温度在同一个时间段之中也会有所改变。其次,虽然温度与湿度相结合的指标在室内热舒适性衡量中已经有着广泛的应用,室外环境热舒适性的评估指标也已得到发展,但目前并没有一个标准化的指标体系被全世界接受和使用,因而我们的研究在此领域也具有一定开创性。最后,未来的研究还应该保留能够显示场地开发前状况的数据,这也许可以通过收集场地周边未受开发影响的区域的数据,并与场地中的数据进行对比来实现。
5 总结与结论
LAF的景观绩效案例系列研究囊括了超过20种的项目类型,包括公共公园、街道景观、广场以及动物园等。这些案例研究为评估不同项目的可持续性提供了宝贵的研究数据和研究方法。然而在如此广泛的研究对象中,没有人考虑过独栋家庭住宅——无论对大众还是风景园林师来说都是最广泛且最可行的可持续性设计领域之一。另外,基于住宅尺度上的有限的数据与资金,使得评估可持续设计的社会效益十分困难,需要研究团队基于设计师制定的目标来收集现场数据。
这项研究表明了尽管存在不同的文化偏好和有限的基础数据,景观的社会绩效还是可以在住宅尺度上进行衡量的。个人偏好的差异并不足以妨碍研究提供有价值的景观绩效衡量方式。通过跨领域的借鉴,研究建立了可以在实践中推广的度量标准和方法。在将来的设计中,风景园林师可以在强调视觉效果和生物气候效益的类似项目中应用这种分析方式。随着LAF持续进行的案例研究,以及CSI团队将研究成果在同行间进行宣传,我们的事业将会有更大的进步与贡献,以期使整个风景园林事业最终因此而获益。
附录:
国会谷农场住宅项目的生物气候数据。
致谢:
我们衷心感谢来自Design Workshop景观建筑设计和规划研究事务所的阿利森·门登霍尔(Allyson Mendenhall)、科特·卡伯特森(Kurt Culbertson)、理查德·肖(Richard Shaw)、苏珊妮·杰克逊(Suzanne Jackson)、艾利斯·阿什利(Ashley Allis)、达拉·卡拉威(Darla Callaway)、戴尔·霍赫纳(Dale Horchner)、艾莉森·凯利(Alison Kelly)、萨拉·肖(Sara Shaw)、迈克尔·唐特(Michael Tunte)为我们研究提供的不可或缺的帮助。衷心感谢来自美国风景园林基金会的凯瑟琳·伯吉斯(Katharine Burgess)、希瑟·惠伊洛(Heather Whitlow)和芭芭拉·多伊奇(Barbara Deutsch)对我们进行的指导与协助。该研究由美国风景园林基金会2013 CSI案例研究项目以及犹他州农业实验站、犹他州立大学资助(期刊论文号8691)。文中所有观点、发现、结论及建议属于本文作者,不一定反映美国风景园林基金会和犹他州农业实验站的观点。
1 Introduction
As is common in the architectural and engineering professions, the need for landscape architects to demonstrate the multifaceted benefi ts of successful designs has become increasingly important. While progress have been made in reporting landscape performance metrics,landscape architects must still seek innovative ways to quantify performance benefits in order to justify their design proposals. The process of this quantitative assessment provides a crucial link between academics and practitioners that must be strengthened in order to form the research basis for the next generation of evidence-based design(Brown and Corry, 2011; Deming and Swaffield,2011; Design Workshop, 2007).
A number of studies have tackled the performance and value of landscape design(Bookout et al., 1994; Nassauer, 1995, 2012;Ndubisi, 2002, 2008; Deming and Swaffi eld, 2011;Culbertson and Martinich, 2012). An emerging research/practice area, landscape performance has been put forth by the Landscape Architecture Foundation (LAF) in 2010.The LAF defines landscape performance as “the measure of effi ciency with which designed landscape solutions fulfill their intended purpose and contribute to sustainability.” The core of landscape performance assessment is to quantitatively demonstrate a project’s environmental, social, and economic benefi ts.
As part of the 2013 LAF Case Study Investigation (CSI) program, three residential projects were evaluated to quantify the economic,social, and environmental performance benefits of each. Based on original performance objectives,project analyses were conducted and case studies were produced collaboratively by a Utah State University (USU) research team and the projects’design teams at Design Workshop.
2 Residential Landscape Performance Assessment Overview
The research team examined 19 performance benefits for three residential projects in Pitkin County, Colorado, USA. This paper presents details of two sets of analyses for social benefi ts—a visual assessment of buffering unwanted views and bioclimatic design in an outdoor living space.One of the residential projects includes a landscape buffer designed to screen undesirable views of an adjacent roadway. In another project, careful placement of multi-layered vegetation achieves comfortable outdoor microclimate conditions.
These analyses were selected for two main reasons. First, the preservation and improvement of visual quality and outdoor comfort were design priorities set by the clients. As a result, assessing relevant benefits would suggest the extent to which the corresponding design strategies are effective. Second, past CSI researchers experienced difficulties in quantifying social benefits derived from public projects, let alone at a residential scale (e.g., lack of data and methods). This study presents innovations in methodologies, with the intent to further promote social benefi t assessment.
2.1 Cascade Garden Residence Visual Quality Assessment
Cascade Garden is a tranquil, high-altitude residential property, designed to preserve the area’s natural setting and ecosystem while meeting the property owner’s requests for outdoor amenities(Fig. 1). An existing house was dismantled and a new home was integrated into the landscape with minimal site disturbance. The 2.5-acre site features an existing pond, which was planted with riparian vegetation and modified to support trout habitat and supply water for landscape irrigation. Because of the harsh, climate and presence of wildlife,plant species were carefully selected to ensure high growth levels and low maintenance. Most of the traditional lawn was replaced with native plants, which conserve water and reduce fertilizer consumption. The home also employs renewable energy through a ground-source heat pump that is used to operate outdoor site features.
One of the key design considerations was to buffer the unwanted view of the road directly adjacent to the front of the property,while preserving views to the distant mountains.The design team incorporated an earthen berm and plantings in order to achieve this goal. The research team evaluated the success of the design in mitigating unwanted views through the use of digital photography to approximate the experience of the client in the landscape (Yang et al., 2013a).
Extensive studies on visual quality assessment have been undertaken in the past and the following procedure borrows from methodology developed by Clay and Marsh (1997) and Chen et al. (2009).However, whereas past studies focused largely on static objects, this study utilizes a method based on assessment of visual quality as it relates to dynamic objects. The method relies on commonly available hardware (digital cameras and computers) and relatively inexpensive software (Adobe Photoshop).
First, panoramic photographs were taken from a key point on the property: the seating area on the middle of the patio. This location was chosen for its obvious use by the homeowner as a primary area from which to enjoy scenic views of the mountains on the far side of the road (Fig.2). The photographs were taken as a vehicle drove down the road. A photograph of the vehicle was also taken. The photographs were imported into Adobe Photoshop where a color overlay was applied to give the car a solid and easily visible color. The image was resized in Photoshop to match the scale of the car as it appears in the photograph.The image of the car was then copied and pasted repeatedly to create a swath from one end of the property to the other that is representative of the total visual area the vehicle would occupy when traveling on the road. This is the visual area that would be visible to the client if no buffer were present.
The histogram feature in Photoshop was used to measure the number of pixels present in the swath layer. This is the number of pixels that would be visible if no buffer were present. The swath layer was moved underneath the panorama layer and the wand tool, set on a very low tolerance, was used to erase those parts of the panorama image that lie on the far side of the road. This revealed the swath in just those areas that are not covered by elements in the buffer. Finally, the layers were merged and the visible parts of the traffi c swath were selected. The histogram function was used again to determine how many visible pixels from the swath remained.The difference in the number of pixels in the entire swath and the number that remained visible through the buffer were compared to determine the success of the buffer in meeting design objectives.
2.2 Capitol Valley Ranch Residence Bioclimatic Assessment
Capitol Valley Ranch, a one-acre home site situated on a larger working cattle ranch, is nestled into a rural high-altitude Colorado landscape(Yang et al., 2013b). The design for the property includes a working ranch with horses, stables, and a barn coexisting with a residence, thereby retaining traditional practices and preserving cultural and open space values (Fig. 3).
The design intent was to create comfortable outdoor spaces for the homeowner through a consideration of the site’s natural environment and the relative placement of elements in the landscape such as the home, patio, plantings, and hardscape(Fig. 4). In addition, the materials used also affect the creation of comfortable microclimates. The flagstone of the hardscape, for example, acts as a thermal mass that collects heat when exposed to direct sun and radiates heat when shaded.These factors were quantified through in-situ measurements compared against an established metric that defines the conditions conducive to human comfort.
While bioclimatic analysis is common in architecture, it has yet to become common in the landscape architecture profession. This study was based primarily on methods and parameters developed by architect Victor Olgyay (1973),using the Human Comfort Zone from his book Design with Climate. The research team needed to determine how well the climatic comfort level of the design met the needs of the homeowner for particular times of day when these spaces were used. The homeowner was surveyed to determine patterns of use and sampling points were located across the site (Fig. 5). The survey instrument was reviewed by the Institutional Review Board (IRB)at USU before the interview was conducted (IRB Protocol 5225).
3 Analysis and Results
3.1 Cascade Garden Residence Visual Quality Assessment
The photographs of the vehicle used in the analysis are shown below in Figure 6. A Toyota Prius was selected for use in this analysis because it was readily available to researchers and is a common vehicle. The color overlay was imported into Photoshop and the image was fl ipped vertically to match the direction of travel of the Prius in the panoramic photo.
The panoramic photograph taken from the outdoor seating area is shown in Figure 7. The panorama is limited to the extent of the property that borders the road being buffered. The overlay image was resized in Photoshop to match the scale of the car as it appears in the photograph. A colored swath was created to represent the total area the vehicle would occupy when traveling on the road (i.e., the visual area that would be occupied by a vehicle if no buffer were present between the viewer and the road).
The histogram feature determined that the swath was composed of a total of 796,196 pixels (Fig. 8). Note that the Cache Level on the Histogram has been set to 1 to ensure that the entire layer is being evaluated, not a random selection.
The colored swath layer was moved underneath the panorama layer and the parts of the image showing vegetation on the far side of the road were erased using the wand tool (Fig. 9). This revealed the swath in just those areas that are not covered by berms, planting, fences, or gates on the property.
Finally, the layers were merged and the visible portions of the traffic swath were selected. The histogram function determined that a total of 17,725 pixels from the swath remained visible despite the buffer (Fig. 10). The results indicate that approximately 2.2% of the unwanted view remained visible. This equates to 97.8% of unwanted views blocked. This represents a very successful outcome of the original design intent to buffer unwanted views of the road directly abutting the property.
3.2 Capitol Valley Ranch Residence Bioclimatic Assessment
Temperature, relative humidity, and wind velocity were measured on-site during three periods(morning at 9:15 am, afternoon at 12:30 pm, and evening at 5:00 pm) at sixty-six points throughout the landscape (Fig. 11). The measurement device used was a Kestrel 4000 Pocket Weather Tracker(Wind speed accuracy: ±3%. Temperature: ±1°C.Relative humidity accuracy: ±3%) using consistent procedures at each point. (See Appendix A)
In order to spatially represent the data, they were interpolated using the Kriging method in ArcMap10.1 (Fig. 12). These images show general trends across the site for wind velocity, relative humidity, and temperature for morning, afternoon,and evening.
Temperatures and corresponding relative humidity data were entered into a human comfort chart (Fig. 13). This chart uses a relationship between relative humidity and temperature to set guidelines for human comfort that correspond with Victor Olgyay’s parameters. Points inside the red box indicate that climatic conditions at the time the data were gathered at that location were within the Human Comfort Zone and are considered to meet design goals.
Of all the sampling locations, the outdoor locations identified as spaces the homeowner habitually uses were factored into the following calculations. Of the 31 data points gathered in these spaces, 24 (77%) are in the comfort zone in the morning, 13 (42%) in the afternoon, and 15(48%) in the evening.

?
A fi nal analysis considered which spaces were being used at certain times in order to determine the comfort of the homeowner when he/she was most likely occupying that space. This simple inquiry calculated the percentage of data points that fell within the comfortable category out of the total points in the space (Fig. 14 and Fig. 15).The results indicate that of the data points in the spaces, 83% in the morning were comfortable; in the afternoon, 44% were comfortable; and in the evening, 90% were comfortable.
4 Discussion
The results demonstrate the effectiveness of landscape designs, supported by empirical insitu data. The question is how design interventions could be further improved based on these results.In Cascade Garden, an earthen berm with lush vegetation provides a year-round visual buffer.Although the use of deciduous vegetation limits the buffer’s effectiveness in seasons other than summer, this is primarily a summer residence. For future, similar residential projects, visual quality protection or enhancement would also consider the visual effects in other seasons. In addition, holes in the buffer exist where vegetation has not matured.This important aspect should be included in species selection and in gauging berm height.
In Capitol Valley Ranch, the bioclimatic analysis indicates that the outdoor spaces that fall into the Human Comfort Zone are in accord with residents’ self-reported behavior mapping (Fig. 15).This study also reveals where design intervention would make the site more comfortable. Figure 16 highlights all instances where the spaces used are not comfortable. None of the spaces at the time of day they are being used by the homeowner are too cold for comfort, and all have at least one data point that is too hot. This suggests too much sunlight is permeating the spaces. With the maturation of vegetation, these issues may be resolved. The green area at the north side of the house contains several data points that were too warm and deserves an explanation. While a priority was to provide comfortable spaces, another design objective was to include a vegetable garden on the property. This is located in the green space.Unfi ltered sunlight is required for an edible garden to be feasible at this altitude, which presents a confl ict when also designing for human comfort.
Further, this study presents some limitations that should be addressed in future research.Regarding the visual analysis, the major limitations are that the use of photography does not perfectly replicate the experience of an individual in the landscape. The distance from the point of photography to the road, while nearly constant,is not uniform. Therefore, the scale of the car in real life would vary slightly, becoming smaller and less visible towards the edges of one’s field of vision. However, the photograph the study relied on produced a standard size for the swath that does not refl ect such realities. In addition, the use of a Toyota Prius, while expedient for the research team, may not be an accurate representation of all the traffic that the design intended to buffer.Trucks, for example, would be larger and therefore may have the potential to be more visible through the buffer.
Likewise, the bioclimatic analysis presents some limitations. First, because points were not sampled simultaneously, temperatures changed during the timeframe data were gathered across the site. Second, the combination of temperature and humidity metric has been widely used in assessing interior thermal comfort. For outdoor thermal environment assessment other metrics and criteria have been developed. However, there are no standardized metrics that are internationally accepted and used. That said, our study represents a valuable preliminary step forward in this research area. Finally, future research should also address the issue of obtaining baseline data to represent the pre-development conditions. This may be accomplished by comparing surrounding areas not impacted by development to the data obtained onsite.
5 Summary and Conclusion
Over two dozen project types are featured in the LAF Landscape Performance Series Case Study Briefs, representing numerous landscapes ranging from public parks and streetscapes to plazas and zoos. These case studies provide valuable research data and methodologies on quantifying the sustainable aspects of a diverse array of projects.Yet despite such a prolifi c range, prior to this study no one had considered one of the most widespread and accessible applications of sustainable design for both the general public and the professional landscape architect: the single-family home.Moreover, the limited data and funding available on a residential scale makes assessing social benefits of sustainability diffi cult and required the research team to collect in-situ data based on goals set by the designers.
This study shows that despite varying cultural preferences and limited baseline data, social performance of the landscape can be measured on a residential scale. The slight variances in human preference are not significant enough to preclude studies like these from providing valuable and insightful landscape performance measurement.By drawing on studies from other fields, this study helps establish metrics and methods that are potentially replicable in professional practice.Future design work by landscape architects may incorporate this analysis for similar projects prioritizing visual and bioclimatic benefits.As the LAF continues to produce case studies and CSI teams disseminate research findings in peer-reviewed venues, the advancements and contributions made by the profession will be made evident and may benefi t the entire landscape profession.
Appendix
Bioclimate Data of Capitol Valley Ranch Residence
Acknowledgements
We appreciate Allyson Mendenhall, Kurt Culbertson, Richard Shaw, Suzanne Jackson, Ashley Allis, Darla Callaway, Dale Horchner, Alison Kelly, Sarah Shaw, and Michael Tunte from Design Workshop, Inc. for their indispensable help with this research. We thank Katharine Burgess, Heather Whitlow,and Barbara Deutsch from the Landscape Architecture Foundation for their guidance and assistance. This research was supported by the Landscape Architecture Foundation 2013 Case Study Investigation grant and the Utah Agricultural Experiment Station, Utah State University(approved as journal paper number 8691). Any opinions,findings, and conclusions or recommendations expressed are those of the authors and do not necessarily reflect the views of the Landscape Architecture Foundation and the Utah Agricultural Experiment Station.
[1] Bookout, L. W., Beyard, M. D. and Fader, S. W.(1994). Value by Design: Landscape, Site Planning, and Amenities[M]. Washington, DC: Urban Land Institute.
[2] Brown, R. D. and Corry, R. C. (2011). Evidence-based landscape architecture: The maturing of a profession[J].Landscape and Urban Planning, 100(4), 327–329.
[3] Chen, B., Adimo, O. A., & Bao, Z. Y. (2009). Assessment of aesthetic quality and multiple functions of urban green space from the users’ perspective: The case of Hangzhou Flower Garden, China[J]. Landscape and Urban Planning,93, 76–82.
[4] Clay, G. R. and Marsh, S. E. (1997). Spectral analysis for articulating scenic color changes in a coniferous landscape[J]. Photogrammatic Engineering and Remote Sensing, 63(12): 1353–1362.
[5] Culbertson, K. and Martinich, M. (2012). A holistic approach to sustainability: Lessons from the Lafitte greenway in New Orleans, Louisiana[J]. Edinburgh Architectural Research Journal, 33, 1–14.
[6] Deming, E. and Swaffield, S. (2011). Landscape Architectural Research: Inquiry, Strategy, Design[M]. New York: John Wiley & Sons.
[7] Design Workshop. (2007). Towards Legacy[M]. Denver,CO: Grayson Publishing.
Francis, M. (1999). A Case Study Method for Landscape Architecture[M]. Washington, DC: Landscape Architecture Foundation.
[8] Francis, M. (2001). A Case Study Method for Landscape Architecture[J]. Landscape Journal, 20(1), 15–29.
[9] Nassauer, J. I. (1995). Messy ecosystems, orderly frames[J]. Landscape Journal. 14, 161–170.
[10] Nassauer, J. I. (2012). Landscape as medium and method for synthesis in urban ecological design[J].Landscape and Urban Planning, 106(3), 221–229.
[11] Ndubisi, F. (2002).Ecological Planning: A Historical and Comparative Synthesis[M]. Baltimore, MD: Johns Hopkins University Press.
[12] Ndubisi, F. (2008). Sustainable regionalism:Evolutionary framework and prospects for managing metropolitan landscapes[J]. Landscape Journal, 27(1),51–68.
[13] Olgyay, V. (1973). Design with climate: Bioclimatic approach to architectural regionalism[M]. New York: John Wiley & Sons.
[14] Yang, B., Blackmore, P., & Binder, C. (2013a). Cascade Garden. Landscape Architecture Foundation Case Study Briefs[Z/OL].Available from http://www.lafoundation.org/research/landscape-performance-series/case-studies/case-study/628/.
[15] Yang, B., Blackmore, P., & Binder, C. (2013b). Capitol Valley Ranch. Landscape Architecture Foundation Case Study Briefs[Z/OL]. Available from http://www.lafoundation.org/research/landscape-performance-series/case-studies/case-study/627/.
猜你喜欢
住区(2022年6期)2022-02-15
现代装饰(2021年4期)2021-11-02
学生天地(2020年30期)2020-06-01
现代装饰(2020年3期)2020-04-13
现代装饰(2020年2期)2020-03-03
现代园艺(2018年2期)2018-03-15
现代园艺(2018年3期)2018-02-10
现代园艺(2017年13期)2018-01-19
摄影之友(影像视觉)(2017年8期)2017-11-27
地理教学(2015年18期)2016-01-06
