MR扩散张量成像定量参数FA和ADC值在前列腺移行带结节良恶性分级中的应用价值
2016-04-17 05:43可赞王良邓明闵祥德蔡杰冯朝燕李拔森
磁共振成像 2016年5期
可赞,王良,邓明,闵祥德,蔡杰,冯朝燕,李拔森
MR扩散张量成像定量参数FA和ADC值在前列腺移行带结节良恶性分级中的应用价值
可赞,王良*,邓明,闵祥德,蔡杰,冯朝燕,李拔森

目的 探讨MR扩散张量成像(diffusion tensor imaging, DTI)定量参数各向异性值(fractional anisotropy, FA)及表观扩散系数值(apparent diffusion coefficient, ADC)在前列腺移行带(transition zone, TZ)结节良恶性分级中的应用价值。材料与方法回顾性搜集84例TZ有异常结节信号病例,均经靶向超声引导下直肠穿刺活检病理证实:54例为移行带前列腺癌(transition zone-prostate cancer, TZ-PCa),30例为良性前列腺增生(benign prostatic hyperplasia,BPH)。根据病理结果将患者分为3组:BPH、Gleason评分(GS)≤3+4=7、GS≥4+3=7,所有患者均行前列腺常规MRI检查及DTI扫描,测量感兴趣区的FA值和ADC值,统计学方法采用单因素方差分析(ANOVA)。结果3组患者的平均FA值分别为150.52±29.63、215.21±54.59、251.01±59.47,总体差异有统计学意义(F=32.882,P=0.000);组间比较,BPH组与其他2组的差异有统计学意义(P=0.000),GS≤3+4=7与GS≥4+3=7组间差别无统计学意义(P=0.081);3组患者的平均ADC值(×10–6mm2/s)分别为1606.11±234.64、854.00±172.29、742.78±115.91,总体差异有统计学意义(F=202.928, P=0.000);组间比较,BPH组与其他2组均存在差异(P=0.000),GS≤3+4=7与GS≥4+3=7组间差别有统计学意义(P=0.040)。结论DTI定量参数FA和ADC值在鉴别TZ结节良恶性方面有较高的价值,ADC值在恶性结节的高低危分级方面更具优势。
前列腺肿瘤;弥散张量成像
Received 27 Jan 2016, Accepted 28 Mar 2016
ACKNOWLEDGMENTSThis work was part of project of the National Natural Science Foundation of China (No. 81171307).
前列腺移行带(transition zone, TZ)位于尿道前列腺部两侧,前邻前肌纤维基质,后贴前列腺中央带(central zone, CZ),两侧包绕前列腺外周带(peripheral zone, PZ),体积最小,约占前列腺总体积的5%[1]。随着男性年龄的增长,TZ的体积可能会逐渐增大,并产生异常信号的结节,正确判断结节性质的良恶性,不仅影响临床治疗方案的选择,也影响患者未来的生活质量。近年来,前列腺癌(prostate cancer,PCa)的发病率正逐年升高[2],其中约有25%~30%的PCa发生于TZ[3-4];Akin等[5]的研究表明:TZ的肿瘤灶更易局限于器官内,即TZ相较于PZ来说,早期发现并确诊恶性病灶,患者的预后可能会更好。目前的MRI技术对提高前列腺TZ异常信号结节的检出已有了一定的研究[6-8],而基于弥散加权成像(diffusion-weighted imaging, DWI)技术发展起来的扩散张量成像(diffusion tensor imaging,DTI)技术,随着3.0 T场强、超快速平面回波序列及并行采集技术的应用日趋成熟,已从中枢系统逐步应用于体部,且对正常前列腺及PZ-PCa也有了初步的探究[9-11]。但DTI对于前列腺TZ异常信号结节的疾病诊断与鉴别分级的应用研究还较少,笔者旨在探讨其定量参数表观扩散系数(apparent diffusion coefficient, ADC)值和各向异性(fractional anisotropy, FA)值在前列腺移行带结节分级中的应用价值比较。
1 材料与方法
1.1 研究对象
回顾性分析2014年9月至2015年9月于我院行前列腺MRI的患者,纳入标准:(1)患者检查序列完整,包括常规扫描序列和DTI;(2)患者MRI扫描后经穿刺活检证实为PCa或BPH,其中将肿瘤体积的70%位于TZ作为TZ-PCa的纳入标准[12],后根据Muller等[13]的研究将纳入的TZ-PCa患者分为GS≤3+4=7和GS≥4+3=7两组;(3)患者行MRI检查前,无前列腺穿刺活检史、无内分泌治疗或放疗等相关治疗史。排除MRI扫描有禁忌、扫描图像质量差及运动伪影重影响诊断者。经严格筛查,最终84例前列腺TZ有异常信号结节的患者纳入研究,其中BPH为30例,年龄58~81岁,平均(68.8±6.2)岁;TZ-PCa为54例,年龄52~88岁,平均(69.0±9.6)岁,其中合并外周带癌22例,肿瘤单发23例,多发31例。
1.2 检查方法
所有患者均采用德国Siemens 3.0 T Skyra MR扫描仪行前列腺T1WI、T2WI及DTI扫描;射频发射线圈采用体线圈,接收线圈为腹部32通道相控阵线圈。检查前,患者均适度充盈膀胱取仰卧位,以前列腺为扫描中心。扫描参数如下:(1)前列腺矢状面、冠状面及轴面均采用快速自旋回波T2WI (TSE-T2WI): TR 6874 ms,TE 104 ms,层厚3 mm,无间距扫描,FOV 180 mm×180 mm,激励次数2次,矩阵384×384。(2)前列腺轴面快速自旋回波T1WI (TSE-T1WI):TR 807 ms,TE 13 ms,层厚5 mm,无间距扫描,FOV 300 mm×350 mm,激励次数1次,矩阵286×320。(3) DTI采用前列腺轴面单次激发自旋平面回波成像(SE-EPI) TR 4900 ms,TE 89 ms,FOV 300 mm×240 mm,矩阵220× 240,层厚3.0 mm,无间距扫描,扩散敏感梯度方向数为20,回波链长度1,扩散加权系数b=800 s/mm2。所有序列总成像时间为9 min 54 s。
1.3 图像分析
将患者的所有扫描图像传输至西门子数据处理工作站Syngo VE40B,DTI扫描数据经Neuro 3D软件处理生成ADC图和FA图,根据病检提示及T2WI显示的异常信号灶对病灶进行定位,采用手动描绘法选取位于TZ的病灶的最大层面沿病灶边缘描绘ROI,但未超过病灶边缘,同时避开尿道、钙化、囊变坏死灶等,每个病灶测三次,取平均值。
1.4 统计学方法
2 结果
2.1 三组患者FA值和ADC值结果比较
经检验,所有数据均满足正态性(P>0.300);各组间ADC值及FA值均不满足方差齐性(P值分别为0.001和0.010),故采用Welch近似F检验分别进行3组间FA值及ADC值差异比较:3组患者中,BPH组的ADC值最高,FA值最低;GS≥4+3=7组的ADC值最低,FA值最高;3组间FA和ADC值差异均具有统计学意义(F=32.882, P=0.000; F=202.928, P=0.000)(表1)。后采用Dunnett T3检验分别进行组间两两比较:FA值结果显示,BPH与GS≤ 3+4=7、BPH与GS≥4+3=7组间差别有统计学意义(P=0.000, P=0.000),GS≤3+4=7与GS≥4+3=7组间差别无统计学意义(P=0.081);ADC值结果显示,BPH与GS≤3+4=7、BPH与GS≥4+3=7、GS≤3+4=7与GS≥4+3=7组间差别均有统计学意义(P值分别为0.000、0.000、0.040)(表2)。
2.2 移行带异常信号结节灶的影像表现
分别选取了一组移行带恶性结节(图1)和良性结节(图2)的T2WI、ADC图、FA图及相应病理图。从中可见,恶性结节在T2WI及ADC图上表现为较均匀的低信号,而良性结节在T2WI及ADC图上较恶性结节来说,信号稍高。
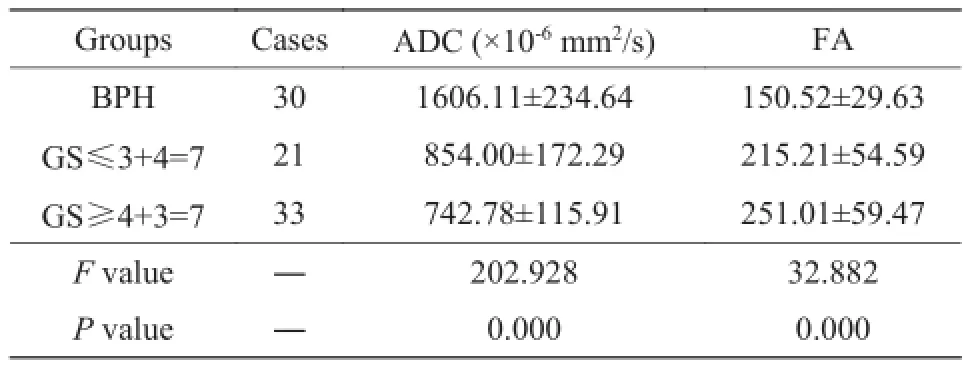
表1 三组患者的ADC、FA值差异Tab. 1 The difference of ADC and FA value in 3 groups
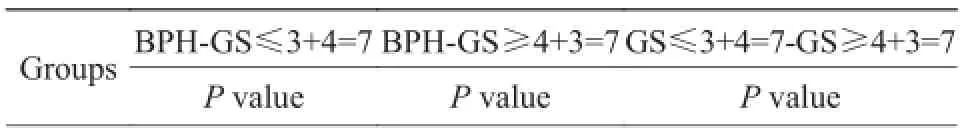
表2 三组患者的ADC值和FA值组间两两比较Tab. 2 The multiple comparison of ADC and FA values in inter-groups
3 讨论
3.1 三组患者FA值、ADC值差异分析
通常认为,ADC值代表水分子的弥散程度,且与肿瘤的生长和癌变组织的侵袭性有关[14]。经统计分析TZ-PCa的2组患者(GS≤3+4=7与GS≥4+3=7)的ADC值明显低于BPH组,这可能是由于肿瘤为短时间内单细胞克隆新生物,其内细胞核浆比增高,其外细胞排列紊乱,密集度增加,细胞外间隙降低从而使水分子运动扩散受限,相应的ADC值降低,这与Reischauer等[15]的研究相一致。而BPH组大多以腺体增生为主:腺体的增多,使腺液分泌增加,同时细胞排列疏松,水分子扩散自由,相应的ADC值较高;即使以基质增生为主的BPH,虽水分子扩散会受到一定的限制,但其程度远不如肿瘤组织明显,故其ADC值较肿瘤组织来说仍较高。Li等[16]有关前列腺外周带癌与Gleason评分的相关性研究中提出:肿瘤的ADC值与Gleason评分呈负相关,即Gleason评分越高其ADC值越低,但本研究未进行相关性分析,其理论是否同样适用于TZ-PCa,有待于进一步研究。其次,在进行组间两两比较时,GS≤3+4=7与GS≥4+3=7组间差异有统计学意义,这与以往学者的研究结果相似,即肿瘤组织无论在外周带还是移行带,其肿瘤特征相似,对水分子的自由扩散作用也相似,因此ADC在肿瘤位于TZ的高低危险度分级成为可能。
此外,DTI另一个重要参数FA值:是水分子各向异性成分占整个水分子扩散的比例,其取值范围为0~1,FA值越接近于1,说明该组织的扩散异性越大,而当FA>0.4时,通常认为其为全向组织结构[17]。本研究结果显示:TZ-PCa的2组患者FA值明显高于BPH组,其原因可能为肿瘤是局部恶性增殖,破坏了正常细胞间的连接,细胞的正常形态及排列消失,导致肿瘤内水分子自由扩散空间减小,水分子沿肿瘤生长方向的扩散明显增多,即各向异性增大,这与Gürses等[11]和Par等[17]在研究TZ-PCa的FA值(0.292±0.082、0.35± 0.11)相似。而BPH内虽有增生组织,但就其整体而言增殖与凋亡保持相对平衡,细胞正常排列,水分子各方向的自由扩散程度基本相等,即表现为各向同性,Par等[17]研究中BPH的FA值为0.24±0.05,其结果与本研究结果相似。GS≤3+4=7与GS≥4+3=7组间比较时,差异无统计学意义,这可能是因为FA值本身的不稳定从而造成差异不明显。目前,对于PCa的FA值仍存在争议,相较于正常组织来说,其可高[11,15,18]、可低[19]或无明显差异[15,18],其中原因可能来自于不同研究中所用仪器、受试人群情况及采用的扩散梯度方向个数、b值等不同造成,有待于进一步研究。
3.2 影响DTI诊断前列腺TZ疾病的因素分析
国内外不同文献对DTI在诊断前列腺TZ疾病价值方面的研究结果有所差异,笔者分析其影响因素主要表现在以下三个方面:(1)年龄:巩涛等[20]和李飞宇等[21]研究发现,ADC值和FA值在不同年龄段的正常成人前列腺PZ表现不同,与年龄具有相关性,随着年龄的增大,ADC值逐渐升高,FA值逐渐降低,而正常TZ是否也具有类似表现,目前还没有文献报道;张冬等[22]在进行前列腺组织IVIM-DWI与年龄相关性研究时发现,随年龄的增长,前列腺各区带的部分相关参数会发生改变,这可能与前列腺其本身组织结构随年龄增长而变化相关,故在进行患者筛选时也要考虑到年龄的因素,从而尽量避免年龄差异带来的影响。(2) b值的选取:b值是DTI的重要影响因素,其过小易受T2WI的影响,从而产生T2投射效应(T2 shine-through effect),所测值不能真实反映组织内水分子的扩散运动;b值过大,图像信噪比明显下降,易产生磁敏感伪影影响图像质量。智德波等[23]在DWI中不同b值的最优组合模型研究中发现不同b值分段具有不同最优拟合模型,多模型组合分析可为临床提供更精准的帮助;其他相关文献研究中b值的选取有300 s/mm2、500 s/mm2、700 s/mm2、800 s/mm2和1000 s/mm2等,本研究中权衡上述影响后选取b=800 s/mm2,其图像质量满足本研究要求。(3)扩散敏感梯度方向数;Kim等[24]研究不同扩散敏感梯度方向数对图像质量以及ADC值和FA值的影响,研究中12名正常成年男性分别接受扩散敏感梯度方向数为6、15、32的3次DTI扫描,结果发现,不同扩散敏感梯度方向数对图像质量没有明显影响,前列腺中央腺体区的ADC值和FA值差异也无统计学意义,但该研究的受试对象为正常人,而对于前列腺有疾病的患者,该研究结论是否支持还有待于进一步研究。此外,Reischauer等[15]研究发现,前列腺DTI扫描采用小FOV可以提高ADC值和FA值的准确性,从而为高分辨率DTI对提高前列腺疾病检出的准确性提供一种新方法。
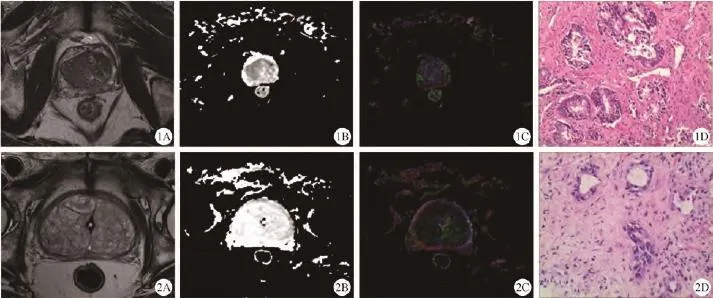
图1 移行带前列腺癌患者,74岁,PSA=19.018 ng/ml。A:T2WI,可见右侧移行带占位,呈均匀低信号;B:ADC图,可见右侧移行带区呈低信号;C:FA伪彩图;D:病理图,送检组织见癌细胞,Gleason评分为3+4=7分(HE ×200) 图2移行带前列腺增生患者,77岁,PSA=38.178 ng/ml;A:T2WI可见双侧移行带多发高低混杂信号结节灶;B:ADC图,可见双侧移行带区呈高信号;C:FA伪彩图;D:病理图。镜下见良性前列腺组织,局部可见慢性炎性细胞浸润(HE ×200)Fig. 1 TZ-PCa, 74 years old, PSA=19.018 ng/ml. A: T2WI, the right transition zone showed a homogeneous hypointense lesion. B: ADC map, showed low signal in the right transition zone. C: FA map. D: Pathology indicated: PCa, Gleason: 3+4=7 (HE ×200). Fig. 2 BPH, 77 years old, PSA=38.178 ng/ml. A: T2WI, the transition zone showed multi-nodules with mix signal. B: ADC map, showed high signal in transition zone. C: FA map. D: Pathology indicated: BPH and inflammatory cell infiltrations (HE ×200).
本研究存在以下不足:(1)未对位于PZ的PCa进行比较;(2) DTI参数较少,未将DTI与其他功能成像序列进行比较;(3)所有样本的GS评分均为穿刺活检后的评分,具有一定局限性;(4)分组应细化,且需增大样本量。
综上所述,DTI定量参数FA和ADC值在分析TZ良恶性结节方面具有参考价值,ADC值对恶性结节进一步分级能提供更大的帮助。参考文献 [References]
[1]McNeal JE. Regional morphology and pathology of the prostate. Am J Clin Pathol, 1968, 49(3): 347-357.
[2]Siegel R, Ma J, Zou Z, et al. Cancer statistics, 2014. CA Cancer J Clin, 2014, 64(1): 9-29.
[3]McNeal JE, Redwine EA, Freiha FS, et al. Zonal distribution of prostatic adenocarcinoma: correlation with histologic pattern and direction of spread. Am J Surg Pathol, 1988, 12(12): 897-906.
[4]Hoeks CM, Hambrock T, Yakar D, et al. Transition zone prostate cancer: detection and localization with 3-T multiparametric MR imaging. Radiology, 2013, 266(1): 207-217.
[5]Akin O, Sala E, Moskowitz CS, et al. Transition zone prostate cancers: features, detection, localization, and staging at endorectal MR imaging. Radiology, 2006, 239(3): 784-792.
[6]Donati OF, Mazaheri Y, Afaq A, et al. Prostate cancer aggressiveness: assessment with whole-lesion histogram analysis of the apparent diffusion coefficient. Radiology, 2014, 271(1): 143-152.
[7]Jung SI, Donati OF, Vargas HA, et al. Transition zone prostate cancer: incremental value of diffusion-weighted endorectal MR imaging in tumor detection and assessment of aggressiveness. Radiology, 2013, 269(2): 493-503.
[8]Oto A, Kayhan A, Jiang Y, et al. Prostate cancer: differentiation of central gland cancer from benign prostatic hyperplasia by using diffusion-weighted and dynamic contrast-enhanced MR imaging. Radiology, 2010, 257(3): 715-723.
[9]Li L, Margolis DJ, Deng M, et al. Correlation of gleason scores with magnetic resonance diffusion tensor imaging in peripheral zone prostate cancer. J Magn Reson Imaging, 2015, 42(2): 460-467.
[10]Gurses B, Kabakci N, Kovanlikaya A, et al. Diffusion tensor imaging of the normal prostate at 3 Tesla. Eur Radiol, 2008, 18(4): 716-721.
[11]Gürses B, Tasdelen N, Yencilek F, et al. Diagnostic utility of DTI in prostate cancer. Eur J Radiol, 2011, 79(2): 172-176.
[12]Bouye S, Potiron E, Puech P, et al. Transition zone and anterior stromal prostate cancers: zone of origin and intraprostatic patterns of spread at histopathology. Prostate, 2009, 69(1): 105-113.
[13]Muller BG, Shih JH, Sankineni S, et al. Prostate cancer: interobserver agreement and accuracy with the revised prostate imaging reporting and data system at multiparametric MR imaging. Radiology, 2015, 277(3): 741-750.
[14]Ren FC, Yang HF, Du Y. The application of multi-parametric MRI in the diagnosis of prostate cancer. Chin J Endourol (Elect Ed), 2013, 7(2): 148-151.任逢春, 杨汉丰, 杜勇. 多参数磁共振成像在前列腺癌诊断中的应用.中华腔镜泌尿外科杂志(电子版), 2013, 7(2): 148-151.
[15]Reischauer C, Wilm BJ, Froehlich JM, et al. High-resolution diffusion tensor imaging of prostate cancer using a reduced FOV technique. Eur J Radiol, 2011, 80(2): e34-41.
[16]Li L, Margolis DJ, Deng M, et al. Correlation of gleason scores with magnetic resonance diffusion tensor imaging in peripheral zone prostate cancer. J Magn Reson Imaging, 2015, 42(2): 460-467.
[17]Park SY, Kim CK, Park BK, et al. Diffusion-tensor MRI at 3 T: differentiation of central gland prostate cancer from benign prostatic hyperplasia. AJR Am J Roentgenol, 2014, 202(3): W254-262.
[18]Gibbs P, Pickles MD, Turnbull LW. Diffusion imaging of the prostate at 3.0 tesla. Invest Radiol, 2006, 41(2): 185-188.
[19]Manenti G, Carlani M, Mancino S, et al. Diffusion tensor magnetic resonance imaging of prostate cancer. Invest Radiol, 2007, 42(6): 412-419.
[20]Gong T, Hu N, Wang GB, et al. Age-related changes of prostate peripheral zone in normal adults: evaluation by DTI. J Pract Radiol, 2014, 30(1): 86-89, 142.巩涛, 胡娜, 王光彬, 等. 正常成人前列腺外周带DTI与年龄的相关性研究. 实用放射学杂志, 2014, 30(1): 86-89, 142.
[21]Li FY, Wang XY, Xu YF, et al. Age-related changes of prostate peripheral zone in healthy adults: evaluation by apparation diffusion coefficient. J Pract Radiol, 2006, 22(12): 1496-1499.李飞宇, 王霄英, 许玉峰, 等. 不同年龄段正常成人前列腺外周带ADC值的初步研究. 实用放射学杂志, 2006, 22(12): 1496-1499.
[22]Zhang D, Wu T, Shi CZ, et al. The reproducibility of IVIMDWI in normal prostate and age-related analysis. Chin J Magn Reson Imaging, 2015(11): 848-854.张冬, 吴婷, 史长征, 等. 正常前列腺组织IVIM-DWI的可重现性研究及年龄相关性分析. 磁共振成像, 2015(11): 848-854.
[23]Zhi DB, Qiu BS. A study on the best fitting model for diffusionweighted magnetic resonance imaging of normal prostate tissue at different b-values. Chin J Magn Reson Imaging, 2015(8): 631-635.智德波, 邱本胜. 正常前列腺组织磁共振弥散加权成像在不同b值下的最优拟合模型研究. 磁共振成像, 2015(8): 631-635.
[24]Kim CK, Jang SM, Park BK. Diffusion tensor imaging of normal prostate at 3 T: effect of number of diffusion-encoding directions on quantitation and image quality. Br J Radiol, 2012, 85(1015): e279-283.
Feasibility study of FA and ADC values by diffusion tensor imaging: classify abnormal signal nodules in prostate transition zone
KE Zan, WANG Liang*, DENG Ming, MIN Xiang-de, CAI Jie, FENG Zhao-yan, LI Ba-sen
Department of Radiology, Tongji Hospital of Tongji Medical College, Huazhong University of Science and Technology, Wuhan 430030, China
Objective:To investigate the diagnostic utility of FA (fractional anisotropy) and ADC (apparent diffusion coefficient) values of diffusion tensor imaging (DTI) in classifying abnormal signal nodules in prostate transition zone (TZ).Materials and Methods:Fifty-four TZ-PCa cases and thirty BPH cases with pathologically confirmed were enrolled in this retrospective study. All the patients were divided into 3 groups: BPH, Gleason score (GS)≤3+4=7, GS≥4+3=7, and underwent with 3.0 T MRI. The FA and ADC values of the region of interest (ROI) were respectively measured, using one-way ANOVA to compare the difference between groups. Results: The mean FA values of the 3 groups were 150.52±29.63, 215.21±54.59, 251.01±59.47, respectively, and there was statistical difference between the groups (F=32.882, P=0.000). Comparison among groups: just BPH with the other two groups had statistical difference (P=0.000, P=0.000). The mean ADC values (×10–6mm2/s) of the 3 groups were 1606.11±234.64, 854.00±172.29, 742.78±115.91, respectively, and there was statistical difference between the groups (F=202.928, P=0.000). Comparison among groups: BPH with the other two groups had statisticaldifference (P=0.000, P=0.000). GS≤3+4=7 and GS≥4+3=7 had statistical difference (P=0.040). Conclusions: The FA and ADC values of DTI have higher value for distinguishing benign and malignant nodules. ADC values has obvious advantages than FA in the further classification.
Prostatic neoplasms; Diffusion tensor imaging
国家自然科学基金面上项目(编号:81171307)
华中科技大学同济医学院附属同济医院放射科,武汉 430030
王良,E-mail: wang6@tjh.tjmu.edu.cn
2016-01-27
接受日期:2016-03-28
R445.2;R697.3
A
10.12015/issn.1674-8034.2016.05.003
可赞, 王良, 邓明, 等. MR扩散张量成像定量参数FA和ADC值在前列腺移行带结节良恶性分级中的应用价值. 磁共振成像, 2016, 7(5): 332–336.
*Correspondence to: Wang L, E-mail: wang6@tjh.tjmu.edu.cn
猜你喜欢
科教新报(2021年11期)2021-05-12
中国生殖健康(2020年8期)2021-01-18
中华养生保健(2020年5期)2020-11-16
中学生数理化·七年级数学人教版(2019年6期)2019-06-25
中国生殖健康(2018年3期)2018-11-06
特别健康(2018年3期)2018-07-04
家庭百事通·健康一点通(2018年4期)2018-05-16
中华皮肤科杂志(2018年4期)2018-01-22
China Geology(2018年3期)2018-01-13
意林原创版(2017年11期)2017-12-01