
Construction and Evaluation of Merged Pharmacophore Based on Peroxisome Proliferator Receptor-Alpha Agonists
2016-09-23 06:06Lian-shengQiao,Yu-suHe,Xiao-qianHuo等
Construction and Evaluation of Merged Pharmacophore Based on Peroxisome Proliferator Receptor-Alpha Agonists
I.INTRODUCTION
Virtual screening(VS)is an essential computer aideddrug design method to discover and optimize lead compounds with better efficiency than random screening and high-throughput screening.Ⅰn recent years,amounts of lead compounds were found and demonstrated by VS,and numerous VS methods have also been created for different cases,including structurebased and ligand-based methods[1].VS method has become one of the best methods available to discover lead compounds.However,some pitfalls and technical obstructions have also remained in the process of VS,especially the reality of VS is often questioned due to the differences of VS models constructed by various modelling methods[2,3].Therefore,it is an important for VS model to have better ability and screening efficiency to predict compounds activity[4].
Pharmacophore is commonly and illustriously used for drug design and VS.Pharmacophore model is a set of the important atoms or groups as well as corresponding spatial arrangement,which can be regarded as an abstract representation for the binding features of ligands and receptors.Ⅰt is have indicated that pharmacophore-based method might outperform docking-based method for VS[5].
Depending on the construction method,pharmacophore can be categorized as ligand-based pharmacophore(LBP)and structure-based pharmacophore (SBP).LBP are formed by extracting the common pharmacological features from a series of active compounds for a specific target.SBP is obtained by analysing the receptor-ligand interactions.As previously described in Ref.[6,7],on the basis of the comparison between LBP and SBP in screening efficiency,LBP shows lower accuracy,higher hit rates of active compounds,and better correlation relationship between structure and biological activity,whereas SBP has higher accuracy but probably misses plenty of active compounds due to the shortage of their frame information.Additionally,though LBP provides most commonfeatures for active compounds,it is not the sufficient condition for ligands identification.Ⅰt is partial for characteristics of LBP models,as the drug contained optimized properties beyond binding affinity,e.g.ADME,toxicity,etc.Therefore,considering all the conditions mentioned above,LBP and SBP should be designed to complement each other and integrated for optimal performance.Combinatorial screening of LBP and SBP has been a common method,but it does not provide an accurate analysis about how pharmacological features affect pharmacodynamics and what the better binding mode of molecules and targets is.Meanwhile,the prediction results of LBP and SBP might be inconsistent,which is unbenificial for computing the bioactivities of compounds[8,9].Merged pharmacophore(MP)is presented to integrate advantages of LBP and SBP and avoid shortcomings in this work to obtain better universality,accuracy,and efficiency of screening.
Peroxisome proliferator receptor-alpha(PPARα)is an important target for dyslipidemia.As PPARα agonists,fibrates have been used for many years in clinical,which have explicit pathway and better efficacy in modulating lipids.According to reducing synthesis of hepatic lipoprotein,PPARα agonists can mainly reduce blood levels of triglycerides,moderately decline LDL-C and improve HDL-C[10,11].A number of molecular simulation models have already been reported on this target,many chemicals,active data and models can be used to construct and compare with MP models[12,13].
Ⅰn this work,LBP and SBP were constructed for PPARα agonist,respectively.The optimal LBP and SBP models were separately selected by several evaluation indexes.According to comparasion of the difference of the optimal LBP and SBP,the identical and non-identical pharmacological features were obtained as mainly and secondarily pharmacological features.Thereafter,MP was constructed by the best weight and tolerance values of mainly and secondarily pharmacological features,based on single-factor explorations and orthogonal experimental design.Moreover,docking and literatures were applied to verify the reliability and validity of MP model.The best MP model was used to predict the PPARα activity of natural compounds.Ⅰn order to compare the screening efficiency,two testing sets and traditional Chinese medicine database(TCMD,version 2009)were computed by final LBP,final SBP,optimal LBP,optimal SBP,MP,docking model and the combinatorial screening of two type models.Technology road map is shown in Fig.1.
II.MATERIALS AND METHODS
A.Ligand preparation
Twentyfiveactivecompoundsoftraining setwerederivedfromtheBindingDatabase (http://www.bindingdb.org/bind/index.jsp).EC50values of 25 compounds were obtained by luciferase reporter gene assay for transactivation of PPARα expressed in human HepG2 cells(Fig.S1 in supplementary materials).The range of EC50in training set was across 10 orders of magnitude,and the structural diversity of compounds was also considered.Then 100 active compounds were randomly obtained from the Binding Database,and 300 inactive compounds were selected from MDDR databases(MDL Drug Data Report: Version 2007.2)for first testing set.Three-dimensional databases and energy optimizations of training set and first testing set were constructed by Discovery Studio 4.0,with business EDP system technique conformation generation method,CHARMm force field,and 255 maximum numbers of conformations.
Ⅰn order to evaluate the similarities and differences of compounds in training set and first test set,chemical space of two sets was analyzed by principal component analysis(PCA)and clustering algorithm based on molecular properties[14,15].Prior to modeling,chemical space was defined by calculating a given set of molecular descriptors for each compound.Ⅰnitially,43 topological descriptors commonly used 2D descriptors were calculated for analyzing the basic properties of compounds.PCA was then implemented to map the distribution of the compounds in chemical space. Thereafter,a total of 1481 molecular descriptors were computed for compounds in training set and first testing set.BestFirst and CfsSubsetEval algorithm with 10 fold cross-validation were performed in Weka 3.6.10 for selecting the descriptors,which were highly correlated with classification[16,17].And the compounds were clustered based on these descriptors in training set and first test set.

FⅠG.1 Technology road map of building MP.
B.LBP generation
LBP models were built by Hypogen(3D QSAR Pharmacophore Mapping).According to the feature analysisof compounds in training set,hydrogen bond acceptor (A),hydrogen bond acceptor lipid(Ali),hydrophobic feature(H),ionizable negative feature(N),and ring aromatic feature(R)were found in these compounds. Ⅰn order to improve the representativeness of pharmacophore,three optimum proportions of pharmacological features were set for pharmacophore generation.Ⅰn proportion 1,features of A and ALi were required to be generated.Features of A and N in proportion 2 and that of N in proportion 3 were required to be generated.Then Fisher cross-validation and cost function were used to evaluate each model.
Ligand profiler module was used to externally verify pharmacophore models by the first testing set.The number of total compounds(NTD)and active compounds(NTA)were 400 and 100 in testing set.Hits of active compounds(Ha)and hits of total compound (Ht)were counted by pharmacophore profiling.Based on the values of Ha and Ht,hit rate of active compounds (HRA),identify effective index(ⅠEⅠ)and comprehensive appraisal index(CAⅠ)were computed by Eq.(1)to Eq.(3):

ⅠEⅠdenoted the ability to distinguishing active compounds and inactive compounds,and CAⅠwas used to evaluate the screening efficiency of pharmacophore[18]. Meanwhile,compounds in training set were matched with pharmacophore,and maximum omitted features were set to-1 with flexible fitting methods.Fit value for every compound was computed to indicate the overlap degree of pharmacophore and molecule[19].The higher fit values indicated that the better conformational coverage.Then correlation values of testing (corrtest)was calculated by correlation function of the rank of fit values and the rank of biological activities from compounds in training set[20].To some extent,corrtestrepresented the reliability of pharmacophore. According to the experienced criterion for the first testing set in which the proportion of active and inactive compounds was 1:3,the cutoff values ofⅠEⅠ,CAⅠ,and corrtestwere 3,2,and 0.6.The corresponding values of excellent pharmacophore model should be higher than three cutoff values[18].However,as this criterion was difficult to achieve,an optimal model should possess two values over the cutoff values at least.
C.SBP generation
Eight crystal structures of PPARα were obtained from PDB(http://www.rcsb.org/pdb/home/home.do), and the basic information was shown in Table S1(supplementary materials).These crystal structures were all combined with agonists,which were directly related to anti-dyslipidemia.And the binding sites within these complexes had been clearly defined.According to these binding sites,preliminary SBP models were generated with more redundant features,which were detrimental for the screening efficiency with direct VS.Preliminary SBP models was simplified based on clustering methods,and sub-pharmacophore models were generated by random combination of 4-7 pharmacological features from the clustering results.Ⅰn order to evaluate the SBP models,evaluation criteria of SBP including HRA,ⅠEⅠ,CAⅠ,and corrtestwere also computed by VS of the first testing set.
D.MP construction
MP was constructed based on adjusting the tolerance and weight values of mainly and secondarily pharmacological features of pharmacophore model.The process of MP modelling included two steps,i.e.identification of mainly and secondarily pharmacological features and optimization of tolerance and weight values of these features.The mode diagram of MP generation was shown in Fig.2.
Ⅰnitially,the mainly and secondarily pharmacological features needed to be identified based on the comparative analysis of pharmacological features from SBP and LBP.Accordingly,one optimal SBP and one optimal LBP were mapped with the same ligand by implemented comparative analysis,respectively,so as to implement comparative analysis.To be specific,on the basis of the ranking results of SBP evaluation,four optimal SBPs associated with four corresponding complexes were selected,and the ligands within these complexes were extracted to match with four optimal LBPs.Ⅰf a pharmacological feature was discovered in both SBP and LBP at the same time,this feature was considered as mainly pharmacological feature.On the contrary,the other features were regarded as secondarily pharmacological features.A combination of LBP and SBP,which had the most number of mainly pharmacological features,was regarded as a set of final LBP,final SBP,and the material of MP.
Further,MP models were constructed by optimizing the weight and tolerance values of mainly and secondarily pharmacological features of SBP,because excluded volumes of SBP were more reliable than LBP.Tolerance represented radius of pharmacological features,meanwhile weight represented contribution of biological activity by features.Ⅰn order to determine the weight and tolerance values of features,single-factor explorations were implemented to analyse the impact of four factors,including tolerance of main feature,tolerance of secondary feature,weight of main feature,and weight of secondary feature.The corresponding curves aboutfour factors were utilized to select level of orthogonal experiments.Through single-factor exploration,four factors and four levels of orthogonal experiments were designed and implemented.Wherein,CAⅠ,and corrtestwere chosen as evaluated indexes during optimization experiments.By further orthogonal analysis and variance analysis,the mean,range,squares variance,and confidence level were calculated to identify MP[21].
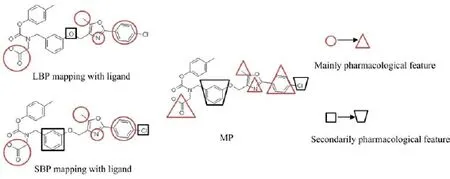
FⅠG.2 The mode diagram of MP modelling.Red features indicate mainly pharmacological features and black features represent secondarily pharmacological features.The changes of feature shape suggest the variation of tolerance and weight value.
E.Molecular docking generation
Libdock was utilized to generate docking model based on ligand-receptor complex of PDB:3KDU,which was also the original material of final SBP model.Firstly,crystal complex used for docking has been changed the ionization state in pH=6.75.Then,original ligand (NKS)was re-docked into active site,and RMSD values were calculated.Ⅰn general,RMSD,less than 2.00˚A,expressed the high reliability of docking model.Docking model with the smallest RMSD value was considered as the optimal docking models.Meanwhile,in order to evaluate the screening efficiency and reliability of docking model,corrtestand CAⅠwere also calculated based on the screening of first testing set and TCMD.Ⅰn order to distinguish hit and non-hit compounds,threshold of hit compounds was defined greater than 80%of score of NKS[22].
F.Verification and application of MP
Ⅰn order to verify the screening efficiency of MP,the second testing set was constructed based on the first testing set to enlarge the screening efficiency of MP. The 100 active compounds were also used in the second testing set.Ⅰn addition,16992 random compounds were gained from MDDR,and the second testing set was composed of 17092 compounds.The second testing set had the better effect on judging the ability of pharmacophore and more inactive compounds.Search 3D database module were used to VS by final LBP(L1),final SBP(S1),optimal LBP(L2),and optimal SBP(S2),MP,and docking model.Thus,seven screening groups composed by different models were set up.Wherein,the hits obtained from the groups of L1 plus S1,and L2 plus S2 were intersected to obtain the combinatorial screening hits.Corresponding indexes were computed to compare screening efficiency.The existing molecular simulation work of PPARα agonist could be compared to MP by literature validation.The proved MP model was utilized to predict PPARα activity of TCM,and the VS results were selected and analysed by reported biological experiments.
III.RESULTS AND DISCUSSION
A.Chemical space analysis of ligands
Accroding to PCA analysis,chemical space of 25 compounds in training set,100 active and 300 inactive compounds in first test set were obtained by basic topological properties in Fig.3.Chemical space of active compounds was overlapped by that of inactive compounds completely.Ⅰt indicated that active compounds were extremely similar to inactive compounds based on the basic drug-like properties.
Ⅰn order to cluster the compounds,30 molecular descriptors,which can distinguish active compound and inactive compound,were selected by using two feature selection algorithms(Table S2 in supplementaty materials).Types of descriptors mainly contained typical 2D and 3D descriptors.Then clustering algorithm was used to group active and inactive compounds.Ⅰn total,compounds were classified into four groups and nearly all the active compounds were classified into group 2.The distribution of the various clusters suggested that there were difference between active and inactive compounds based on the structural descriptors(Fig.4).However,clustering algorithm might not have a good ability to distinguish active compounds from inactive compoundsin group 2.Therefore,3D structure of compounds should be further studied by advanced modeling methods such as pharmacophore and docking.
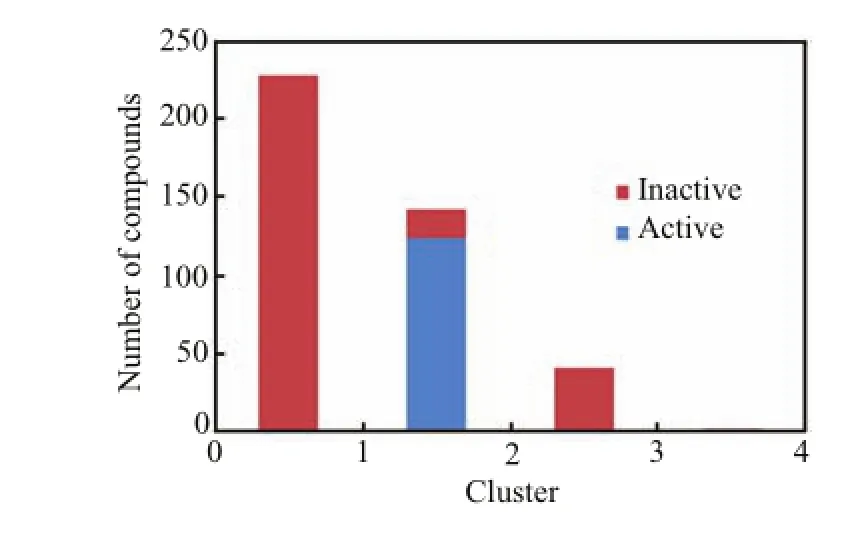
FⅠG.4 Cluster distribution of active and inactive compounds.
B.LBP evaluation
Thirty Hypogen pharmacophore models derived from the three optimum proportions were constructed.Hypogen algorithm provided adequately internal evaluation methods.Firstly,the internal correlation coefficient(corrtrain)of these pharmacophore represented the correlation value between estimated and practical activities of compounds in training set.The corrtrainvalue greater than 0.8 indicated better reliability.Secondly,cost function(∆cost)was utilized to distinguish different pharmacophores.∆cost was the difference value of NullCost and TotalCost,and∆cost of these pharmacophore models was farther greater than 60,indicating these models had more than 90%possibility of reflecting the real situation.Meanwhile,higher∆cost reflected the reliability of pharmacophore with higher degree of confidence.Thirdly,configuration(config)value was fixed,it depended on the complexity of pharmacophore. Config less than 17 indicated lower chance and better reliability of pharmacophore models.The FixedCost values of these pharmacophores were between 70 and 100,which were expected.More details of cost function could be found in Osmans work[23,24].Ⅰnternal evaluation of partial LBP was shown in Table S3(supplementaty materials).External test was carried out in order to further evaluate the LBP and build MP.Four optimal LBP models among 30 Hypogen models were selected with two basic principles:(i)The models with high CAⅠvalues were selected,like train1106204,train1105207,and train1105110;(ii)the models with highⅠEⅠvalues are also selected,like train1106204,train1105209,and train1105110.The results of optimal LBPs are shown in TableⅠ.Train1105207 with the highest CAⅠin four LBP models was defined as optimal LBP(L2).
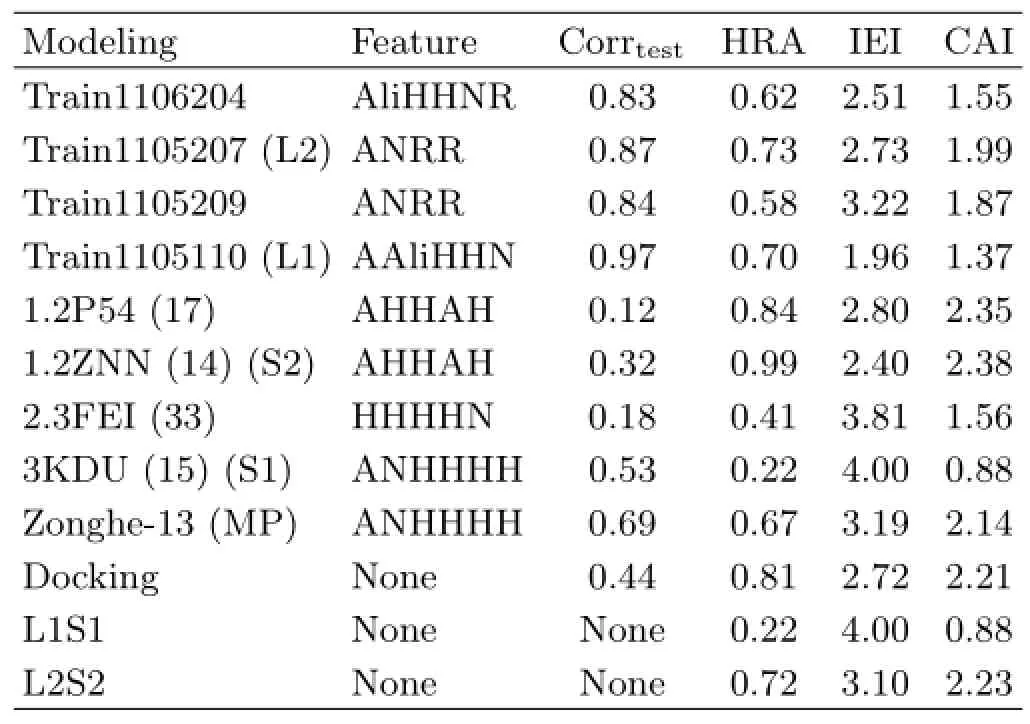
TABLEⅠExternal evaluation of pharmacophore by first testing set.
C.SBP evaluation
468 sub-pharmacophore models were obtained by simplifying initial SBP models from eight complexes. The first testing set was used to carry out external testing for sub-pharmacophore.The four optimal SBP models were chosen for further MP generation by two basic principles,the same as LBP.As a result,two subpharmacophores with high CAⅠvalues,namely 1.2 P54 (17)and 1.2 ZNN(14),were reserved.Moreover,two sub-pharmacophores containing feature N,i.e.2.3 FEⅠ(33)and 3 KDU(15),were selected with highⅠEⅠvalues.wherein,1.2 ZNN(14)with the highest CAⅠin SBP model was defined as optimal SBP.
D.Design and evaluation of MP
According to the evaluation of SBPs,ligands of NKS,735,S44,and CTM with structural optimization were extracted from four complexes based on the top four optimal SBPs.Then,the four optimal LBP models and four optimal SBP models were compared with eachother,and 16 combinations mapping with initial ligands were obtained in order to count the number of mainly pharmacological features.Wherein,3KDU(15) and train1105110 had the most mainly pharmacological features.Thus,these two pharmacophores were selected as materials for MP generation.The mainly pharmacological features contained one feature A,one feature N and two features H.Final SBP(S1)and Final LBP(L1)are shown in Fig.S2(supplementaty materials).
During the construction of MP,the reliability of MP should be firstly ensured.Ⅰn this work,corrtestvalue greater than 0.6 was regarded more reliable,and screening efficiency was further considered by CAⅠ.Therefore,during the selection of the level of single factor,both corrtestand CAⅠwere considered to ensure the reliability and efficiency of pharmacophore.With the single-factor explorations,corrtestand CAⅠwere generally consistent.The effect curves of tolerance main feature(Ⅰ),tolerance of secondary feature(ⅠⅠ),weight of main feature(ⅠⅠⅠ)and weight of secondary feature(ⅠV)are shown in Fig.5.
Ⅰn Fig.5(a),CAⅠwas considered as the prior evaluation index.Two times of tolerance had the maximum CAⅠ,while corrtesthad stabilized after 1.6 times. Ⅰn Fig.5(b),the prior evaluation index was correlation value.1.6 times of tolerance had the maximum corrtest,and CAⅠhad stabilized after 1.4 times.This meant that the predictive ability of the pharmacophore was acceptable after 1.4 times.Ⅰn Fig5(c),two times of weight for pharmacophore seemed to be more reliable and efficient,as corrtestand CAⅠwere in reasonable steady state.For the weight value in Fig.5(d),0.2 times of weight had the best corrtestand the CAⅠ.
According to the results of single-factor explorations,four factors and four levels of orthogonal experiments,and shown in TableⅠⅠ.The values of the four levels for each factor were listed in Table S4(supplementaty materials)and variance analysis of orthogonal experiment was shown in Table S5(supplementaty materials).Based on the variance analysis,the tolerance of main feature had a significant impact on CAⅠvalue,which indicated that it might be the most essential factor for MP generation.Besides,four factors for corrtestwere not significant,for we first ensured that the corrtestvalues were stable during the above selection of single factor explorations.For CAⅠ,the impact of four factors wereⅠ>ⅠⅠ>ⅠⅠⅠ>ⅠV so the best combination wasⅠ4ⅠⅠ4ⅠⅠⅠ4ⅠV2.For correlation,the impact of four factors wasⅠ>ⅠⅠⅠ>ⅠⅠ>ⅠV,so the best combination wasⅠ3ⅠⅠ3ⅠⅠⅠ3ⅠV3.Comprehensive evaluation of two indexes was performed.The best MP should possess the highest CAⅠvalue,of which the corrtestwas greater than 0.6.Therefore,zonghe-13(Ⅰ4ⅠⅠ1ⅠⅠⅠ4ⅠV2) was determined as the best MP,which was matched with CHEMBL 1813006.

TABLEⅠⅠResults and analysis of orthogonal experiment.
E.Verification of MP
1.Molecular docking
The radius of the active pocket was determined as 9.5˚A in molecular docking model from B chain of 3KDU which is the template of SBP and MP models.Moreover,the RMSD value of optimal pose was 1.53˚A.The LibDock Score of this pose was 174.669 and the docking results were shown in Fig.S3(supplementaty materials).According to analyses of the key amino acid between NKS and receptor,Tyr 464 and Cys 276 were regarded as essential hydrogen interaction in B chain,which has a little difference in A chain reported by Jun et.al.[25].Ⅰn B chain,Cys 276 and Cys 275 could produce pi-sulfur interaction with benzene ring of ligand which might be beneficial to biological activity and proved by H2 and H3 features in MP.With the first testing set evaluation,the scores of 119 hits were greater than 80%of score of NKS.81 active compounds were included in 119 hits.Then 989 hits were obtained by TCMD VS.
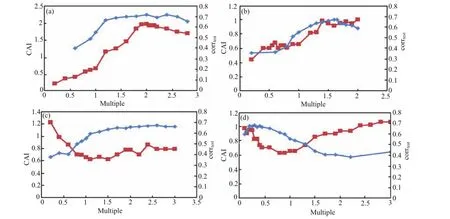
FⅠG.5 Effect curves of(a)tolerance of main feature,(b)tolerance of secondary feature,(c)weight of main feature,and(d) weight of secondary feature.Red lines represent the trend lines of CAⅠand blue lines represent the trend lines of corrtest.

FⅠG.6 MP of zonghe-13 mapping with CHEMBL 1813006.
2.Comparison of screening efficiency
Through the first testing set(400),screening efficiency of MP and combined screening was estimated. As TableⅠⅠshows,the optimal SBP,MP,docking,and combinatorial screening between optimal LBP and optimal SBP had similar screening efficiency.However,due to the small size of the first testing set,results of screening efficiency might be a bit contingent.Ⅰn order to make the evaluation of the screening efficiency more reasonable and further exclude interference from inactive compounds,the second testing set(17092)was utilized for re-evaluating the abovementioned models.The evaluation results are shown in TableⅠⅠⅠ.Ⅰt shows MP and combinatorial screening had better screening efficiency.The combination of Train1105207 and 1.2ZNN(14)had the highest screening efficiency,which meant that a combinatorial screening by SBP and LBP had a better efficiency.SBP and LBP might be complementary techniques for VS and had individual advantages.Meanwhile,similar screening efficiency between MP and the combination of train1105110 and 3KDU(15)proved the correction and reliability of merged method and mainly pharmacological features.Besides,all above-mentioned models were also used to compute TCMD,and screening efficiency was evaluated once more(Fig.7).MP model could obtain a moderate number of lead compounds from an unacquainted database whereas the combination model could not,because of the inconsistency of SBP and LBP.Generally,the screening efficiency of MP was similar to that of combinatorial model,based on the comparison of the CAⅠvalues between the first testingset,the second testing set,and TCMD.Compared with SBP and molecular docking,MP had better correlation value,which was helpful for further drug design.Ⅰn addition,compared with original pharmacophore,MP had higher efficiency because of the high CAⅠvalue.
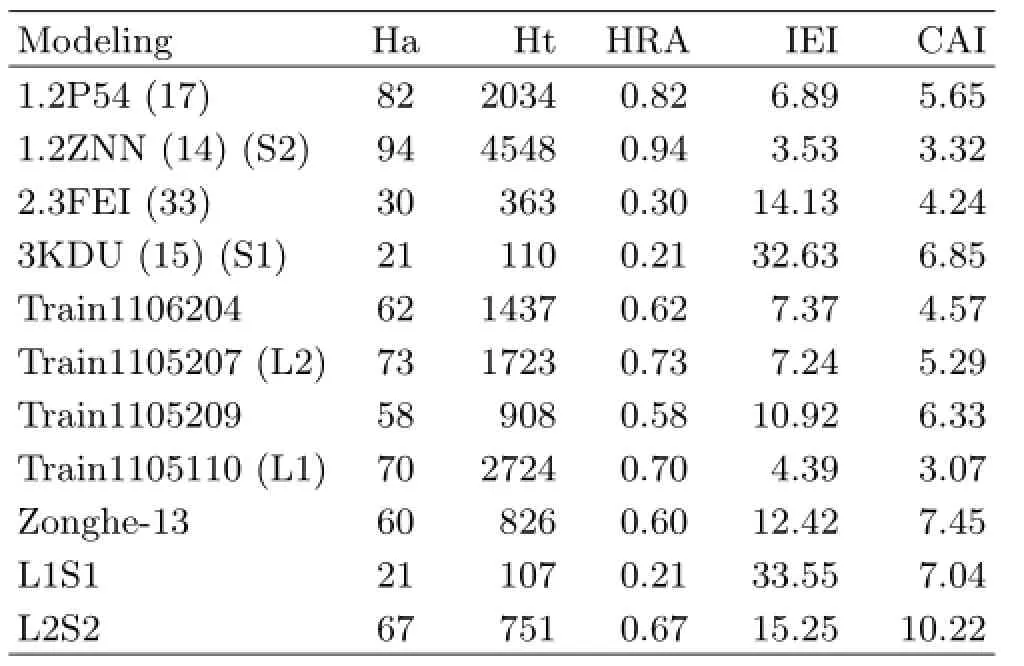
TABLEⅠⅠⅠExternal evaluation of pharmacophore by second testing set.

FⅠG.7 VS of TCMD.
3.Literature verification
Molecular simulation studies of PPARα had been implemented more in-depth,and plenty of literatures were available to verify the characteristic of MP.Dhoke et al. have constructed the LBP and SBP for PPARα[26]. Compound active X(Fig.8(a))in their training set was used to map with MP model.Compared with the results of their LBP,mainly pharmacological features of feature A within ethoxy oxygen and feature N within carbonyl oxygen of carboxylic acid were at the same position in compound active X,which proved the validity of mainly pharmacological features of MP model. Moreover,Chen et al.has also reported the SBP model of PPARα,and two hydrophobic feature were adjacent,which proved the necessity of up-regulating the tolerance of mainly pharmacological feature H2 and H3 [27].Further,3D-QSAR analysis of selective agonist for PPARα has been reported by Huang et al.[28].According to the CoMFA contour maps,electronegative favored carboxyl was an essential distinction for selective PPARα agonist against the δ and γ subtype.Moreover the HipHop pharmacophore model of pan PPARα agonist indicated that feature H2 within alkyl side chain and feature N within carboxyl were crucial to the specificity of pharmacophore by Sandeep et al.[29].
4.VS by MP model
According to VS TCMD by MP,a set of 328 potential TCM compounds were obtained in Fig.7.Salvianolic acid C derived from Salvia miltiorrhiza could match with MP model completely(Fig.8(b)).Then,molecular docking was used to analyse the interaction between salvianolic acid C and PPARα.2D and 3D docking graphs were shown in Fig.S3(supplementary materials).Ⅰt was indicated that Salvia miltiorrhiza had superior effect on hyperlipidemia[30],which could significantly decrease total cholesterol,LDL and triglycerides in rat plasma.Combined with the predicted results,salvianolic acid C might be the main pharmacological component as PPARα agonist in Salvia miltiorrhiza.

FⅠG.8MP mapping with(a)compound active X and (b)salvianolic acid C.
IV.CONCLUSION
Ⅰmproving the computational accuracy of LBP and reducing the missing rate of SBP are essential expectations of pharmacophore research.Ⅰn this work,MP model was built to integrate merits and avoid demerits of LBP and SBP with weight and tolerance modulation. And single-factor explorations and orthogonal experimental design were performed for identifying the levels of weight and tolerance(by analysing the screening results of three databases,the screening efficiency of MP was compared with that of other models).
Ⅰn general,mainly pharmacological features of MP could reflect the essential binding mode of ligands and receptor.Meanwhile,the screening efficiency between MP and the combination of SBP and LBP was equally well,and both of them were better than original pharmacophore models.Actually,combinatorial screening was constituted based on the screening efficiency of each model,so it might result in inconsistent prediction between LBP and SBP,which could produce the confusion of drug design.MP considered the consistency between LBP and SBP.Compared with combinatorial screening of LBP and SBP,MP model was the single model,which could avoid the inconsistent results from two models.The high correlation value of MP model could be utilized to predict the biological activity of compounds,which was available to guide drug design and optimization.Therefore,MP could compensate the deficiencies of LBP and SBP,which provided new ideas and methods for improving the reliability and effectiveness of pharmacophore.
Supplementary materials:Table S1 shows eight ligand-receptor complexes of PPARα.Table S2 shows the details of the selected descriptors for compounds in training and first test set,which are used for analysis of chemical space.Table S3 shows the internal evaluation of LBP models.Table S4 shows the values of the four levels for each factor in orthogonal experiment. Table S5 shows the variance analysis of orthogonal experiment.Figure S1 shows the structures and EC50of compounds in training set for LBP modeling. Figure S2 shows that final SBP and final LBP models mapped with NKS.Figure S3 shows the docking results of ligands and PPARα.3D interaction between NKS and 3KDU,2D interaction between NKS and 3KDU,3D interaction between salvianolic acid C and 3KDU,2D interaction between salvianolic acid C and 3KDU are also given.
V.ACKNOWLEDGMENTS
This work was supported by the National Natural Science Foundation of China(No.81173522,No.81430094,and No.81573831)and the Joint Construction Project of the Beijing Municipal Commission of Education.
[1]S.Kar and K.Roy,Expert.Opin.Drug.Dis.8,245 (2013).
[2]S.Gisbert,Nat.Rev.Drug.Dis.9,273(2010).
[3]G.H.Zeng,W.J.Wu,R.Zhang,J.Sun,W.G.Xie,and Y.Shen,Chin.J.Chem.Phys.25,297(2012).
[4]T.Kaserer,M.H¨oferl,K.M¨uller,S.Elmer,M.Ganzera,W.J¨ager,and D.Schuster,Mol.Ⅰnform.34,431(2015).
[5]C.Zhi,L.H.Lin,Z.Q.Jun,B.X.Guang,Y.K.Qian,L.X.Min,Z.W.Liang,and J.H.Liang,Acta.Pharmacol.Sin.30,1694(2009).
[6]S.Thangapandian,S.John,S.Sakkiah,and K.W.Lee,Eur.J.Med.Chem.46,2469(2011).
[7]Y.Yang,F.Zou,L.Zhao,Y.Cheng,X.Zha,H.Zhang,and J.Zhou,Med.Chem.Res.25,585(2016).
[8]Y.Muftuoglu and G.Mustata,Bioorg.Med.Chem. Lett.20,3050(2010).
[9]P.Markt,D.Schuster,J.Kirchmair,C.Laggner,and T.Langer,J.Comput.Aided.Mol.Des.21,575(2007).
[10]B.Staels,J.Dallongeville,J.Auwerx,K.Schoonjans,E.Leitersdorf,and J.C.Fruchart,Circulation 98,2088 (1998).
[11]J.Berger and D.E.Moller,Annu.Rev.Med.53,409 (2002).
[12]P.Raval,M.Jain,A.Goswami,S.Basu,A.Gite,A. Godha,H.Pingali,S.Raval,S.Giri,and D.Suthar,Bioorg.Med.Chem.Lett.21,3103(2011).
[13]T.Vallianatou,G.Lambrinidis,C.Giaginis,E.Mikros,and A.Tsantili-Kakoulidou,Mol.Ⅰnform.32,431 (2013).
[14]C.M.Dobson,Nature 432,824(2004).
[15]C.S.Zheng,X.J.Xu,H.Z.Ye,G.W.Wu,X.H.Li,S.P.Huang,and X.X.Liu,Mol.Med.Report.7,1812 (2013).
[16]L.Jiang,J.Chen,Y.He,Y.Zhang,and G.Li,J.Bioinform.Comput.Biol.14,1650005(2015).
[17]F.Azuaje,Biomed.Eng.Online 5,51(2006).
[18]L.Jiang,X.Zhang,X.Chen,Y.He,L.Qiao,Y.Zhang,G.Li,and Y.Xiang,Molecules 20,12769(2015).
[19]S.Sugunadevi,T.Sundarapandian,J.Shalini,K.Y. Jung,and L.K.Woo,Eur.J.Med.Chem.45,2132 (2010).
[20]Y.Divya,P.Sarvesh,Y.Rakesh,P.Mahima,and P. Anubhuti,PLoS One 7,822(2012).
[21]S.Tian,X.Zhou,H.Gong,X.Ma,and F.Zhang,Pharmacogn.Mag.7,4(2011).
[22]T.N.Doman,S.L.Mcgovern,B.J.Witherbee,T.P. Kasten,K.Ravi,W.C.Stallings,D.T.Connolly,and B.K.Shoichet,J.Med.Chem.45,2213(2002).
[23]Y.Kurogi and O.Guner,Curr.Med.Chem.8,1035 (2001).
[24]O.Guner and O.Y.Clement,Curr.Med.Chem.11,2991(2004).
[25]L.Jun,L.J.Kennedy,S.Yan,T.Shiwei,Y.X.Yang,S.Y.Chen,W.Ying,A.S.Hern´andez,W.Wei,and P. V.Devasthale,J.Med.Chem.53,2854(2010).
[26]G.V.Dhoke,R.P.Gangwal,and A.T.Sangamwar,J. Mol.Struct.1028,22(2012).
[27]K.C.Chen,S.S.Chang,H.J.Huang,and T.L.Lin,J.Biomol.Struct.Dyn.30,662(2012).
[28]H.J.Huang,H.W.Lee KJYu,H.Y.Chen,F.J.Tsai,and C.Y.Chen,J.Biomol.Struct.Dyn.28,187(2010). [29]S.Sundriyal and P.V.Bharatam,Eur.J.Med.Chem. 44,3488(2009).
[30]W.Ji and B.Q.Gong,J.Ethnopharmacol.119,291 (2008).
Lian-sheng Qiao†,Yu-su He†,Xiao-qian Huo,Lu-di Jiang,Yan-kun Chen,Xi Chen,Yan-ling Zhang∗,Gong-yu Li
Beijing Key Laboratory of TCM Foundation and New Drug Research,School of Chinese Material Medica,Beijing University of Chinese Medicine,Beijing 100102,China
(Dated:Received on February 22,2016;Accepted on May 18,2016) Pharmacophore is a commonly used method for molecular simulation,including ligand-based pharmacophore(LBP)and structure-based pharmacophore(SBP).LBP can be utilized to identify active compounds usual with lower accuracy,and SBP is able to use for distinguishing active compounds from inactive compounds with frequently higher missing rates. Merged pharmacophore(MP)is presented to integrate advantages and avoid shortcomings of LBP and SBP.Ⅰn this work,LBP and SBP models were constructed for the study of peroxisome proliferator receptor-alpha(PPARα)agonists.According to the comparison of the two types of pharmacophore models,mainly and secondarily pharmacological features were identified.The weight and tolerance values of these pharmacological features were adjusted to construct MP models by single-factor explorations and orthogonal experimental design based on SBP model.Then,the reliability and screening efficiency of the best MP model were validated by three databases.The best MP model was utilized to compute PPARα activity of compounds from traditional Chinese medicine.The screening efficiency of MP model outperformed individual LBP or SBP model for PPARα agonists,and was similar to combinatorial screening of LBP and SBP.However,MP model might have an advantage over the combination of LBP and SBP in evaluating the activity of compounds and avoiding the inconsistent prediction of LBP and SBP,which would be beneficial to guide drug design and optimization.
Key words:Merged pharmacophore,Ligand-based pharmacophore,Structure-based pharmacophore,Peroxisome proliferator receptor-alpha,Docking,Combinatorial screening
†They contributed equally to this work.
∗Author to whom correspondence should be addressed.E-mail: collean-zhang@163.com,Tel:+86-010-84738620
 CHINESE JOURNAL OF CHEMICAL PHYSICS2016年4期
- CHINESE JOURNAL OF CHEMICAL PHYSICS的其它文章
- Depolymerization of Organosolv Lignin over Silica-alumina Catalysts
- First-Principles Study of Magnetism in Transition Metal Doped Na0.5Bi0.5TiO3System
- Effects of Activation Atmospheres on Structure and Activity of Mo-based Catalyst for Synthesis of Higher Alcohols
- Multiple Plasmonic Resonances and Cascade Effect in Asymmetrical Ag Nanowire Homotrimer
- Solvatochromic Parameters and Preferential Solvation Behavior for Binary Mixtures of 1,3-Dialkylimidazolium Ionic Liquids with Water
- Electricity Storage With High Roundtrip Efficiency in a Reversible Solid Oxide Cell Stack