
The impact of solar activity on the 2015/16 El Niño event
2016-11-23 05:56HUOWenJunndXIAOZiNiu
HUO Wen-Junnd XIAO Zi-Niu
aState Key Laboratory of Numerical Modeling for Atmospheric Sciences and Geophysical Fluid Dynamics, Institute of Atmospheric Physics,Chinese Academy of Sciences, Beijing, China;bCollege of Earth Science, University of Chinese Academy of Sciences, Beijing, China
The impact of solar activity on the 2015/16 El Niño event
HUO Wen-Juana,band XIAO Zi-Niua
aState Key Laboratory of Numerical Modeling for Atmospheric Sciences and Geophysical Fluid Dynamics, Institute of Atmospheric Physics,Chinese Academy of Sciences, Beijing, China;bCollege of Earth Science, University of Chinese Academy of Sciences, Beijing, China
Recent SST and atmospheric circulation anomaly data suggest that the 2015/16 El Niño event is quickly decaying. Some researchers have predicted a forthcoming La Niña event in late summer or early fall 2016. From the perspective of the modulation of tropical SST by solar activity, the authors studied the evolution of the 2015/16 El Niño event, which occurred right after the 2014 solar peak year. Based on statistical and composite analysis, a signifcant positive correlation was found between sunspot number index and El Niño Modoki index, with a lag of two years. A clear evolution of El Niño Modoki events was found within 1—3 years following each solar peak year during the past 126 years, suggesting that anomalously strong solar activity during solar peak periods favors the triggering of an El Niño Modoki event. The patterns of seasonal mean SST and wind anomalies since 2014 are more like a mixture of two types of El Niño (i.e. eastern Pacifc El Niño and El Niño Modoki),which is similar to the pattern modulated by solar activity during the years following a solar peak. Therefore, the El Niño Modoki component in the 2015/16 El Niño event may be a consequence of solar activity, which probably will not decay as quickly as the eastern Pacifc El Niño component. The positive SST anomaly will probably sustain in the central equatorial Pacifc (around the dateline)and the northeastern Pacifc along the coast of North America, with a low-intensity level, during the second half of 2016.
ARTICLE HISTORY
Revised 4 July 2016
Accepted 5 July 2016
El Niño; El Niño Modoki; solar activity; SST; atmospheric circulation
最近的海洋表面温度和大气环流异常的数据表明此次2015/16厄尔尼诺事件正在快速衰退。一些研究者预测紧随的拉尼娜事件将在2016年夏季或早秋到来。从太阳活动对热带海洋表面温度的调制作用出发,作者研究了发生在太阳活动峰值年(2014)之后的2015/16厄尔尼诺事件的演变过程。统计和合成分析的结果表明,当厄尔尼诺Modoki指数滞后太阳黑子数两年时,二者存在显著的正相关。在过去的126年(1890—2015)里,每一个太阳活动峰值年之后的1—3年内均明确存在厄尔尼诺Modoki事件的演变过程。这说明可能在太阳活动峰值期,异常强的太阳活动有利于激发产生厄尔尼诺Modoki事件。自2014年以来,季节平均的海洋表面温度异常和风场异常的空间特征更像是两类厄尔尼诺事件的混合物(即东太平洋型厄尔尼诺和厄尔尼诺Modoki),其空间特征受到太阳活动的调控。因此,2015/16 El Niño事件中的厄尔尼诺Modoki组分可能是太阳活动的结果,其衰退速度比东太平洋型厄尔尼诺组分较慢。因此,在2016年下半年,微弱的海洋表面温度正异常可能持续存在于赤道中太平洋(日界线附近)和北美西边界附近。
1. Introduction
El Niño refers to anomalous warming in the eastern equatorial Pacifc, and has been studied for nearly fve decades(Bierknes 1969). Owing to its teleconnection, El Niño has global efects, especially for atmospheric circulation anomalies in the tropics and extra-tropics. However, another type of El Niño has also been recognized in recent studies,whose maximum warming arises in the central Pacifc and then extends eastward over time (Ashok and Yamagata 2009). This new type of El Niño has its own spatial pattern,teleconnection, and climate efect, and, in particular, has a strong decadal period (Ashok, Behera, and Rao 2007; Kug,Jin, and An 2009). However, its mechanism is not as clear as that of traditional El Niño events. Generally speaking,the new type of El Niño is referred to as El Niño Modoki and the traditional El Niño as eastern Pacifc El Niño (EP El Niño) (Ashok, Behera, and Rao 2007; Kao and Yu 2009).
In early May 2014, a positive SST anomaly appeared in the equatorial central-eastern Pacific, and was at the time thought to possibly be a very strong El Niño,like the one seen in 1997/98 (NASA 2014). However,in the subsequent months of 2014, the SST anomalyunexpectedly fell back to a neutral state (Australian Government Bureau of Meteorology 2014). The role of off-equatorial surface temperature anomalies has been noted (Zhu et al. 2016). The arrival of weak El Niño conditions was then confirmed in May 2015 (NOAA 2015b),and it eventually developed into one of the strongest El Niño events on record. Some studies and reports have suggested that this 2015/16 El Niño event will return to a neutral state by late spring or early summer 2016, with a chance for La Niña development by fall(International Research Institute for Climate and Society 2016). Alongside these events, in 2014, solar activity reached its 24th solar cycle peak.
Considering the infuence of solar activity, we analyzed the characteristics of the 2015/16 El Niño's evolution in this study. It is known that the positive SST anomaly frst arose in the central equatorial Pacifc and northeastern Pacifc near the west coast of North America before the onset of the 2015/16 El Niño event, which looked like the onset of an El Niño Modoki event (NOAA 2015a). However,it changed into an EP El Niño at a later time. Based on our previous work, it is possible that solar activity modulates El Niño Modoki events on decadal timescales. Thus, here,we investigated whether or not there was any infuence of solar activity on the 2015/2016 El Niño event, and, if so,how it worked. Specifcally, based on statistical analysis of historical data, we studied the evolutionary features of the 2015/16 El Niño event, in the hope of gaining greater insights into the possible impact of solar activity.
2. Data and methods
The solar index used in this study is the international sunspot number (SSN) index, which is provided by SILSO(Sunspot Index and Long-term Solar Observations) of the World Data Center at the Royal Observatory of Belgium,Brussels (http://www.sidc.be/silso/datafles). The historical annual mean (1700—2015) and monthly mean (1749—2016)data were used in the statistical analysis. The sunspot maximum (1610—2015) was used to defne peak years of the solar cycle.
Two SST datasets were used in this study, both of which were provided by ESRL (NOAA). The frst was ERSST.v3b, in which the monthly mean data begin in January 1854 and continue until the present day, in 2016 (http://www.esrl. noaa.gov/psd/data/gridded/data.noaa.ersst.html). In this study, we used the more reliable data from 1890 to 2016 for the statistical analysis. The other was NOAA's OISST2,covering the period December 1981 to March 2016, which comprises in situ and satellite-derived SST on a 1° grid(http://www.esrl.noaa.gov/psd/data/gridded/data.noaa. oisst.v2.html). This data-set was used to investigate the features of the 2015/16 El Niño event.
The wind feld at 850 hPa (http://www.esrl.noaa.gov/ psd/data/gridded/data.ncep.reanalysis.derived.pressure. htm) and SLP (http://www.esrl.noaa.gov/psd/data/gridded/data.ncep.reanalysis.derived.surface.html) used in this study were obtained from the NCEP—NCAR Reanalysis-1 project (1948—2016), which were also provided ESRL(NOAA).
In this work, the El Niño Modoki Index (EMI) is defned as (Ashok, Behera, and Rao 2007)

where the square bracketed terms [SSTA]C, [SSTA]E, and[SSTA]Wrepresent the area-averaged SST anomalies in the central Pacifc region (C (10°S—10°N, 165°E—140°W)), eastern Pacifc region (E (15°S—5°N, 110—70°W)), and western Pacifc region (W (10°S—20°N, 125—145°E)), respectively.
The SST data used in the statistical analysis were linearly de-trended. We used the more reliable data from 1955 to 2015 for the composite analysis. Anomalies were defned as the departure from the monthly or seasonal mean.
3. Results and discussion
3.1. The modulation of El Niño Modoki events by solar activity
The interannual variations of SSN and EMI are shown in Figure 1. As we can see, when EMI lags behind SSN by two years, the correlation coefcient reaches its maximum of 0.186216, which is above the 95% confdence level. The power spectrums reveal that both have a clear common period of around 11—12 years, which has also been reported in previous studies (Ashok, Behera, and Rao 2007;Kug, Jin, and An 2009).
In order to investigate the correlation between SSN and EMI, composite analysis was applied to reveal the distribution of the seasonal mean SST anomaly in the high years of solar activity. The years with maximum sunspot numbers were taken as solar peak years, consistent with the peak years given by Van Loon, Meehl, and Shea (2007).
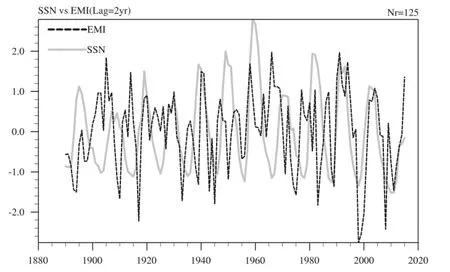
Figure 1.Annual mean SSN (solid grey line) and EMI (dotted black line) from 1890 to 2015, with a lag of two years.
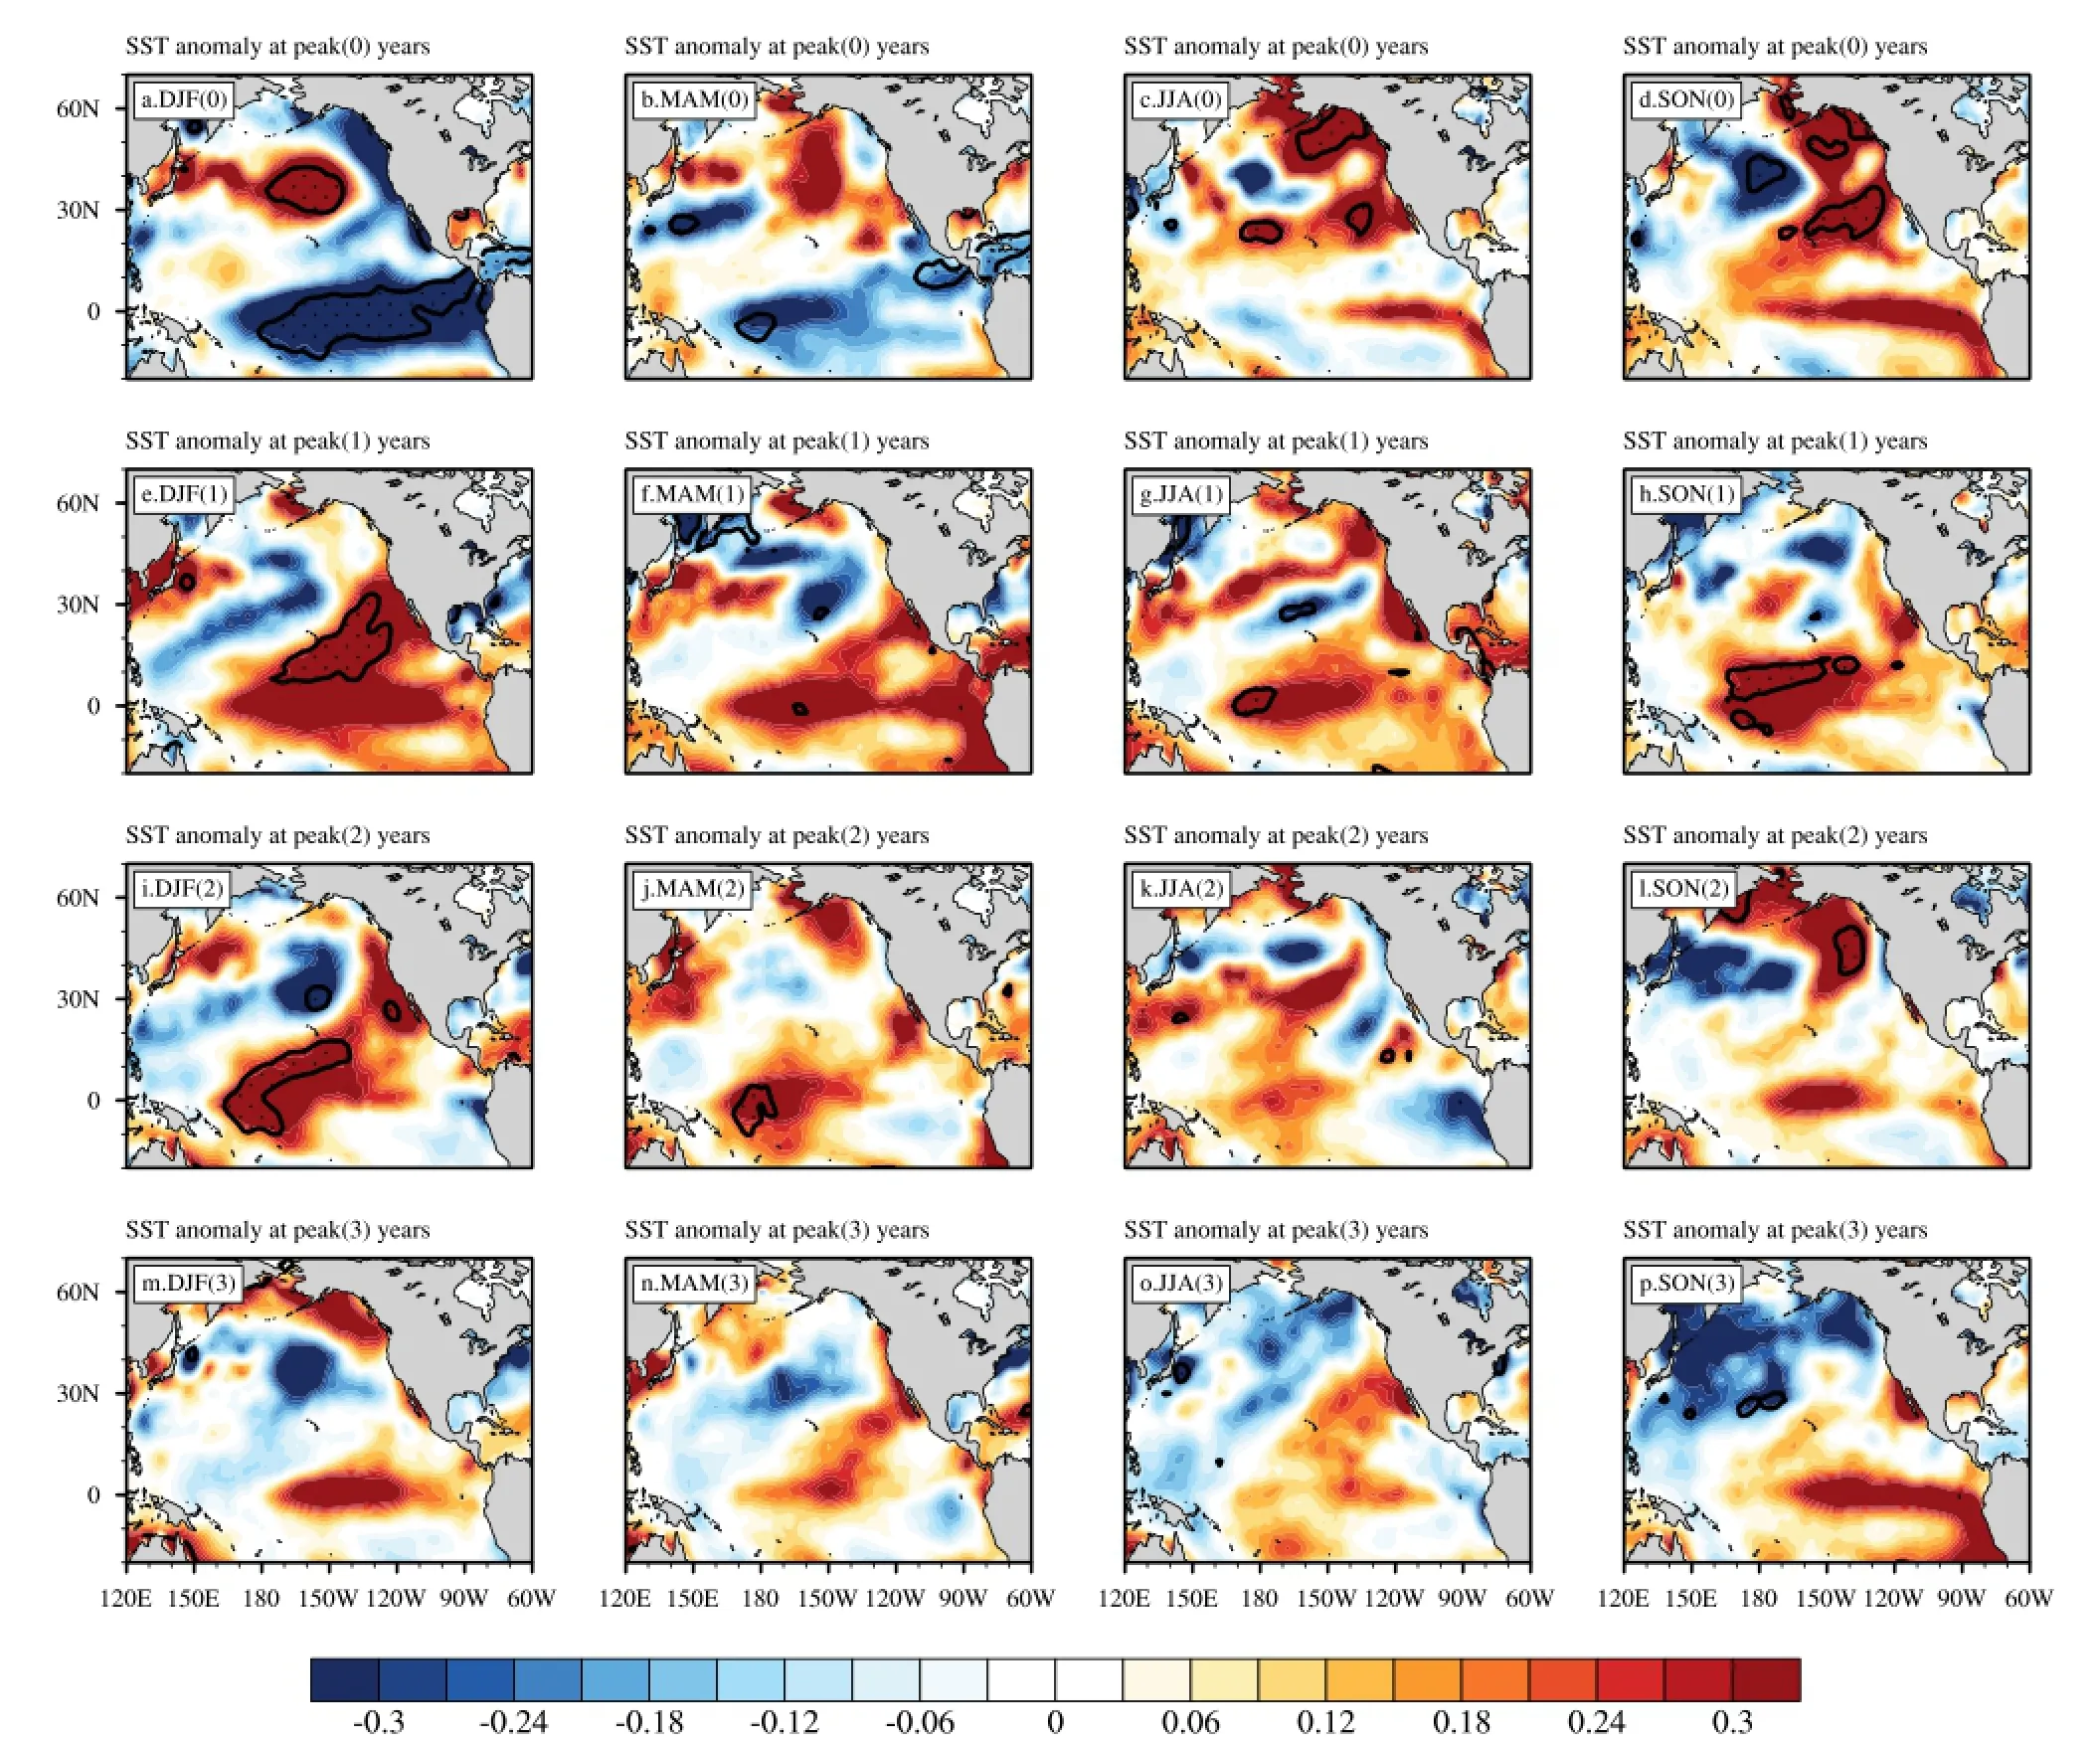
Figure 2.Composites of the seasonal mean SST anomaly (contours; units: °C) during peak years of the solar cycle, and the following one,two, and three years.
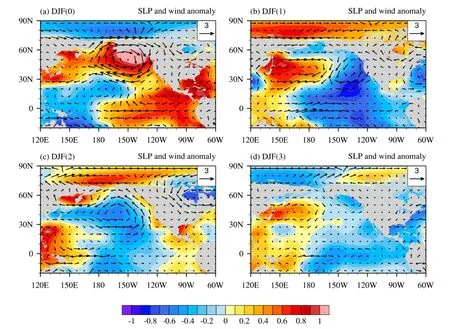
Figure 3.Composites of seasonal mean SLP (contours; units: hPa) and 850 hPa wind (vectors; units: m s-1) anomalies in the winter seasons of peak years and the following one, two, and three years.
The evolution of the SST anomaly's response to solar activity during peak years and the following one, two, and three years is demonstrated in Figures 2. Firstly, a La Niñalike pattern appears in the Northern Hemisphere winter(December—February) of solar peak years (Figure 2(a)),which is consistent with previous work (Van Loon, Meehl,and Shea 2007). However, this negative SST anomaly in the equatorial Pacifc gradually decays in the next two seasons, from spring (March—May) to summer (June—August)(Figure 2(b) and (c)). Concurrently, a positive SST anomaly over the northeastern Pacifc arises in summer (Figure 2(c)) and extends into the equatorial Pacifc during fall(September—November) (Figure 2(d)) and the subsequent winter (Figure 2(e)). This positive SST anomaly pattern is favorable for the onset and development of an El Niño Modoki event. Note that the negative SST anomaly over the equatorial Pacifc is replaced by a positive anomaly in the frst and second year after the solar peak year, and the signifcant regions (beyond the 90% confdence level)are located in the central Pacifc (Figure 2(f)—(j)). The El Niño Modoki phenomenon gradually decays in the third year after the solar peak year (Figure 2(k)—(p)). A distinct feature is revealed in the frst column of Figure 2, in that the positive SST anomaly branch originates in the northeastern Pacifc and extends southwestward into the central equatorial Pacifc during winter after a solar peak. The suggestion is that the positive SST anomaly pattern in winter likely acts as a critical trigger for warming in the central equatorial Pacifc (Pierce, Barnett, and Latif 2000;Xie, Huang, and Ren 2013). Similar features were also found in the seasonal variation of subsurface ocean temperature(not shown here). But how does solar activity modulate El Niño Modoki events? This is an interesting question, which we address next.
It has been pointed out that statistically signifcant warming takes place in the upper and lower stratosphere over tropical and subtropical regions during strong solar activity years (Labitzke et al. 2002). This warming is transported downward and poleward into the lower atmosphere over the polar regions by interacting with planetary waves (Haigh and Blackburn 2006). In the northern hemisphere, the process results in remarkable diferences in atmospheric circulation at high latitudes, such as a stronger Northern Annular Mode anomaly and Arctic Oscillation, in solar maximum years compared with solar minimum years (Huth, Bochníčekb, and Hejdab 2007). During high solar activity winters, the impact of ENSO on surface temperature is depressed (Zhou, Chen, and Zhou 2013). Furthermore, it has been proven that the positive SST anomaly over the tropical central Pacifc is a consequence of the atmospheric circulation anomaly over high latitudes, and the SLP anomaly is regarded as a preceding signal for El Niño Modoki events (Anderson 2003).
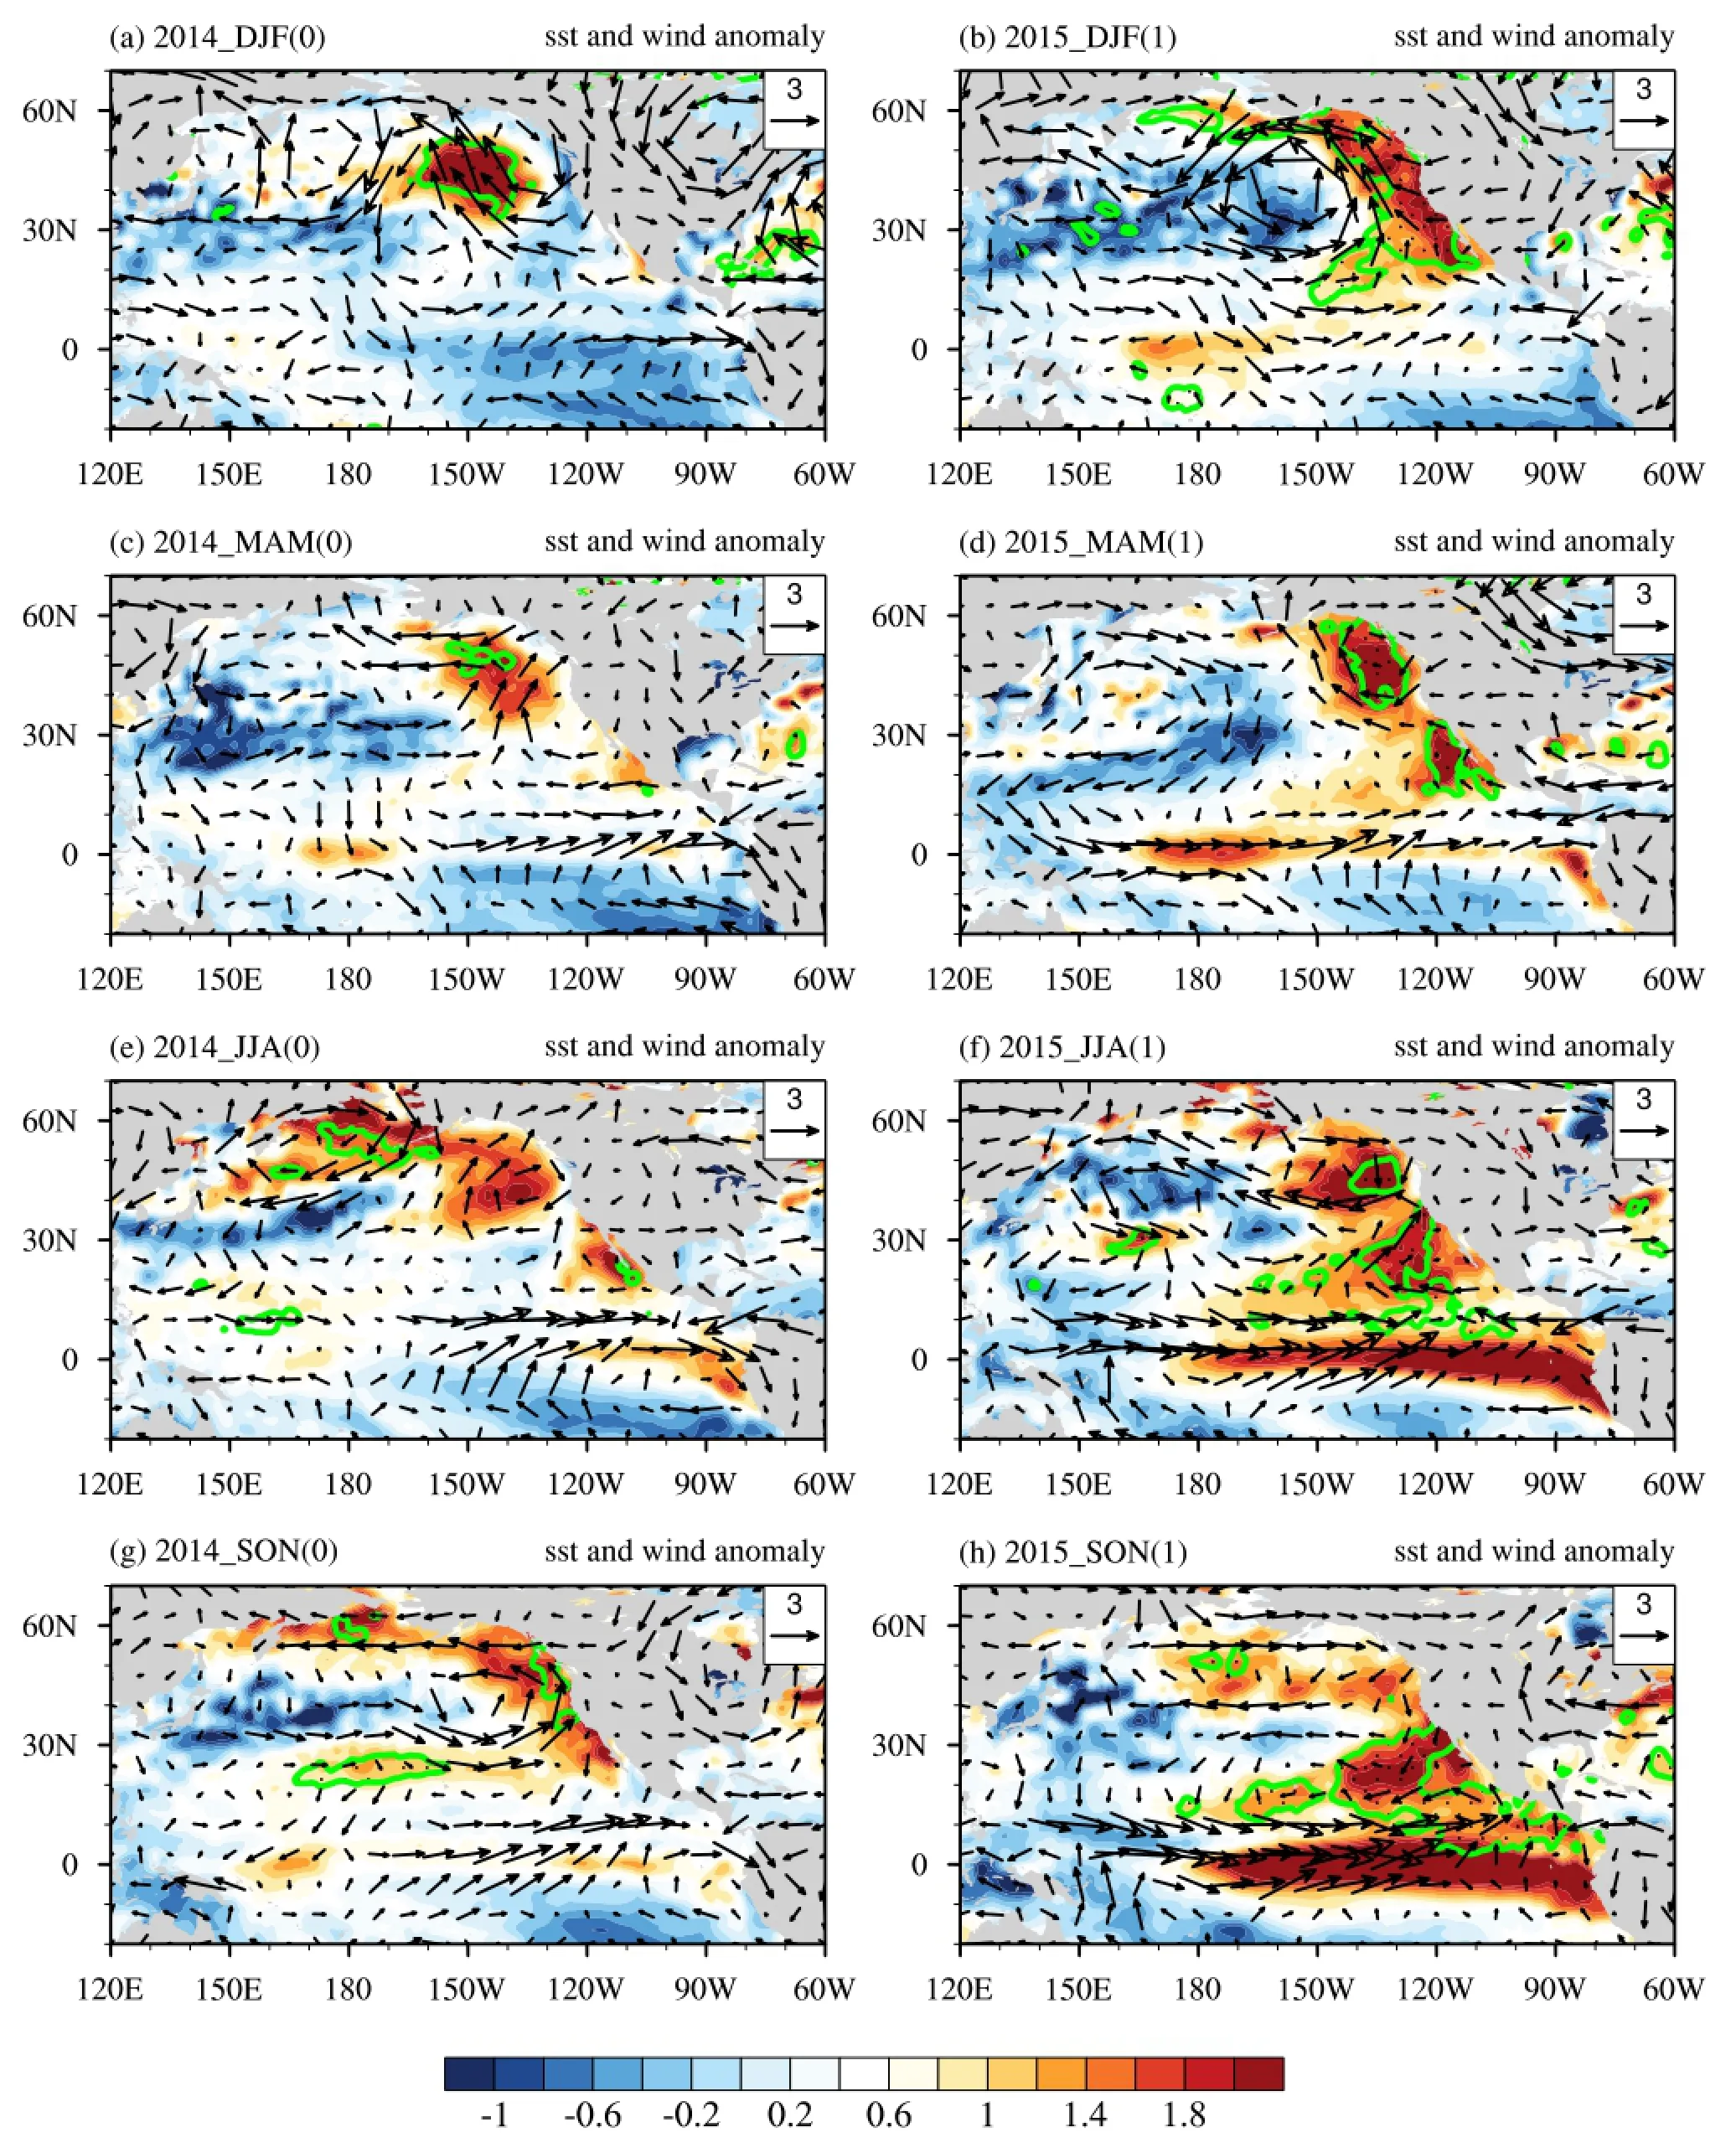
Figure 4.Composites of seasonal mean SST (contours; units: °C) and 850 hPa wind (vectors; units: m s-1) anomalies in 2014 and 2015.
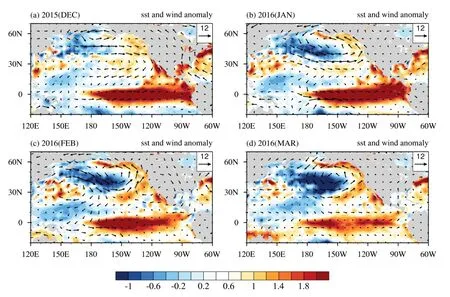
Figure 5.Composites of monthly average SST (contours; units: °C) and 850 hPa wind (vectors; units: m s-1) anomalies in 2016.
Composites of winter seasonal mean SLP and 850 hPa wind anomalies in peak years and the following one, two, and three years are presented in Figure 3. Anomalous low pressure (cold temperatures) and high pressure (warm temperatures) are located in the high-latitude region and subtropical region, respectively, in the winter season of solar peak years (Figure 3(a)). These conditions are conducive to the generation of an anticyclone in the northeastern Pacifc. However, almost the opposite features appear in the winter seasons of one and two years after the solar peak (Figure 3(b) and (c)). A positive SLP anomaly is located near the north pole, and a negative anomaly in the northeastern Pacifc. An anomalous cyclonic circulation system occurs in the subtropics near the west coast of North America. Eventually, these anomalous features disappear in the third winter after a solar peak year(Figure 3(d)). Meanwhile, strong westerly anomalies and weak easterly anomalies arise on each side of the central equatorial Pacifc (vectors, Figure 3(b)—(d)). The anomalous zonal wind results in convergence in the central equatorial Pacifc, which is essential for the development and maintenance of an El Niño Modoki event (Ashok, Behera, and Rao 2007; Kug, Jin, and An 2009).
Many studies have revealed that the positive SST anomaly in the central equatorial Pacifc may be caused by an earlier anomalous cyclone in the subtropical Pacifc in winter (e.g. Pierce, Barnett, and Latif 2000; Xie, Huang, and Ren 2013). As shown above, an anomalous cyclone controls the northeastern Pacifc in the winter seasons of one and two years after a solar peak. The anomalous southwesterly winds to the southern side could reduce the local trade wind speed and wind-induced surface evaporation. Consequently, a positive SST anomaly would be produced by the strong solar radiation in these cloudless areas in winter, and extend into the central equatorial Pacifc along the wind anomaly route. Once the positive SST anomaly arises in the equatorial pacifc, it would be sustained and amplifed in the following seasons by the convergence of anomalous zonal wind, and air—sea interaction (Figure 2(e)—(j)).
3.2. Features of the 2015/16 El Niño event
The seasonal mean SST anomaly (contours) and wind anomaly at 850 hPa (vectors) from the winter of 2014 to the fall of 2015 are shown in Figure 4. A signifcant positive SST anomaly is apparent in the northeastern Pacifc in the winter season of 2014, which shifts eastward to the coast of North America in the following seasons of 2014 (see the left column of Figure 4). A weak positive SST anomaly appears in the tropical Pacifc, especially in the central equatorial Pacifc, in the spring of 2014 (Figure 4(c)). In the winter season of 2015, the positive SST anomaly stretches from the coast of North America to the central equatorial Pacifc (Figure 4(b)), which is similar to the features in the winter season of the year after a solar peak (Figures 2(e) and 3(b) (vectors)). The positive SST anomaly in the central equatorial Pacifc increases and extends to the eastern equatorial Pacifc in the spring of 2015 (Figure 4(d)).Finally, the strength of westerly wind anomalies in the tropical western Pacifc is enhanced and an EP El Niño event is found in the summer of 2015 (Figure 4(f)), which develops in the following seasons of 2015 and reaches its highest point during winter 2016 (Figure 5(a)—(c)). As a mixture of EP El Niño and El Niño Modoki, the meridional scale of the positive SST anomaly in the 2015/16 El Niño event is wider than during a traditional EP El Niño event.
Note that a La Niña-like pattern is apparent at frst in winter 2014 (Figure 4(a)), when the solar cycle peaked, but the negative SST anomaly over the equatorial Pacifc is replaced by a positive anomaly in the following winter season(Figure 4(b)). Meanwhile, an anomalous cyclonic circulation system dominates the mid-latitudinal northeastern Pacifc in winter 2015, south of which is a strong southwesterly wind anomaly from the tropics to the mid—high latitudes. In fact, a northerly wind anomaly is frstly apparent along the coast of North America in the northeastern Pacifc in winter 2014, but it changes into a southerly wind anomaly in winter 2015, which is located in the region from the tropics to the coast of North America (vectors in Figure 4(a) and(b)). As described above, the change in the atmospheric circulation anomaly over the middle and high latitudes is related to the local SLP anomaly, which is modulated by solar activity. Furthermore, it has been pointed out that southwesterly wind anomalies in the northeastern Pacifc are responsible for positive SST anomalies in the equatorial central Pacifc during an El Niño Modoki event (Pierce,Barnett, and Latif 2000; Xie, Huang, and Ren 2013).
The observations reveal that the positive SST anomaly and westerly wind anomalies in the equatorial Pacifc have been weakening since February 2016 (Figure 5(c) and (d)). However, an anomalous cyclone was still cited in the North Pacifc in late winter and March 2016. From the analysis above, this is more or less favorable for the development of an El Niño Modoki component in the 2015/16 El Niño event. However, the locations of the southwesterly winds of the anomalous cyclone in the northeastern Pacifc are more northerly than in the preceding winter season. As a result, the warming in the northeastern Pacifc is weaker.
4. Conclusion
This study investigated the modulation of El Niño Modoki events by solar activity, and analyzed the possible impact of solar activity on the 2015/16 El Niño event.
The 2015/16 El Niño event is more like a mixture of two types of El Niño; namely, EP El Niño and El Niño Modoki. The EMI has a clear decadal period, similar to the solar cycle, and demonstrates a signifcant positive correlation with sunspot numbers. Statistical analysis revealed that an El Niño Modoki event will most likely occur in the one to three years following a solar peak year. The solar cycle reached a peak in 2014 — the 24th solar cycle since 1755. The evolution of the SST and wind anomalies are similar to the typical features found from historical data composites in peak years and the following one to three years after a solar peak. Therefore, the El Niño Modoki component of the 2015/16 El Niño event might also have resulted from high solar activity. Considering the impact of high solar activity, the El Niño Modoki component in the 2015/16 El Niño event may not decay as quickly as the EP El Niño event. It will likely sustain in the central Pacifc, with a low-intensity level, in the second half of 2016.
Acknowledgements
We thank Dr Gao-Peng LU for the professional English editing.
Disclosure statement
No potential confict of interest was reported by the authors.
Funding
This work was supported by the National Basic Research Program of China (973 Program) [grant number 2012CB957804];the External Cooperation Program of BIC, Chinese Academy of Sciences [grant number 134111KYSB20150016].
References
Anderson, B. T. 2003. “Tropical Pacifc Sea-surface Temperatures and Preceding Sea Level Pressure Anomalies in the Subtropical North Pacifc.” Journal of Geophysical Research 108: 4732. doi:10.1029/2003JD003805.
Ashok, K., and T. Yamagata. 2009. “Climate Change: The El Niño with a Diference.” Nature 461: 481—484.
Ashok, K., S. Behera, and A. S. Rao. 2007. “El Niño Modoki and its Possible Teleconnection.” Journal of Geophysical Research 112: C11007. doi:10.1029/2006JC003798.
Australian Government Bureau of Meteorology. 2014. “El Niño Remains on Hold.” Accessed July 15, 2014. http://www.bom. gov.au/climate/enso/archive/ensowrap_20140715.pdf
Bierknes, J. 1969. “Atmospheric Teleconnections from the Equatorial Pacifc.” Monthly Weather Review 97: 163—172.
Haigh, J. D., and M. Blackburn. 2006. “Solar Infuences on Dynamical Coupling between the Stratosphere and Troposphere.” Space Science Review 125: 331—344. doi:10.1007/978-0-387-48341-2_26.
Huth, R., J. Bochníčekb, and P. Hejdab. 2007. “The 11-year Solar Cycle Afects the Intensity and Annularity of the Arctic Oscillation.” Journal of Atmospheric and Solar-Terrestrial Physics 69: 1095—1109. doi:10.1016/j.jastp.2007.03.006.
International Research Institute for Climate and Society. 2016.“IRI ENSO Forecast: 2016 May Quick Look.” Accessed April 14, 2016. http://iri.columbia.edu/our-expertise/climate/ forecasts/enso/current/?enso_tab=enso-cpc_plume
Kao, H. Y., and J. Y. Yu. 2009. “Contrasting Eastern-Pacifc and Central Pacifc Types of El Niño.” Journal of Climate 22: 615—632. doi:10.1175/2008JCLI2309.1.
Kug, J. S., F. F. Jin, and S. I. An. 2009. “Two Types of El Niño Events: Cold Tongue El Niño and Warm Pool El Niño.” Journal of Climate 22: 1499—1515.
Labitzke, K., J. Austin, N. Butchart, J. Knight, M. Takahashi,M. Nakamoto, T. Nagashimac, J. Haighd, and V. Williams. 2002. “The Global Signal of the 11-year Solar Cycle in the Stratosphere: Observations and Model Results.” Journal of Atmospheric and Terrestrial Physics 64: 203—210. doi:10.1016/ S1364-6826(01)00084-0.
NASA (National Aeronautics and Space Administration). 2014.“Is El Niño Developing?” Accessed May 3, 2014. http:// earthobservatory.nasa.gov/IOTD/view.php?id=83653
NOAA (National Oceanic and Atmospheric Administration),Climate Prediction Center. 2015a. “ENSO Diagnostic Discussion.” Accessed April 2015. http://www.cpc.ncep.noaa. gov/products/CDB/CDB_Archive_html/bulletin_042015/ Tropics/tropics.shtml
NOAA. 2015b. “Elusive El Niño Arrives.” Accessed March 5, 2015. http://www.noaanews.noaa.gov/stories2015/20150305-noaa-advisory-elnino-arrives.html
Pierce, D. W., T. P. Barnett, and M. Latif. 2000. “Connections between the Pacifc Ocean Tropics and Midlatitudes on Decadal Timescales.” Journal of Climate 13: 1173—1194. doi:10.1175/1520-0442(2000)013<1173:CBTPOT>2.0.CO;2.
Van Loon, H., G. A. Meehl, and D. J. Shea. 2007. “Coupled Air-Sea Response to Solar Forcing in the Pacifc Region during Northern Winter.” Journal of Geophysical Research 112: D02108. doi:10.1029/2006JD007378.
Xie, R. H., F. Huang, and H. L. Ren. 2013. “Subtropical Air-sea Interaction and the Development of the Central Pacifc El Niño.” Journal of Ocean University of China 12 (2): 260—271. doi:10.1007/s11802-013-2143-7.
Zhou, Q., W. Chen, and W. Zhou. 2013. “Solar Cycle Modulation of the ENSO Impact on the Winter Climate of East Asia.”Journal of Geophysical Research: Atmospheres 118: 5111—5119. doi:10.1002/jgrd.50453.
Zhu, J. S., A. Kumar, B. H. Huang, M. A. Balmaseda, Z. Z. Hu, L. Marx,and J. L. Kinter III. 2016. “The Role of of-equatorial Surface Temperature Anomalies in the 2014 El Niño Prediction.”Scientific Reports 6: 19677. doi:10.1038/srep19677.
26 May 2016
CONTACT XIAO Zi-Niu xiaozn@lasg.iap.ac.cn
© 2016 The Author(s). Published by Informa UK Limited, trading as Taylor & Francis Group.
This is an Open Access article distributed under the terms of the Creative Commons Attribution License (http://creativecommons.org/licenses/by/4.0/), which permits unrestricted use, distribution, and reproduction in any medium, provided the original work is properly cited.
猜你喜欢
制冷学报(2022年6期)2022-12-22
空间科学学报(2021年4期)2021-08-30
空间科学学报(2021年4期)2021-08-30
海洋通报(2020年2期)2020-09-04
新世纪智能(英语备考)(2019年4期)2019-06-26
当代化工研究(2016年6期)2016-03-20
海洋世界(2015年6期)2015-12-06
智慧与创想(2013年2期)2013-03-25
资源环境与工程(2011年1期)2011-11-07
 Atmospheric and Oceanic Science Letters2016年6期
- Atmospheric and Oceanic Science Letters的其它文章
- Parameterizing an agricultural production model for simulating nitrous oxide emissions in a wheat-maize system in the North China Plain
- Response of fne particulate matter to reductions in anthropogenic emissions in Beijing during the 2014 Asia-Pacifc Economic Cooperation summit
- Contrasting two spring SST predictors for the number of western North Pacific tropical cyclones
- Quantifying the attribution of model bias in simulating summer hot days in China with IAP AGCM 4.1
- Model analysis of secondary organic aerosol over China with a regional air quality modeling system (RAMS-CMAQ)
- Is the interdecadal circumglobal teleconnection pattern excited by the Atlantic multidecadal Oscillation?