
基于近红外高光谱成像技术鉴别杂交稻品系
2017-12-15 02:31刘小丹冯旭萍
农业工程学报 2017年22期
刘小丹,冯旭萍,刘 飞,何 勇
基于近红外高光谱成像技术鉴别杂交稻品系
刘小丹,冯旭萍,刘 飞,何 勇※
(浙江大学生物系统工程与食品科学学院,杭州 310058)
种子的筛选和鉴别是农业育种过程中的关键环节。该文基于近红外高光谱成像技术(874~1 734 nm)结合化学计量学方法以及图像处理技术实现杂交稻种的品系鉴别及可视化预测。采集了3类不同品系共2 700粒杂交水稻的高光谱图像,用SPXY算法,按照2∶1的比例划分建模集和预测集。基于水稻样本的光谱特征,采用主成分分析(PCA)方法初步探究3类样本的可分性。采用连续投影算法(SPA),提取出7个特征波长:985.08、1 106、1 203.55、1 399.04、1 463.19、1 601.81、1 645.82 nm。基于特征波长和全波段光谱,建立了偏最小二乘判别分析(PLS-DA)和支持向量机(SVM)模型。试验结果表明,所建模型判别效果较好,识别正确率均达到了90%以上,其中,SVM 模型的判别效果优于PLS-DA 模型,基于全谱的判别分析模型结果优于基于特征波长的判别模型。结合SPA-SVM校正模型和图像处理技术,生成样本预测伪彩图,可以直观的鉴别不同品系的水稻种子。结果表明,近红外高光谱成像技术可以实现杂交稻的品系识别及可视化预测,为农业育种过程中种子的快速筛选及鉴定提供了新思路。
图像处理;光谱分析;无损检测;高光谱成像;水稻种子;连续投影算法
0 引 言
中国对杂交水稻的研究始于1964年,随后三系杂交水稻和两系杂交水稻配套成功并被迅速示范推广,杂交水稻的出现解决了全国乃至全球的粮食安全问题,取得了巨大的社会和经济效益。根据国家水稻品种区试、审定及推广情况统计资料,两系杂交水稻在产量和米质方面均优于三系、抗病虫性与三系杂交水稻大致相当[1],但目前市场上水稻种子种类繁多,种类系别间相似性较大,两系和三系杂交水稻种子难以区分,鱼目混珠的事件时有发生,严重影响作物的产量及农民的利益。传统的种子鉴别方法主要有形态鉴别和化学鉴别。这些方法主观性强、耗时费力、对种子具有一定的破坏性。因此,急需一种快速无损检测技术实现水稻种子的品系鉴别。
高光谱图像技术是一种结合机器视觉和光谱技术的新兴快速无损检测技术,能够同时获取图像信息和光谱信息,近年来被广泛的用于种子的品质及类别鉴定[2-6]。Williams等[7]利用近红外高光谱技术实现了玉米不同硬度的可视化分析,直观的区分不同硬度的玉米;Zhang等[8]利用高光谱技术结合判别分析模型对6类玉米种子进行鉴别;Kong等[9]将多种化学计量学分析方法应用到基于高光谱技术的杂交稻品种鉴别中,判别效果较好。但上述研究中,样本量都较少,而且在对水稻种子的研究中并未涉及对水稻系别的区分。在实际农业育种及生产中,需要因地制宜在大批量的水稻种子中筛选和鉴定合适的水稻品系,因此,探究一种水稻品系的快速筛选鉴定技术显得尤为重要。
本研究将近红外高光谱成像技术与化学计量学方法相结合,建立分类模型鉴别杂交稻品系,并结合图像处理技术,基于判别效果较好的数学模型生成水稻种子的可视化预测伪彩图,进而直观的对3类不同品系的水稻种子进行鉴别。
1 试验材料与方法
1.1 材料
试验所用3类水稻种子由江苏省明天种业科技有限公司提供,分别为两系杂交水稻种子深两优862,和两优713,三系杂交水稻种子内2优6号。所有种子均为正常品质,外观没有明显瑕疵。实验共用水稻种子2 700粒,每类各900粒。采用SPXY[10]算法,按照2∶1的比例划分建模集和预测集,得到1 800粒杂交稻种作为建模集,900粒杂交稻种作为预测集。
1.2 高光谱图像获取
试验采用高光谱成像系统(图1)获取水稻种子的图谱信息。该系统主要由成像光谱仪、镜头、CCD相机线光源、电控移位平台、计算机、暗箱,样品台等组成。

图1 高光谱成像系统
系统的光谱分辨率为5 nm,光谱范围为874~1 734 nm,近红外高光谱图像分辨率为320×256像素。为得到清晰可用的光谱图像,在光谱采集前,需要对试验系统的相关参数进行设置。经过反复对比调试,得到最适的系统参数:物镜的高度为29.5 cm,曝光时间3.2 ms,平台移动速度为23 mm/s。为了消除各波段下光强度分布不均以及镜头中存在的暗电流所产生的噪声,采集标准白色校正板(反射率接近100%)的高光谱图像作为白色标定图,用黑板遮挡镜头,采集高光谱图像(反射率接近0)作为黑色标定图,利用黑白标定图对样本的高光谱图像进行矫正[11-12],公式如下

式中0代表黑白矫正后的水稻种子高光谱图像,为水稻种子的原始高光谱图像,为黑色标定图,为白色标定图。
采集图像时,CCD相机中的线列探测器在光学焦面的垂直方向做横向扫描,同时在样品台移动方向上做纵向扫描,以此获得样本在整个平面的光谱图像。为了提高采集效率,将多粒水稻种子规则的排列于样品台上,同时获取多个样本的光谱信息。文中采用ENVI4.6软件处理黑白校正后的高光谱图像,基于MATLAB 2014a软件提取与高光谱图像对应的光谱数据。
1.3 特征波长选择
高光谱图像包含图像和光谱信息,全波段光谱不仅数据量大,而且存在大量的冗余和共线信息,影响模型的准确性和计算速度[13-14]。因此采用连续投影算法(successive projections algorithm,SPA),从水稻种子的平均光谱中提取特征波长,以简化模型,提高模型的可靠性。SPA是一种前向特征变量选择方法,其选择的是含有最少冗余信息及最小共线性的变量组合,因此在光谱特征波长选择中有广泛的应用[15-16]。本文用MATLAB 2014a运行连续投影算法,从波长为975~1 646 nm的光谱中提取特征波长,输入建模集和预测集样本的光谱数据和类别序号,设定特征波长选择数量范围为5~20,共得到7个特征波长用于后续建模分析。
1.4 判别分析方法
本研究采用主成分分析(PCA)初步探究3类水稻的可分性,运用偏最小二乘分析(PLS-DA)和支持向量机(SVM)算法建立基于全谱和特征波长的水稻品系鉴别模型。PCA是一种常用有效的数据降维压缩算法,其基本原理是通过线性变换将原始数据中的多个相关变量转换成新的综合变量(主成分),新的变量中前几个贡献率大的主成分涵盖了原始数据的主要信息[17-18]。因此,本文保留前3个主成分进行分析,通过比较样本在3个主成分上的空间分布定性的区分3类水稻。
PLS-DA是1种有监督的模式识别方法,被广泛的用于光谱数据的分类分析[19-22]。本文将样本的光谱数据作为自变量,类别序号作为因变量,在Unscrambler 10.1中采用留一法交互验证建立PLS-DA模型,并基于此分类模型对预测集样本进行预测。根据样本的实际类别序号和模型的预测值之差的绝对值()计算建模集和预测集的判别正确率,由于值带有小数,在实际计算时,设定阈值为0.5[23],即小于0.5则判别正确,否则判别错误。模型的参数即隐含变量(latent variables,LVs)的数量通过预测残差平方和确定。
SVM是基于统计学习VC维理论和结构风险最小原理的机器学习算法,可用于数据的定性及定量分析[24-26]。SVM通过核函数,将输入空间映射到高维空间,构建最优分类面准确无误的将2类分开,并引入惩罚系数和松弛系数(,)进行修正,使2类的分类间隔最大从而保证风险最小,在数据的分类分析中应用广泛[10]。本文在MATLAB 2014a输入样本的建模集和预测集,运行鉴别杂交稻种品系的SVM程序,采用径向基函数(RBF)作为SVM模型的核函数,采用网格搜索法在2-8到28寻优范围内确定最优的(,)参数组合[27],输出模型的识别正确率。
2 结果与分析
2.1 水稻种子的形态学特征
种子形态特征是育种过程中种子筛选和鉴别的重要参考依据,传统的种子形态特征判别方法是肉眼观察或工具测量等方式,费时费力且误差较大。本文通过高光谱图像,提取单粒水稻种子的面积周长等特征,从形态学方面鉴别不同品系杂交稻种,为育种筛选提供新的方法和思路。
在MATLAB 2014a中,读取水稻种子的高光谱图像,根据种子及背景的波段比率进行阈值分割,得到二值图像作为掩模图像去除原始光谱图中的背景信息,分离出水稻种子。用每粒种子轮廓像素内的像素总数代表种子的面积,轮廓像素数代表周长,长轴和短轴长度的像素数代表长轴和短轴的长度。对获取的种子形态学特征利用Duncan方法进行方差分析,结果如表1所示。由表可知,三系水稻的4个形态学参数都显著大于两系水稻(<0.01),而两系水稻的形态学参数较为接近。但由于形态学参数受环境影响较大,因此需进一步结合水稻种子的光谱信息对水稻系别进行区分。

表1 种子的形态学特征
注:不同小写字母表示在<0.01水平上品种间存在显著差异。下同。
Note: Different lowercase letters indicate significant difference among the varieties at<0.01. The same as below.
2.2 水稻种子的平均光谱曲线
本试验采集水稻种子在874~1 734 nm波长范围的近红外光谱,但受仪器及周围环境影响,光谱前后端噪声明显。因此,去除噪声明显的波段,只对975~1 646 nm(波段31~波段230)间的光谱数据进行分析,得到3类水稻种子的平均光谱如图2所示。由图2可知,3类水稻种子的光谱曲线趋势一致,波峰、波谷的位置相同,但是反射率有所不同,其中两系杂交稻的反射率接近,三系杂交稻的反射率较高。这可能是由于不同品系水稻种子的化学成分及分子结构存在差异,为后续的化学计量学分析提供了依据。
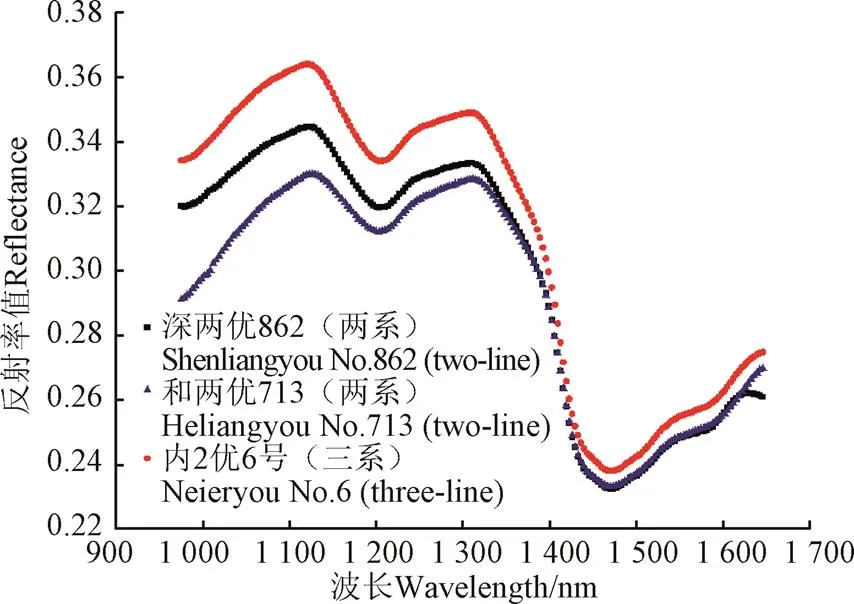
图2 杂交稻样本的平均反射光谱
2.3 主成分分析
对3类不同品系水稻种子的光谱进行主成分分析(PCA),结果如图3所示。前3个主成分累计贡献率为99.93%(PC1,PC2,PC3的贡献率分别为86.4%,12.8%,0.73%),解释了绝大部分变量。由图3可知,3类水稻种子成簇分布,仅有少部分重叠区域,表明3类水稻种子在PCA三维得分图中存在分类趋势,可进一步建立分类模型对不同品系的水稻种子进行鉴定。

图3 3类不同品系杂交稻种的PCA 3D得分图
2.4 特征波长的选择
全波段光谱数据量大,建模复杂,因此,本文采用SPA算法提取特征波长以减少建模变量,提高建模速度。将选择的特征波长数量范围设置为5~20,共得到7个特征波长,分别为985.08、1 106、1 203.55、1 399.04、1 463.19、1 601.81、1 645.82 nm。近红外光谱由分子内部振动光谱的倍频与合频产生,包含多数有机物的分子结构和组成信息,能够反映组成分子的含氢基团X-H(X为N、O、C、S等)的振动[28]。本文提取的特征波长与分子官能团中的N-H基团(1 000 nm及1 400~1 800 nm附近[29],)、C-H基团(1 050~1 200 nm附近[29];1 300~1 500 nm附近[29])及NH3+基团(1 400 nm附近[30])的振动较为接近,表明所选特征波长具有一定的代表性,可用于建立有效可靠的判别分析模型。
2.5 判别分析模型比较
基于全波段的光谱及特征波长建立PLS-DA和SVM判别分析模型,并以识别正确率作为模型性能的评价指标,模型的判别结果如表2所示。

表2 基于全谱及特征波长的PLS-DA和SVM判别结果
注:PLS-DA模型的参变量是隐含变量(LVs)个数;SVM模型的参变量是惩罚系数和松弛系数,表示为(,)。
Note: PLS-DA model’s parameter means the optimal number of LVs; SVM model’s parameter means different penalty parameters () and kernel function parameters (),shown as (,).
由表2可知,基于光谱数据的判别分析模型识别效果较好,其中基于全波段光谱的SVM模型识别效果最佳,建模集和预测集的识别率达到了99.67%和97.11%。对2种判别分析方法进行比较发现,SVM的判别效果优于PLS-DA,这可能是因为SVM模型采用径向基函数(RBF)作为核函数,并在寻优范围内进行网格搜索,能获取全局最优(,)参数组合且泛化能力强。对比分析基于全谱和特征波长的判别模型可知,在采用特征波长建立判别模型后,模型的判别效果有所下降。但基于特征波长的分类模型识别率均在90%以上,说明选择的特征波长有效可靠,这为水稻品系的在线检测提供了参考依据。
结果表明,采用近红外高光谱技术结合化学计量学方法可以快速有效的识别不同品系的水稻种子,尤其SVM模型识别效果较好。
2.6 基于SPA-SVM的可视化预测
高光谱图像能够同时提供样本的光谱信息和空间信息,且二者具有一定的对应关系,因此,基于样本平均光谱及对应类别值建立校正模型,可以用于待测样本的类别预测。而将此模型与图像处理技术相结合,能生成样本类别预测伪彩图,用不同颜色区分不同的样本,实现类别判定的可视化。由于全波段的光谱数据量大,计算复杂,不利于样本的快速预测。因此,本文选择基于SPA算法提取的特征波长建立的SVM模型作为校正模型,将每粒水稻种子的平均光谱作为输入,选取3类不同品系的共502粒水稻进行可视化预测,结果如图4所示。
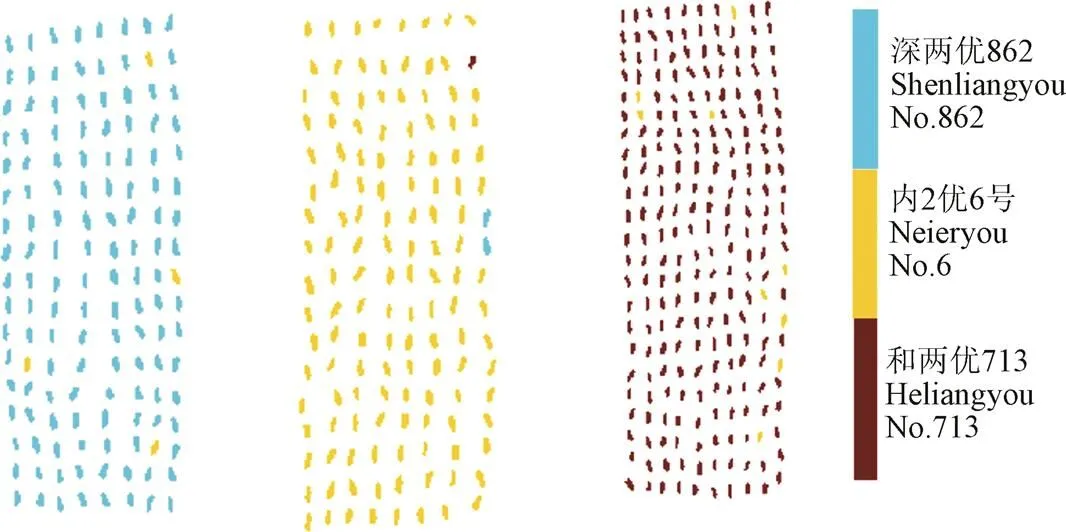
图4 不同品系杂交稻种的可视化预测图
对比分析上图可知,深两优862被判别为蓝色,内2优6号被判别为黄色,和两优713被判别为红色, 虽然有部分错判,但总体判别正确率为96.8%,判别结果较好,表明高光谱可视化伪彩图可以直观准确的鉴别3类不同品系的水稻种子。受高光谱图像分割算法以及图像分辨率的影响,可视化图中水稻种子发生一定的形变,但整体的外形特征大致维持原样,不影响鉴别分析。总的来说,高光谱可视化图可以实现单粒水稻种子的鉴别和定位,为农业育种中种子的快速精确筛选提供了新的方法。
3 结 论
本研究采用近红外高光谱成像技术鉴别3类不同品系的水稻种子。选取1 800粒水稻种子作为建模集,900粒种子作为预测集,采用SPA算法选取7个特征波长,建立基于全波段以及特征波长的PLS-DA和SVM分类模型,其中基于全波段的SVM模型判别效果最佳,建模集和预测集的识别率分别为99.67%和97.11%。利用SPA-SVM模型结合图像处理技术生成类别预测伪彩图,鉴别不同品系的水稻种子。结果表明,近红外高光谱成像技术结合化学计量学方法以及图像处理技术可以实现不同品系水稻种子的可视化预测,为农业育种中种子的快速筛选提供思路和帮助。
[1] 程本义,夏俊辉,沈伟峰. 长江中下游稻区籼型两系与三系杂交水稻组合的比较分析[J]. 杂交水稻,2009,24(5):61-65.
Cheng Benyi, Xia Junhui, Shen Weifeng. Comparison analysis between two-line and three-line indica hybrid rice combinations in the middle and down area of the Yangtse Valley of China[J]. Hybrid Rice, 2009, 24(5): 61-65. (in Chinese with English abstract)
[2] 吴翔,张卫正,陆江锋,等. 基于高光谱技术的玉米种子可视化鉴别研究[J]. 光谱学与光谱分析,2016,36(2):511-514.
Wu Xiang, Zhang Weizheng, Lu Jiangfeng, et al. Study on visual identification of corn seeds based on hyperspectral imaging technology[J]. Spectroscopy and Spectral Analysis, 2016, 36(2): 511-514. (in Chinese with English abstract)
[3] 柴玉华,毕文佳,谭克竹,等. 基于高光谱图像技术的大豆品种无损鉴别[J]. 东北农业大学学报,2016,47(3):86-93.
Chai Yuhua, Bi Wenjia, Tan Kezhu, et al. Nondestructive identification of soybean seed varieties based on hyperspectral image technology[J]. Journal of Northeast Agricultural University, 2016, 47(3): 86-93. (in Chinese with English abstract)
[4] Shrestha S, Knapič M, Žibrat U, et al. Single seed near-infrared hyperspectral imaging in determining tomato (L) seed quality in association with multivariate data analysis[J]. Sensors & Actuators B Chemical, 2016, 237: 1027-1034.
[5] Huang M, Tang J, Yang B, et al. Classification of maize seeds of different years based on hyperspectral imaging and model updating[J]. Computers & Electronics in Agriculture, 2016, 122: 139-145.
[6] Yang S, Zhu Q B, Huang M, et al. Hyperspectral image-based variety discrimination of maize seeds by using a multi-model strategy coupled with unsupervised joint skewness-based wavelength selection algorithm[J]. Food Analytical Methods, 2017, 10(2): 424-433.
[7] Williams P J, Kucheryavskiy S. Classification of maize kernels using nir hyperspectral imaging[J]. Food Chemistry, 2016, 209: 131-138.
[8] Zhang X, Fei L, Yong H, et al. Application of hyperspectral imaging and chemometric calibrations for variety discrimination of maize seeds[J]. Sensors, 2012, 12(12): 17234-17246.
[9] Kong W, Zhang C, Liu F, et al. Rice seed cultivar identification using near-infrared hyperspectral imaging and multivariate data analysis[J]. Sensors, 2013, 13(7): 8916-8927.
[10] 何勇. 光谱及成像技术在农业中的应用[M]. 北京:科学出版社,2015.
[11] 张保华,李江波,樊书祥,等. 高光谱成像技术在果蔬品质与安全无损检测中的原理及应用[J]. 光谱学与光谱分析,2014,34(10):2743-2751.
Zhang Baohua, Li Jiangbo, Fan Shuxiang, et a1. Principles and applications of hyperspectral imaging technique in quality and safety inspection of fruits and vegetables[J]. Spectroscopy and Spectral Analysis, 2014, 34(10): 2743-2751. (in Chinese with English abstract)
[12] 刘民法,张令标,何建国,等. 基于高光谱成像技术的长枣表面农药残留无损检测[J]. 食品与机械,2014,30(5):87-92.
Liu Minfa, Zhang Lingbiao, He Jianguo, et a1. Study on non-destructive detection of pesticide residues on Lingwu long jujubes’ surface using hyperspectral imaging[J]. Food & Machinery, 2014, 30(5): 87-92. (in Chinese with English abstract).
[13] Wu D, Sun D W. Advanced applications of hyperspectral imaging technology for food quality and safety analysis and assessment: A review — Part II: Applications[J]. Innovative Food Science & Emerging Technologies, 2013, 19(1): 15-28.
[14] 于雷,洪永胜,周勇,等. 高光谱估算土壤有机质含量的波长变量筛选方法[J]. 农业工程学报,2016,32(13):95-102.
Yu Lei, Hong Yongsheng, Zhou Yong, et al. Wavelength variable selection methods for estimation of soil organic matter content using hyperspectral technique[J]. Transactions of the Chinese Society of Agricultural Engineering (Transactions of the CSAE), 2016, 32(13): 95-102. (in Chinese with English abstract).
[15] 冯雷,陈双双,冯斌,等. 基于光谱技术的大豆豆荚炭疽病早期鉴别方法[J]. 农业工程学报,2012,28(1):139-144.
Feng Lei, Chen Shuangshuang, Feng Bin, et al. Early detection of soybean pod anthracnose based on spectrum technology[J]. Transactions of the Chinese Society of Agricultural Engineering (Transactions of the CSAE), 2012, 28(1): 139-144. (in Chinese with English abstract).
[16] Fan S, Huang W, Guo Z, et al. Prediction of soluble solids content and firmness of pears using hyperspectral reflectance imaging[J]. Food Analytical Methods, 2015, 8(8): 1936-1946.
[17] Skrobot V L, Castro E V R, Pereira R C C, et al. Use of principal component analysis (PCA) and linear discriminant analysis (LDA) in gas chromatographic (GC) data in the investigation of gasoline adulteration[J]. Energy & Fuels, 2016, 21(6): 5-19.
[18] Jung Y M. Principal component analysis based two-dimensional (PCA-2D) correlation spectroscopy: PCA denoising for 2D correlation spectroscopy[J]. Bulletin of the Korean Chemical Society, 2003, 24(9): 1345-1350.
[19] Ballabio D, Consonni V. Classification tools in chemistry. Part 1: linear models. PLS-DA[J]. Analytical Methods, 2013, 5(16): 3790-3798.
[20] Silva V A G D, Talhavini M, Peixoto I C F, et al. Non-destructive identification of different types and brands of blue pen inks in cursive handwriting by visible spectroscopy and PLS-DA for forensic analysis[J]. Microchemical Journal, 2014, 116: 235-243.
[21] Grasel F S, Ferrão M F. A rapid and non-invasive method for the classification of natural tannin extracts by near-infrared spectroscopy and PLS-DA[J]. Analytical Methods, 2016, 8(3): 644-649.
[22] Hobro A J, Kuligowski J, Döll M, et al. Differentiation of walnut wood species and steam treatment using ATR-FTIR and partial least squares discriminant analysis (PLS-DA) [J]. Analytical & Bioanalytical Chemistry, 2010, 398(6): 2713-2722.
[23] 张初,刘飞,孔汶汶,等. 利用近红外高光谱图像技术快速鉴别西瓜种子品种[J]. 农业工程学报,2013,29(20):270-277.
Zhang Chu, Liu Fei, Kong Wenwen, et al. Fast identification of watermelon seed variety using near infrared hyperspectral imaging technology[J]. Transactions of the Chinese Society of Agricultural Engineering (Transactions of the CSAE), 2013, 29(20): 270-277. (in Chinese with English abstract)
[24] 程术希,孔汶汶,张初,等. 高光谱与机器学习相结合的大白菜种子品种鉴别研究[J]. 光谱学与光谱分析,2014,34(9):2519-2522.
Cheng Shuxi, Kong Wenwen, Zhang Chu, et al. Variety recognition of Chinese cabbage seeds by hyperspectral imaging combined with machine learning[J]. Spectroscopy and Spectral Analysis, 2014, 34(9): 2519-2522. (in Chinese with English abstract).
[25] Liu C, Liu W, Lu X, et al. Nondestructive determination of transgenicrice seeds (L.) using multispectral imaging and chemometric methods[J]. Food Chemistry, 2014, 153(12): 87-93.
[26] Tao D, Xiao Z, Zhang F, et al. Cloth defect classification method based on SVM[J]. International Journal of Digital Content Technology & Its Applications, 2013, 7(3): 614-622.
[27] Feng X, Zhao Y, Zhang C, et al. Discrimination of transgenic maize kernel using NIR hyperspectral imaging and multivariate data analysis[J]. Sensors, 2017, 17(8): 1894.
[28] Fearn T. Standardisation and calibration transfer for near infrared instruments: A review[J]. Journal of Near Infrared Spectroscopy, 2001, 9(1): 229-244.
[29] 陶琳丽,黄伟,杨秀娟,等. 20种氨基酸近红外光谱及其分子结构的相关性[J]. 光谱学与光谱分析,2016,36(9):2766-2773.
Tao Linli, Huang Wei, Yang Xiujuan, et al. Correlations between near infrared spectra and molecular structures of 20 standard amino acids[J]. Spectroscopy and Spectral Analysis, 2016, 36(9): 2766-2773. (in Chinese with English abstract)
[30] Selvaraju K, Kirubavathi K, Kumararaman S. Growth and characterization of a new semi-organic nonlinear optical crystal: Thiosemicarbazide cadmium acetate[J]. Journal of Minerals & Materials Characterization & Engineering, 2012, 11(3): 303-310.
刘小丹,冯旭萍,刘 飞,何 勇.基于近红外高光谱成像技术鉴别杂交稻品系[J]. 农业工程学报,2017,33(22):189-194. doi:10.11975/j.issn.1002-6819.2017.22.024 http://www.tcsae.org
Liu Xiaodan, Feng Xuping, Liu Fei, He Yong. Identification of hybrid rice strain based on near-infrared hyperspectral imaging technology[J]. Transactions of the Chinese Society of Agricultural Engineering (Transactions of the CSAE), 2017, 33(22): 189-194. (in Chinese with English abstract) doi:10.11975/j.issn.1002-6819.2017.22.024 http://www.tcsae.org
Identification of hybrid rice strain based on near-infrared hyperspectral imaging technology
Liu Xiaodan, Feng Xuping, Liu Fei, He Yong※
(,,310058,)
The selection and identification of seeds are a key link in the process of agricultural breeding. In this study, near infrared (874-1 734 nm) hyperspectral imaging technology combined with chemometrics and image processing technology was successfully performed to identify and visualize strains of hybrid rice seeds. A total of 2 700 samples of 3 different strains of rice seeds were collected, and all samples were divided into the calibration set and the prediction set according to the ratio of 2:1 using the SPXY algorithm. PCA (principle component analysis) was applied to explore the separability of different rice seeds based on the spectral characteristics of rice samples, and the preliminary results demonstrated that hybrid rice seeds of 3 different strains showed a trend of classification. The full spectrum has a large data volume, and contains a large amount of redundant and collinear information, which would affect the accuracy and calculation speed of the model. Since the optimal wavelength selection can help to extract important information from the whole data to improve the performance of the model while simplifying it, we adopted SPA (successive projections algorithm) to select sensitive wavelengths. Seven sensitive wavelengths (985.08, 1 106, 1 203.55, 1 399.04, 1 463.19, 1 601.81, 1 645.82 nm) were determined from the range of 975-1 646 nm, and these wavelengths were related to functional groups in molecules (N-H, C-H, NH3+), which indicated the reliability of the selected wavelength for modeling. Partial least squares-discriminant analysis (PLS-DA) and support vector machine (SVM) were applied to build the classification models based on the full spectra and optimal wavelengths, and an excellent classification was achieved, with the classification accuracy of over 90% for all models. The SVM model performed better than PLS-DA, and especially the full spectrum-based SVM model achieved outstanding identification results, with 99.67% classification accuracy for calibration set and 97.11% for prediction set. Compared with full spectrum-based models, optimal wavelengths-based models performed relatively worse, but still offered correct discrimination rates of over 90.22%. This results revealed that the selected wavelength is effective and reliable, which can provide a reference for on-line discrimination of different strains of hybrid rice seeds. Combined with image processing technology,the visual prediction map could be generated by inputting the average spectra of each rice seed into the SPA-SVM model, and different colors would be employed to represent different kinds of seeds. It showed that the visual analysis of the sample could intuitively identify rice seeds of different strains by these methods. The overall results indicated that near infrared hyperspectral imaging technology can be used to identify and visually predict hybrid rice seeds. This research provides a new way for rapid screening and identification of seeds in the process of agricultural breeding.
image processing; spectral analysis; nondestructive detection; hyperspectral imaging; rice seed; SPA
10.11975/j.issn.1002-6819.2017.22.024
TP391.4
A
1002-6819(2017)-22-0189-06
2017-06-29
2017-09-20
国家重大仪器设备开发专项(2014YQ470377),国家十三五重点研发计划(2016YFD0200603)
刘小丹,女,博士生,研究方向为数字农业信息获取与检测技术的研究。Email:xdlww@zju.edu.cn
何 勇,男,教授,博士生导师,研究方向为数字农业,3S技术与农业物联网等方面研究。Email:yhe@zju.edu.cn
猜你喜欢
阅读(科学探秘)(2021年8期)2021-09-01
作物研究(2021年2期)2021-04-26
今日农业(2020年14期)2020-12-14
现代农村科技(2020年9期)2020-09-08
云南农业(2020年4期)2020-05-16
云南农业科技(2019年2期)2019-04-04
中南大学学报(自然科学版)(2016年2期)2017-01-19
中国照明(2016年4期)2016-05-17
中国当代医药(2015年26期)2015-03-01
作物研究(2014年6期)2014-03-01
