
Burden of road traffic accidents in Nepal by calculating disability- adjusted life years
2017-12-21 07:18LingHuangAmodPoudyalNanpingWangRameshMaharjanKrishnaAdhikarySharadOnta
Ling Huang, Amod K. Poudyal, Nanping Wang, Ramesh K. Maharjan, Krishna P. Adhikary, Sharad R. Onta
1. Department of Preventive Medicine, Medical College of China Three Gorges University,Yichang, China
2. Department of Community Medicine and Public Health, Institute of Medicine at Tribhuvan University, Kathmandu, Nepal
3. Department of Emergency and General Practice, Tribhuvan University Teaching Hospital,Kathmandu, Nepal
4. Nepal Health Research Council, Kathmandu, Nepal
Burden of road traffic accidents in Nepal by calculating disability- adjusted life years
Ling Huang1,2, Amod K. Poudyal2, Nanping Wang1, Ramesh K. Maharjan3, Krishna P. Adhikary4, Sharad R. Onta2
1. Department of Preventive Medicine, Medical College of China Three Gorges University,Yichang, China
2. Department of Community Medicine and Public Health, Institute of Medicine at Tribhuvan University, Kathmandu, Nepal
3. Department of Emergency and General Practice, Tribhuvan University Teaching Hospital,Kathmandu, Nepal
4. Nepal Health Research Council, Kathmandu, Nepal
Objective:To calculate the burden of road traffic accidents in Kathmandu Valley and then extrapolate this to the national level.Methods:A prospective study was performed to compute the burden of road traffic accidents by quantification of disability-adjusted life years (DALYs) using the Global Burden of Disease Study method on the basis of 1-year data from nine hospitals in Nepal and the Department of Forensic Medicine and cross-checked with the Nepal Traffic Directorate. Multiple methods were applied to the extrapolated population metrics of the burden of road traffic accidents in Nepal.Results:The total number of years of life lived in disability, years of life lost, and DALYs in Nepal were 38,848±194, 119,935±1464, and 158,783±1658 (95% confidence interval) respectively. The number of years lost because of morbidity and death was similar in Kathmandu Valley. Most (75%) of the DALYs resulted from years of life lost in Nepal. Males accounted for 73% of DALYs. Almost half (44%) of the DALYs were contributed by the group aged 15—29 years.Conclusion:This study is the first to calculate the burden of road traffic accidents in Nepal using Nepal’s own data. Nepal needs to develop and enhance its own system to identify significant public health issues so as to set national priorities for prevention of road traffic accidents.
Road traffic accident; burden; disability-adjusted life years; Nepal
Introduction
Valid estimation of the burden of disease(BOD) is critical for accurate ranking of disease as a global public health issue, prioritization of preventive efforts, policy development,and health service planning [1—3]. Road traffic injury (RTI) was ranked 10th among the 20 leading causes of global BOD as measured by disability-adjusted life years (DALYs) in 2000,as ninth in 2004, and as eighth in 2011 according to the World Health Organization (WHO)[4]. WHO predicted that RTI would be the fifth leading cause of death by 2030 [4]. It ranked as the leading cause of DALYs among children aged 5—14 years and in the top three leading cause of DALYs among individuals aged 15—29 years in 2000 [5]. In 2 011, it ranked as the leading cause of death for individuals aged 5—14 years and for individuals aged 15—29 years [6]. This burden at such an early age has long-term implications for quality of life and the economy of nations [5].
Some high-income and middle-income countries have studied the burden and causes of road traffic accidents(RTAs) [7—14]. Interventions have reduced the burden of RTI in those countries [8, 15, 16].
Nepal is of the countries with a high rate of RTAs.According to the Global Burden of Disease Study by WHO,Nepal was ranked as level 4, indicating the lowest level of evidence of data where the causes of death and death patterns among the three major causes of death (communicable, noncommunicable, and injuries) were unreliable. Therefore the BOD was predicted from death registration data from other countries in the same region [17]. The BOD estimation data on noncommunicable diseases for Nepal were extrapolated from rural India [18]. The BOD related to RTAs had not been estimated in Nepal. Therefore we aimed to estimate the BOD caused by RTAs on the basis of information collected for the first time in Nepal.
Rese arch method
The Global Burden of Disease Study metric known as the disability-adjusted life year (DALY), which is a summary measure to quantify the burden of diseases, injuries, and risk factors,was uses [17—20]. The DALY is based on years of life lost(YLL) from premature death and years of life lived in disability (YLD) with temporary or permanent disabilities arising from RTAs. A prospective quantitative descriptive study was conducted to compute the burden of RTAs by quantification of DALYs on the basis of 1-year prospective data from August 1,2014, to July 31, 2015, from nine hospitals that are well known for trauma treatment (Bir Hospital, Tribhuvan University Teaching Hospital, Kathmandu Medical College Teaching Hospital, Annapurna Hospital, Kathmandu Model Hospital,Patan Hospital, KIST Medical College Teaching Hospital,Nepal Medical College Teaching Hospital, and Bhaktapur Hospital) and the Department of Forensic Medicine (DoFM)of the Institute of Medicine, which is the only postmortem department in Kathmandu Valley. Morbidity data collected from hospitals in Kathmandu Valley were used to calculate YLD, and mortality data collected from DoFM were used to generate YLL. Extrapolated data were combined with multiple methods to derive population metrics of the burden of RTA in Kathmandu Valley and at the national level.
Study site and its justification for the extrapolation basis
Thi s study was undertaken in Kathmandu Valley, the political,economic, and cultural center of Nepal. It is bowl shaped, surrounded by four hill ranges. The valley consists of three districts (Kathmandu, Lalitpur and Bhaktapur) covering an area of 899 km2(Fig. 1) [21].
The population in the valley was around 2.52 million in 2015[22, 23]. It has the highest population density in the country,and is home to about 10% of Nepal’s population. Until July 1,2013, the number of registered vehicles in Baghmati Zone, which includes Kathmandu Valley, was 639,159. The annual growth rate of vehicle registration in this region ranges from 9% to 17%.Kathmandu Valley has the highest number of vehicles registered,and had the highest number of RTAs among all regions of Nepal.Major and specialty hospitals are located in Kathmandu Valley,including medical college teaching hospitals providing a high level of care. Injured patients are transported quickly to one of the hospitals in Kathmandu Valley for better treatment options.
From the estimated data reported by the Ministry of Physical Planning and Transport Management in 2013 and the published 7-year RTA data from 2004 to 2010 and recent data collected from the Traffic Directorate of Nepal Police Headquarters (TDNPH), the number of RTAs in Kathmandu Valley was (53.5±14.1)% of the number for the whole country. The number of registered vehicles in Kathmandu Valley was (52.9±3.7)% of the number in Nepal [24]. The numbers of people killed and injured in Kathmandu Valley because of RTAs were (10.94±4.58)% and (35.2±11.1)% of the numbers for whole country respectively. All confidence intervals are 95% confidence intervals. The national YLL and YLD due to RTAs were extrapolated on the basis of these proportions.
Target population
Mortality data covered all the registered deaths caused by moving vehicles in DoFM. Morbidity data covered all patients injured by moving vehicles who visited the aforementioned hospitals.
Exclusion criteria

Fig. 1. Map of Kathmandu Valley.
Any injury on the road without the involvement of a vehicle or injury involving a stationary vehicle was excluded. RTAs that occurred outside Kathmandu Valley but in which individuals were injured and were treated in the selected nine hospitals were excluded from the study.
Tools and techniques for data collection
Inventory sheets were designed to collect data from hospitals and DoFM, and were verified with TDNPH. In each selected hospital, either trained research assistants or available physicians who were willing to assist in this research were assigned to collect data from the hospitals. The principal investigator was responsible for rechecking all the missing data with the hospitals’ record books and collecting data from DoFM and TDNPH.
Data management and analysis
Records from hospitals were collected from the research assistants and checked by the principal investigator every week during the first month of the study period and once every 2 week afterward. Data from DoFM and TDNPH were collected once a month. Hospital data were first entered into Epidata version 3.1 and then exported into Microsoft Excel 2007; postmortem data were directly entered into Microsoft Excel 2007. BOD was calculated by DALYs through four different social weighing and three life expectancies based on basic formulae.
Statistical methods and basic formulae
The Global Burden of Disease Study approach for calculating DALYs was adopted, with use of the published formulae[25]. DALYs are composed of YLD and YLL from premature death.
Disability weighting:This was classified following the method of the WHO Global Burden of Disease Study, and was divided into 13 main categories. The disability weighting(DW) for each kind of injury was obtained from 2010 Global Burden of Disease Study Annex Table E [17]; this does not include the DW of internal organ injury, so we took the appropriate DW (0.208) from a study from Thailand [7]. Other categories of injury from RTAs but not in the table, such as abrasion, nasal epitasis without other injury, and missing teeth,were given the lowest DW (0.009). All the RTA cases recorded by hospitals followed treated group DW categories.
Estimate s were disaggregated by sex and different age groups: 0—4 years, 5—14 years, 15—29 years, 30—49 years,50—69 years, and 70 years and older.
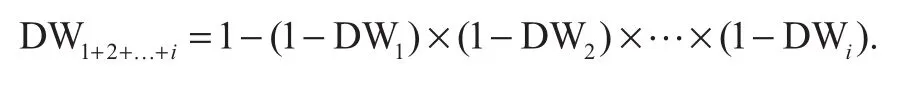
Comorbidity adjustment:For those RTA patients who had more than one injury, the combined DW for individuals was estimated under the assumption of a multiplicative model as follows [17]:
Social weighting:Given the lack of consensus on social weighting, different social value choices were applied [25].We calculated DALYs under three different scenarios for comparison with other studies: (1) no age weighting and no time discount, which was applied in the 2010 Global Burden of Disease Study [17], and the result calculated by this method was used for age and sex classification in this study;(2) age weighting and 3% time discount, as used in the 1990 Global Burden of Disease Study and the 2004 Global Burden of Disease Study [19]; (3) no age weight but 3% time discount, as used in the 2001 Global Burden of Disease Study [3].
The standard age weighting formula isCxe-βx, wherexis the age, andCand β are constants commonly with values of 0.1658 and 0.04. The standard time discounting formula is as follows: e-r(x-a), whereris the discount rate,xis the age concerned, anda, the age to which the burden will be assigned.Time discounting discounts years of healthy life lived in the future at the rate of 3%. Sor=0.03 when time discounting is applied.
Combing both social weighting functions gives the following extended YLD and YLL formulae:
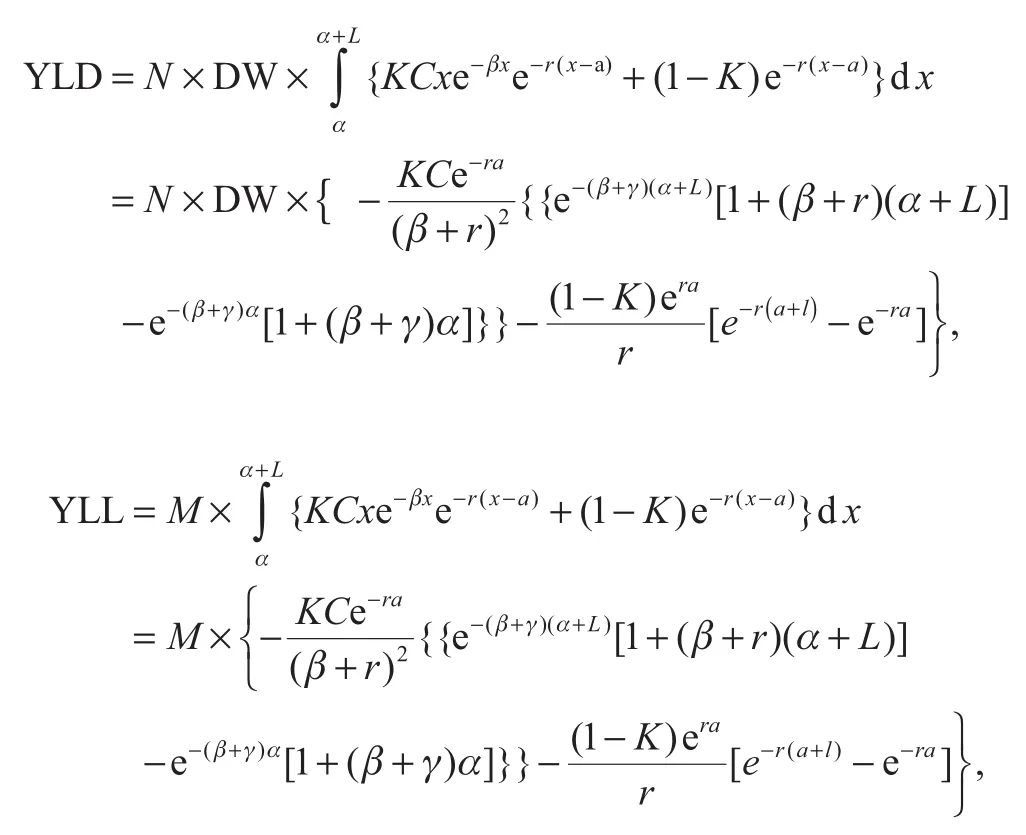
whereNis the number of cases,Mis the number of deaths,Kis a modulating factor equaling 1 if age weighting is applied and 0 otherwise, andAandLrepresent, respectively, the age at onset and the duration or the age at death and the life expectancy at the age of death. In this article the duration for each injury is assumed to be the same as that from research done in Thailand [7]. We calculated YLL and YLD for individual cases and total cases.
Even though the 2010 Global Burden of Disease Study simplified the calculation of DALYs, the DALY estimation was computed in different scenarios for comparison and decisions by researchers and policy makers.
Results
RTA incidence
Hospital records identified 3461 individuals with RTIs, and DoFM recorded 274 deaths caused by RTAs in 2014—2015[26]. Because of exclusions for unknown age, unknown sex,duplicated patients, unspecified injuries, and death or injuries that occurred outside Kathmandu Valley, the number of individuals for calculation of YLD from these nine hospitals was 3422 and the number of individuals for calculation of YLL was 262.
Almost all of the RTAs involving patients who visited the hospitals were reported to the police. According to TDNPH records, 3876 people were injured and 133 died because of RTAs during the study period. Therefore the study hospitals captured around 89.3% (3461/3876=89.3%) of all RTA cases in Kathmandu Valley.
Moreover, the number of deaths collected from DoFM was applied to analyze YLL because it is the first-hand source in this research. The total number of people involved in RTAs was 4138 (3876 injured plus 262 who died) in Kathmandu Valley in the 1-year study period, resulting in 164 victims of RTAs per 100,000 inhabitants, corresponding to a death rate of 10 per 100,000 population and an injury rate at 154 per 100,000 population [23]. The ratio of deaths t o injuries was 1:14.7.
YLL YLD, and DALYs by different Global Burden of Disease Study methods in Kathmandu Va lley and at the national level.
From different Global Burden of Disease Study methods, the YLL, YLD, and DALYs were different. The results were similar by the1990 Global Burden of Disease Study, 2001 Global Burden of Disease Study, and 2004 Global Burden of Disease Study methods. However, the burden increased by around two times with use of the 2010 Global Burden of Disease Study method, which has no age and time discounting (Table 1).
As DALYs were explicitly defined as quantifying loss of health rather than the social value of loss of health [27], we applied the result obtained with the 2010 Global Burden of Disease Study method which has no age and time discounting to extrapolate the burden of RTAs in Kathmandu Valley and Nepal.
The total YLD, YLL, and DALYs in Kathmandu Valley estimated by the 2010 Global Burden of Disease Study method were 13,671, 13,121, and 26,792 respectively. The value of YLD, YLL and DALY for each sex and age group are listed in Table 2. The total YLD, YLL, and DALYs caused by RTAs were 38,848±388, 119,935±2918, and 158,783±3316 (95%confidence interval) respectively in Nepal during the period from 2014 to 2015, and 76% of the DALYs were from YLL.Males accounted for 73% of DALYs. The rates of YLD, YLL and DALY per 100,000 inhabitants were 139, 428, and 567 respectively. The YLL was three times higher than the YLD.The DALYs per 100,000 population were around three times higher than for females.
For males, most of the YLD and YLL were from the 15—29-year-old age group, followed by the 30—49-year-old and 5—14-year-old age groups irrespective of which life standard tables were used and irrespective of application of social weighting or time discounting. For females, the YLD proportion of each age group was similar to that for males, but for YLL, the highest rate was for the 30—49-year-old age group, followed by the 15—29-year-old and 0—4-year-old age groups (Table 3).
For the DALYs for both sexes, the rates with regard to the age groups were in the following descending order: 15—29 years (43.7%), 30—49 years (28.1%), 5—14 years (11.6%), 50—69 years (8.6%), 0—4 years (6.3%), and 70 years and older (1.0%).
Discussion
We have calculated the YLD, YLL, and DALYs caused by RTAs for the first time in Nepal. The findings revealed that most of the RTA burden came from death. YLL account for 76% of DALYs. YLL are so high in Nepal because most of the roads in Nepal are located in hilly or mountainous regions,where if an the accident occurs, there is a very low chance of survival. It is also very difficult for postcrash health services to reach the RTA spot [28].
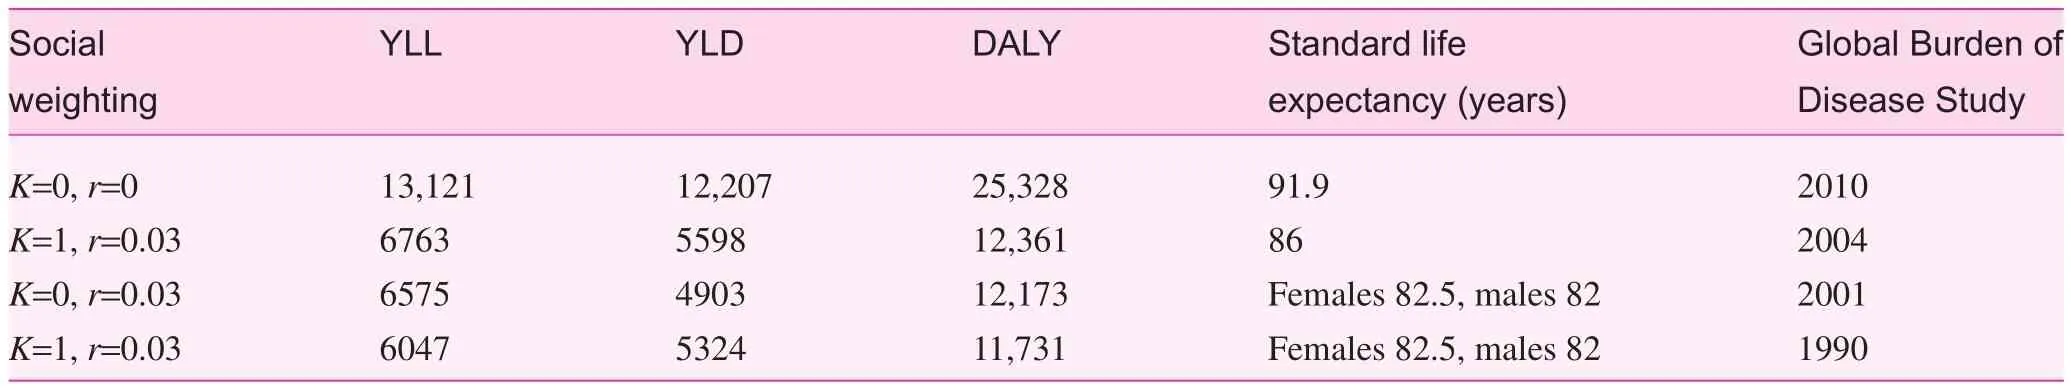
Table 1. Direct burden of road traffic accidents by years of life lived in disability, years of life lost, and disability-adjusted life years obtained with different Global Burden of Disease Study methods
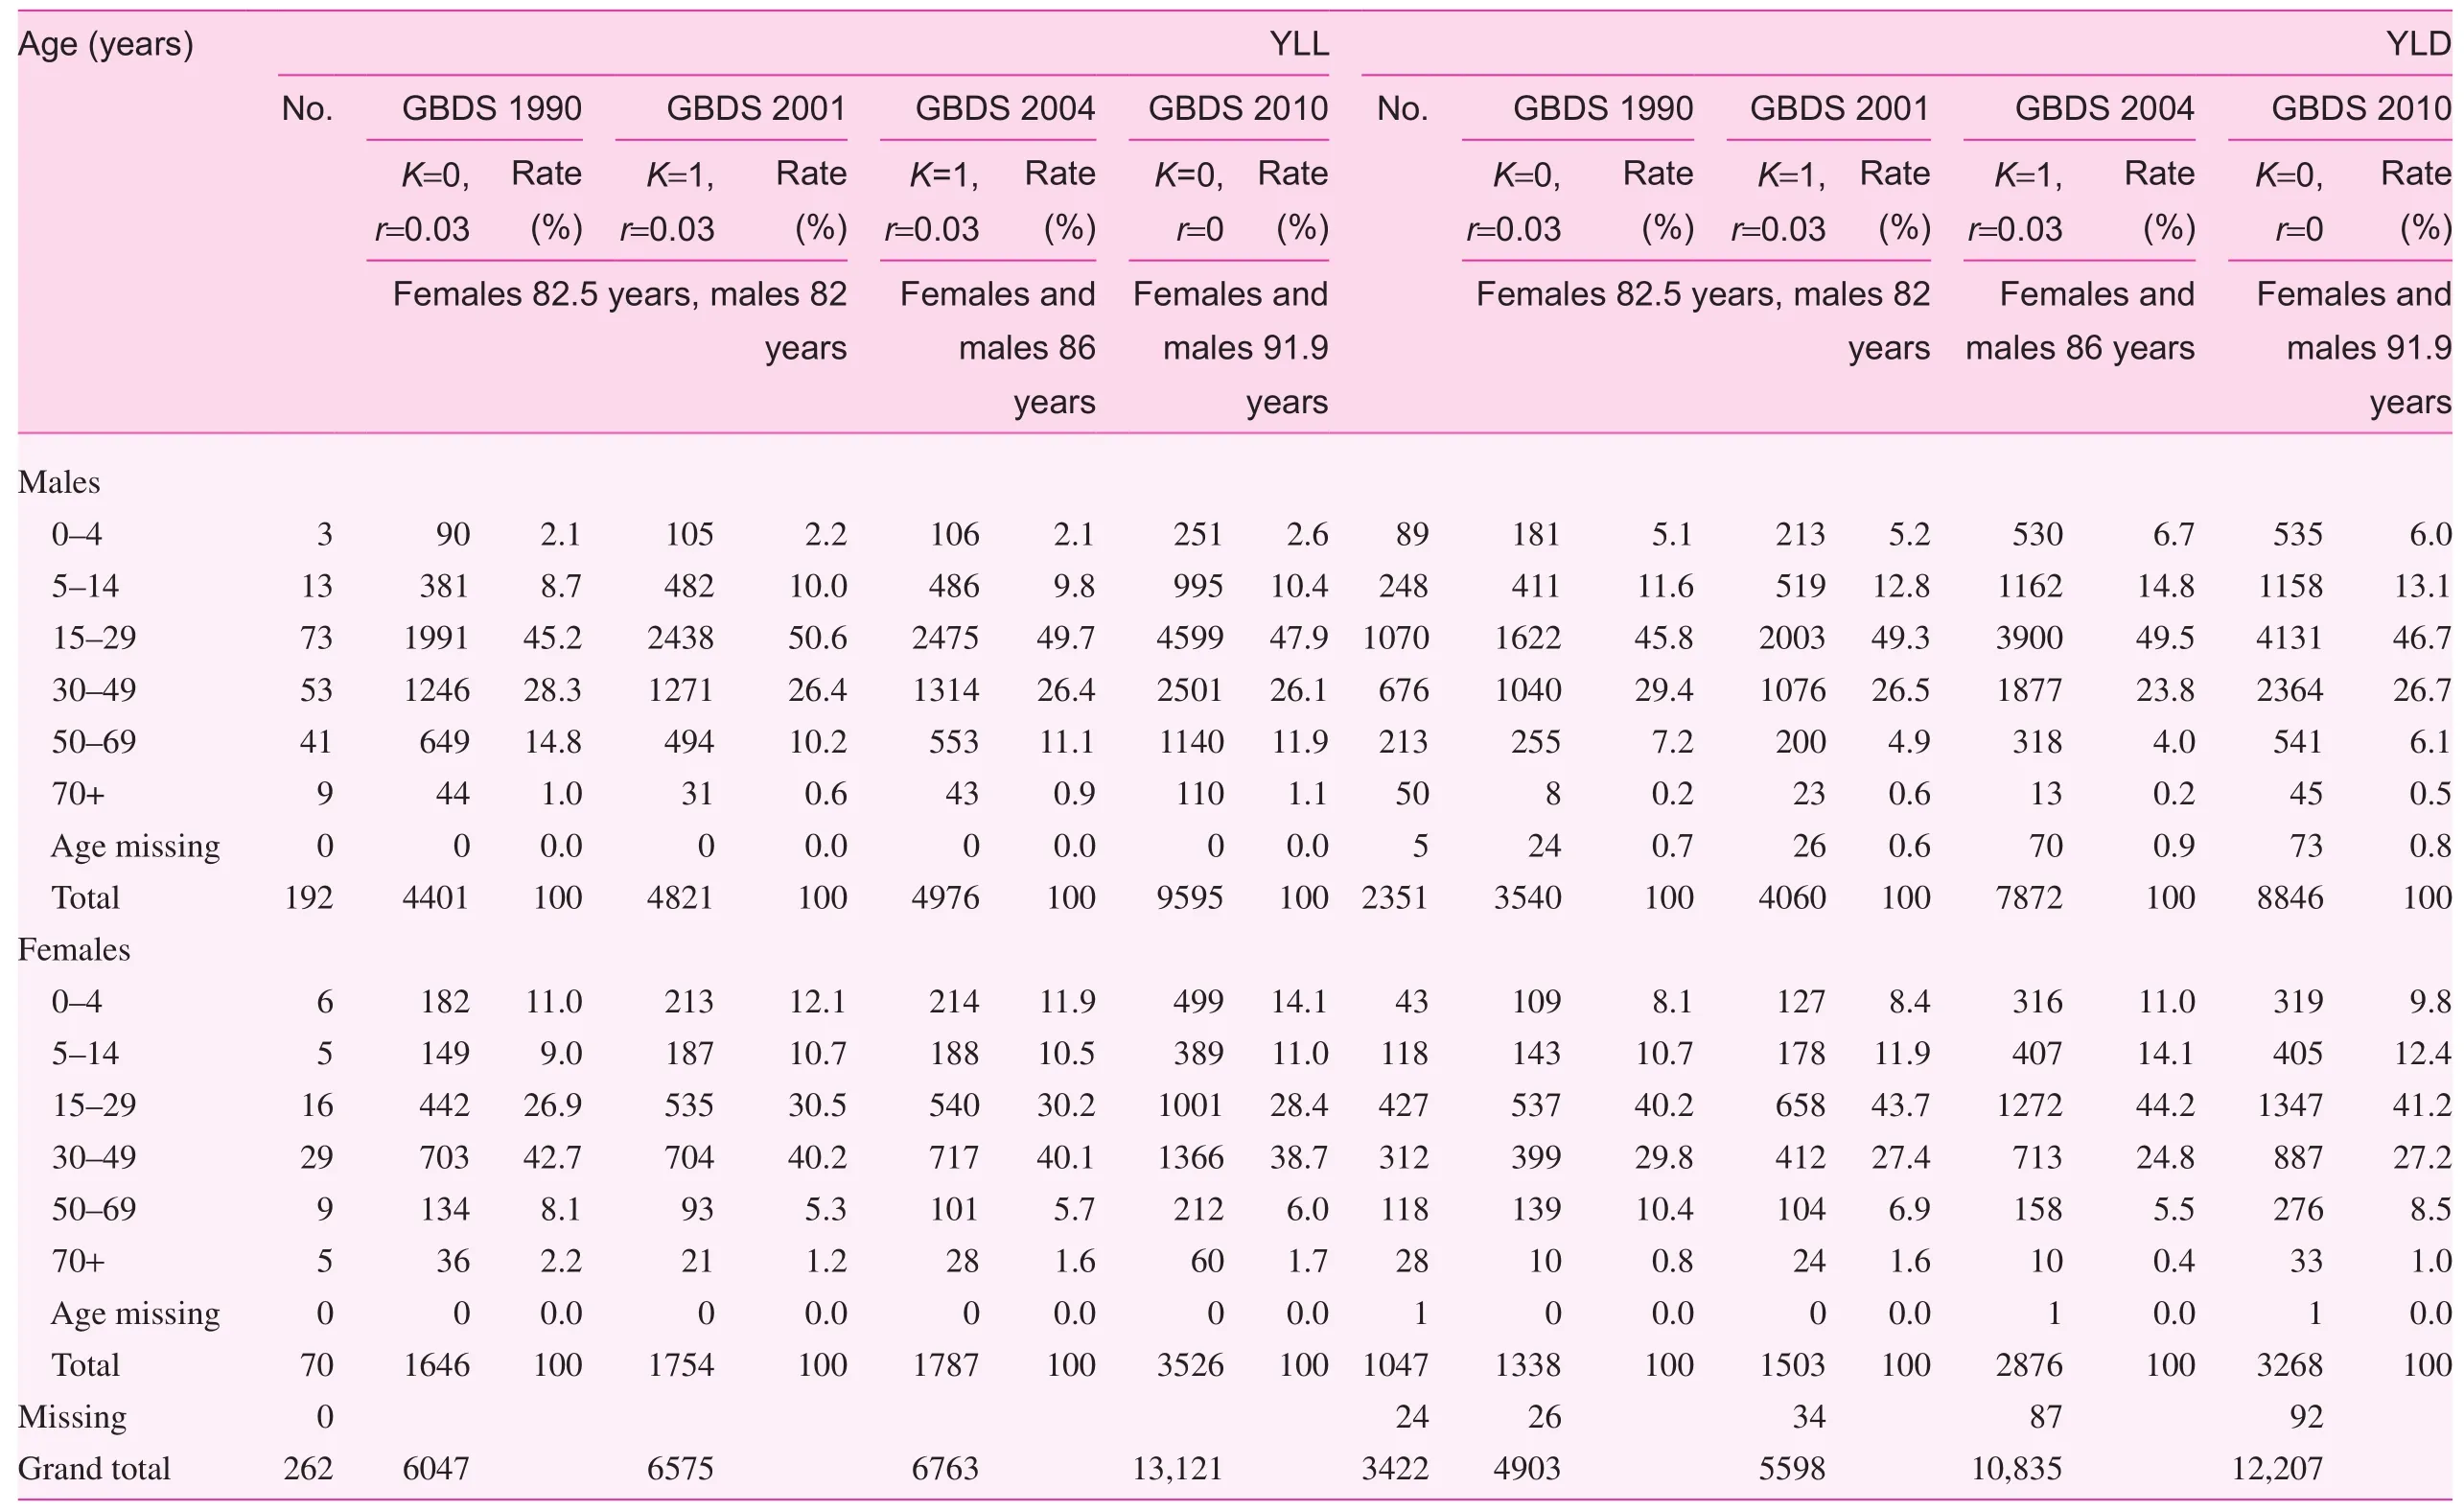
Table 2. One-year years of life lost from the postmortem department and years of life lived in disability from nine hospitals in Kathmandu Valley during 2014—2015.

Table 3. Extrapolated years of life lived in disability, years of life lost, and disability-adjusted life years at the national level by age and sex in 2014—2015
In Kathmandu Valley, the values of YLD and YLL are almost similar. Because the roads are relatively smooth in Kathmandu Valley, and most of the advanced medical services of Nepal are located inside the valley.
The findings also highlight sex and age differences. The major burden was from young males, especially for the 15—29-year-old age group. This may be due to the young male generation enjoying speed and furor. For females,the 30—49-year-old age group has the highest rate of YLL.This age group of females was more exposed to social and religious activities compared with the other female age groups. The DALYs from males were greater than those from females for every age group except the 0—4-year-old age group, for which the DALYs from females were greater than those from males. This may be because female children younger than 5 years are in less guardianship, because Nepal is a country where most of the people still value the male child only.
The estimated number of deaths due to RTAs was 2381 in Nepal during the 1-year study period. The mortality rate from RTAs in Kathmandu Valley estimated in this study was 10 per 100,000 inhabitants during 2014—2015. This was concordant with the average of fatality during the 7 years from 2004 to 2010 in the same area with a standard deviation of one. The estimated death rate per 100,000 in Nepal was 6 in this study.It was less than the world level, which is 14.2 per 100,000 as a result of RTAs [19].
There are difficulties in comparing burden of RTA studies as many did not mention which Global Burden of Disease Study method was applied. Nevertheless, the DALYs estimated from the current study are 1.2 times higher than the reported DALYs estimated in 2004. They were 1.3 times higher than in Iran [11]. The estimated rate of DALYs due to RTAs in this study was 567 per 100,000 population, which was 73 years more than the estimate by WHO in 2004 [19]. The rate of DALYs in this study was lower than that in two neighboring countries: China (624 per 100,000 population) and India (604 per 100,000 population) [19]. The average DALYs caused by RTAs at the world level in 2014—2015 have not been published yet.
The results may be underestimated because the injury cases were obtained from patients who attended hospitals. Some patients who had minor injuries may have not visited hospitals.The injury categories recorded by the physicians did not follow the codes of the 10th edition of the International Statistical Classification of Diseases and Related Health Problems, and all diagnoses for each case were grouped into the 13-injury categories prepared by the research team.
We applied the 2010 Global Burden of Disease Study DW measurement approach. But we did not follow up the study;if the injured patients died of sequelae, that would reduce life expectancy. Therefore delayed deaths were not counted in the total number of YLL. Then the total burden of RTAs might be underestimated.
Another limitation of this study is that DALYs from RTAs were estimated on the basis of 1 year of hospital data and data from DoFM rather than prevalence, which could reflect the current prevalent burden of RTAs. So the result will underestimate the real burden. However, the 1-year burden of RTAs in Kathmandu Valley and Nepal can be provided by this study.
Conclusion
In Nepal, the grand estimated DALYs due to RTAs was 160,000; most (76%) of the DALYs were from YLL. More than 73% of DALYs resulted from males, and among the males, 73% were from the 15—49-year-old age group. This study was the first time that the burden of RTAs was calculated with use of the Global Burden of Disease Study method and Nepal’s own data rather than data adopted from the rural part of India. Lots of challenges were met in the estimation of the population burden due to RTAs because of lack of a sound recording system. Nepal needs to develop and enhance its own systems for identifying, supervising, and calculating this significant public health issue so as to set national priorities for prevention and evaluation of the effectiveness of preventive measures.
Acknowledgments
We thank Purusotam Raj Shedain, Shanta Manandhar,Sanubhai Khadka, Umila, Nhuchhe, and Budda Sulu as well as the many unnamed contributors who helped and cooperated in the collection of data.
Authorship
HL performed the collection of data, calculation of DALYs and drafted the manuscript. AP involved in calculating DALYs and correction of manuscript. RM participated in the data collection, NW and KP had translated the form of data collection and draft part of the manuscript. SO guided the research design and correcting manuscript. All authors read and approved the final manuscript.
Conflicts of interest
The authors declare no conflict of interest.
Funding
This research received no specific grant from any funding agency in the public, commercial, or not-for-profit sectors.
1. Dandona R, Kumar GA, Ameer MA, Ahmed GM, Dandona L.Incidence and burden of road traffic injuries in urban India. Inj Prev 2008;14(6):354—9.
2. Ghaffar A, Hyder AA, Masud TI. The burden of road traffic injuries in developing countries: the 1st national injury survey of Pakistan. Public Health 2004;118(3):211—7.
3. Lopez AD. Global burden of disease and risk factors. Disease Control Priorities Project. 2006, [New York, N.Y.]Washington,DC: Oxford University Press; World Bank.
4. World Health Organization. Department of Violence and Injury Prevention and Disability. Global status report on road safety:time for action. Geneva; 2009.
5. World Health Organization. Regional Office for South-East Asia.Strategic plan for injury prevention and control in South-East Asia. New Delhi: WHO Regional Office for South-East Asia;2002.
6. World Health Organization. Global status report on road safety 2013: supporting a decade of action. Geneva: World Health Organization; 2013.
7. Ditsuwan V, Veerman LJ, Barendregt JJ, Bertram M, Vos T. The national burden of road traffic injuries in Thailand. Popul Health Metr 2011;9(1):2.
8. Gabbe BJ, Lyons RA, Fitzgerald MC, Judson R, Richardson J, Cameron PA. Reduced population burden of road transportrelated major trauma after introduction of an inclusive trauma system. Ann Surg 2015;261(3):565—72.
9. Herman J, Ameratunga S, Jackson R. Burden of road traffic injuries and related risk factors in low and middle-income Pacific Island countries and territories: a systematic review of the scientific literature (TRIP 5). BMC Public Health 2012;12:479.
10. Jianping Z, Chongsuvivatwong V, Geater A. Clinical severity and financial burden among road traffic injury patients in Kunming, China. Southeast Asian J Trop Med Public Health 2006;37(5):1034—9.
11. Bhalla K, Naghavi M, Shahraz S, Bartels D, Murray CJ. Building national estimates of the burden of road traffic injuries in developing countries from all available data sources: Iran. Inj Prev 2009;15:150—6.
12. Lapostolle A, Gadegbeku B, Ndiaye A, Amoros E, Chiron M,Spira A, et al. The burden of road traffic accidents in a French departement: the description of the injuries and recent changes.BMC Public Health 2009;9:386.
13. Lyons RA, Kendrick D, Towner EM, Christie N, Macey S, Coupland C, et al. Measuring the population burden of injuries—implications for global and national estimates: a multi-centre prospective UK longitudinal study. PLoS Med 2011;8(12):e1001140.
14. Puvanachandra P, Hoe C, Özkan T, Lajunen T. Burden of road traffic injuries in Turkey. Traf fic Inj Prev 2012;13 (Suppl 1): 64—75.
1 5. Hu G, Mamady K. Alcohol-related road traffic injury and Global Burden of Disease 2010. Lancet 2013;382(9898):1092—3.
1 6. Stevenson M, Yu J, Hendrie D, Li LP, Ivers R, Zhou Y, et al.Reducing the burden of road traffic injury: translating highincome country interventions to middle-income and low-income countries. Inj Prev 2008;14(5):284—9.
1 7. WHO. WHO methods and data sources for global burden of disease estimates 2000—2011, In: Global Health Estimates Technical Paper WHO/HIS/HSI/GHE/2013.4. Geneva: Department of Health Statistics and Information Systems, WHO; 2013. p. 90.
1 8. Devleesschauwer B, Ale A, Duchateau L, Dorny P, Lake R, Dhakal P, et al. Understanding the burden of disease in Nepal: a call for local evidence. J Nepal Health Res Counc 2013;11(24):221—4.
1 9. WHO. The global burden of disease: 2004 update. Geneva:World Health Organization; 2008. p. 146.
2 0. Peden MM, McGee K, Krug E. Injury: a leading cause of the global burden of disease; 2002. Geneva: World Health Organization.
2 1. Pant PR, Dongol D. Kathmandu Valley profile, in Governance and infrastructure development challenges in the Kathmandu Valley. Kathmandu Metropolitan City, Nepal; 2009. p. 14.
2 2. World Health Organization. Born too soon: the global action report on preterm birth. Geneva: World Health Organization;2012. p. 112.
2 3. National Population and Housing Census 2011 (Population Projection 2011—2031), 2014, Central Bureau of Statistics: Kathmandu, Nepal.
24. Government of Nepal, Ministry of Physical Planning & Transport Management., Nepal Road Safety Action Plan. 2013:36.
25. Devleesschauwer B, Havelaar AH, De Noordhout CM, Haagsma JA, Praet N, Dorny P, et al. Calculating disability-adjusted life years to quantify burden of disease. Int J Public Health 2014;59(3):565—9.
26. Huang L, Adhikary KP, Choulagai BP, Wang N, Poudyal AK,Onta SR. Road traffic accident and its characteristics in Kathmandu Valley. JNMA J Nepal Med Assoc 2016;55(203):1—6.
27. Murray CJ, Vos T, Lozano R, Naghavi M, Flaxman AD,Michaud C, et al. Disability-adjusted life years (DALYs) for 291 diseases and injuries in 21 regions, 1990—2010: a systematic analysis for the Global Burden of Disease Study 2010. Lancet 2012;381(9867):628.
28. Choulagai BP, Ling H, Sharma P, Mishra SR, Ahmed M, Chand PB. Epidemiology of road traffic accidents in Nepal: data review and qualitative analysis. SM J Publc Health Epidemiol 2015;1(3):1014.
Ling Huang, PhD
Department of Community Medicine and Public Health, Institute of Medicine, Maharajgunj Campus, Tribhuvan University,Kathmandu 32812, Nepal
Tel.: +977-9840018823
E-mail: 67635230@qq.com
26 February 2017;
Accepted 27 March 2017
 Family Medicine and Community Health2017年3期
- Family Medicine and Community Health的其它文章
- Health is primary
- Assessing the accuracy of patient report of the 5As (ask, assess,advise, assist, and arrange) for smoking cessation counseling
- Mental health problems due to community violence exposure in a small urban setting
- Effect of an educational intervention and parental vaccine refusal forms on childhood vaccination rates in a clinic with a large Somali population
- Tobacco cessation pharmacotherapy use among racial/ethnic minorities in the United States: Considerations for primary care
- Understanding cultures beyond medicine