
Supplementary materials
2019-01-18 02:01
The National Central Cancer Registry of China (NCCRC) is responsible for collecting data from local population-based cancer registries and evaluating and publishing national cancer statistics of China. Every cancer registry collects records of cancer patients from hospitals, community health service centers, the death surveillance system and the Basic Medical Insurances for Urban Residents and the New-Rural Cooperative Medical System. The information for each new cancer patient was collected including personal identification number, age at diagnosis, gender, date of diagnosis, cancer site, and basis of diagnosis, and so on. By 1 June 2017, 449 cancer registries from all 31 provinces submitted incidence and mortality data of 2014 to NCCRC, which covered 345,711,646 population, accounting for about 25.27% of the national population.All cancer cases were coded according to the International Classification of Diseases for Oncology, 3rd edition (ICD-O-3)and the International Statistical Classification of Diseases and Related Health Problems 10th Revision (ICD-10).
All data submitted to NCCRC were under quality control based on the criteria of “Guideline for Chinese Cancer Registration” and “Cancer Incidence in Five Continents Volume IX” by International Agency for Research on Cancer(IARC)/International Association of Cancer Registries (IACR). Briefly, the completeness, comparability and validity of the data were evaluated using a series of standards including the mortality to incidence (M/I) ratio, the percentage of cases morphologically verified (MV%), the percentage of death certificate-only cases (DCO%), and stability of cancer statistics over years. Questionable records were returned to the local registries for data check and correction. Data classified as category A or B were deemed acceptable for inclusion in the study. After quality control, 339 registries’ data from 31 provinces which met the criteria were included in this analysis. The detailed distribution of the 339 cancer registries were shown in Supplementary Figure S1. Of the 339 cancer registries, 129 were located in urban areas (covered 144,061,915 population) and 210 were in rural areas (covered 144,181,432 population). The overall population covered about 288,243,347 population (146,203,891 males and 142,039,456 females), accounting for 21.07% of national population in China in 2014.
Crude incidence and mortality rates of liver cancers were calculated by area (urban/rural), gender (male/female) and age groups (0, 1-4, 5 to 80 by 5 years, 85+) using the 339 cancer registries’ data. We estimated the numbers of new cancer cases and deaths in China in 2014 by applying age-specific incidence rates from 339 cancer registries in 2014 to the national agespecific population. The age-specific incidence rates from 339 cancer registries multiplied by the corresponding estimated age-specific population in each stratum and added them up to calculate the estimated numbers of new cases of cancer incidence and deaths. The national population data by five-year age group and sex were obtained from statistics or public security census (http://data.stats.gov.cn/), with about 1,367.82 million population in 2014 in China (749.16 million population in urban areas and 618.66 million population in rural areas). Each cancer registry provided population data in the respective areas to the NCCRC. These data were sourced from local Statistical or Public Security Bureaus, or from calculations based on census data. The world standard population (Segi’s population) was used for age-standardized rates.
Temporal trends in incidence and mortality from 2000 to 2014 were examined by fitting joinpoint models(https://surveillance.cancer.gov/joinpoint/) to the age-standardized rates (per 100,000 population) using data from 22 cancer registries of China. Those 22 cancer registries were established for more than 15 years and represented overall 3.34% of the Chinese population, standardized according to the world standard population. To reduce the possibility of reporting spurious changes in trends over the period, all models were restricted to a maximum of 2 joinpoints (3 line segments). Trends were expressed as an annual percentage change (APC) and the Z test was used to assess whether the APC was statistically different from zero. In describing trends, the terms “increase” or “decrease” were used when the slope (APC) of the trend was statistically significant (P<0.05). For non-statistically significant trends, the term “stable” were used.
Etiology splits
To find the proportion of liver cancer cases due to the six etiology groups included ever-smoking, hepatitis B, hepatitis C,alcohol, excess body weight and other causes. Data on tobacco smoking, past-year alcohol drinking, body mass indexes (BMI)were obtained from the China National Nutrition and Health Survey 2002 (1). Relative risks for the association between
ever-smoking, or ever-alcohol drinking and cancer were mostly obtained from prospective studies in China or from metaanalyses that had examined the associations in China or Asia, and when these were not available, from other sources. Relative risks for overweight were obtained from meta-analyses of studies worldwide because relative risks from large-scale studies in China were scarce. Relative risks for infections and cancer were mostly obtained from an analysis of global cancer burden of infections (2,3). The result has been described in detail elsewhere (4).

Figure S1 Distribution of 339 selected cancer registries in China.
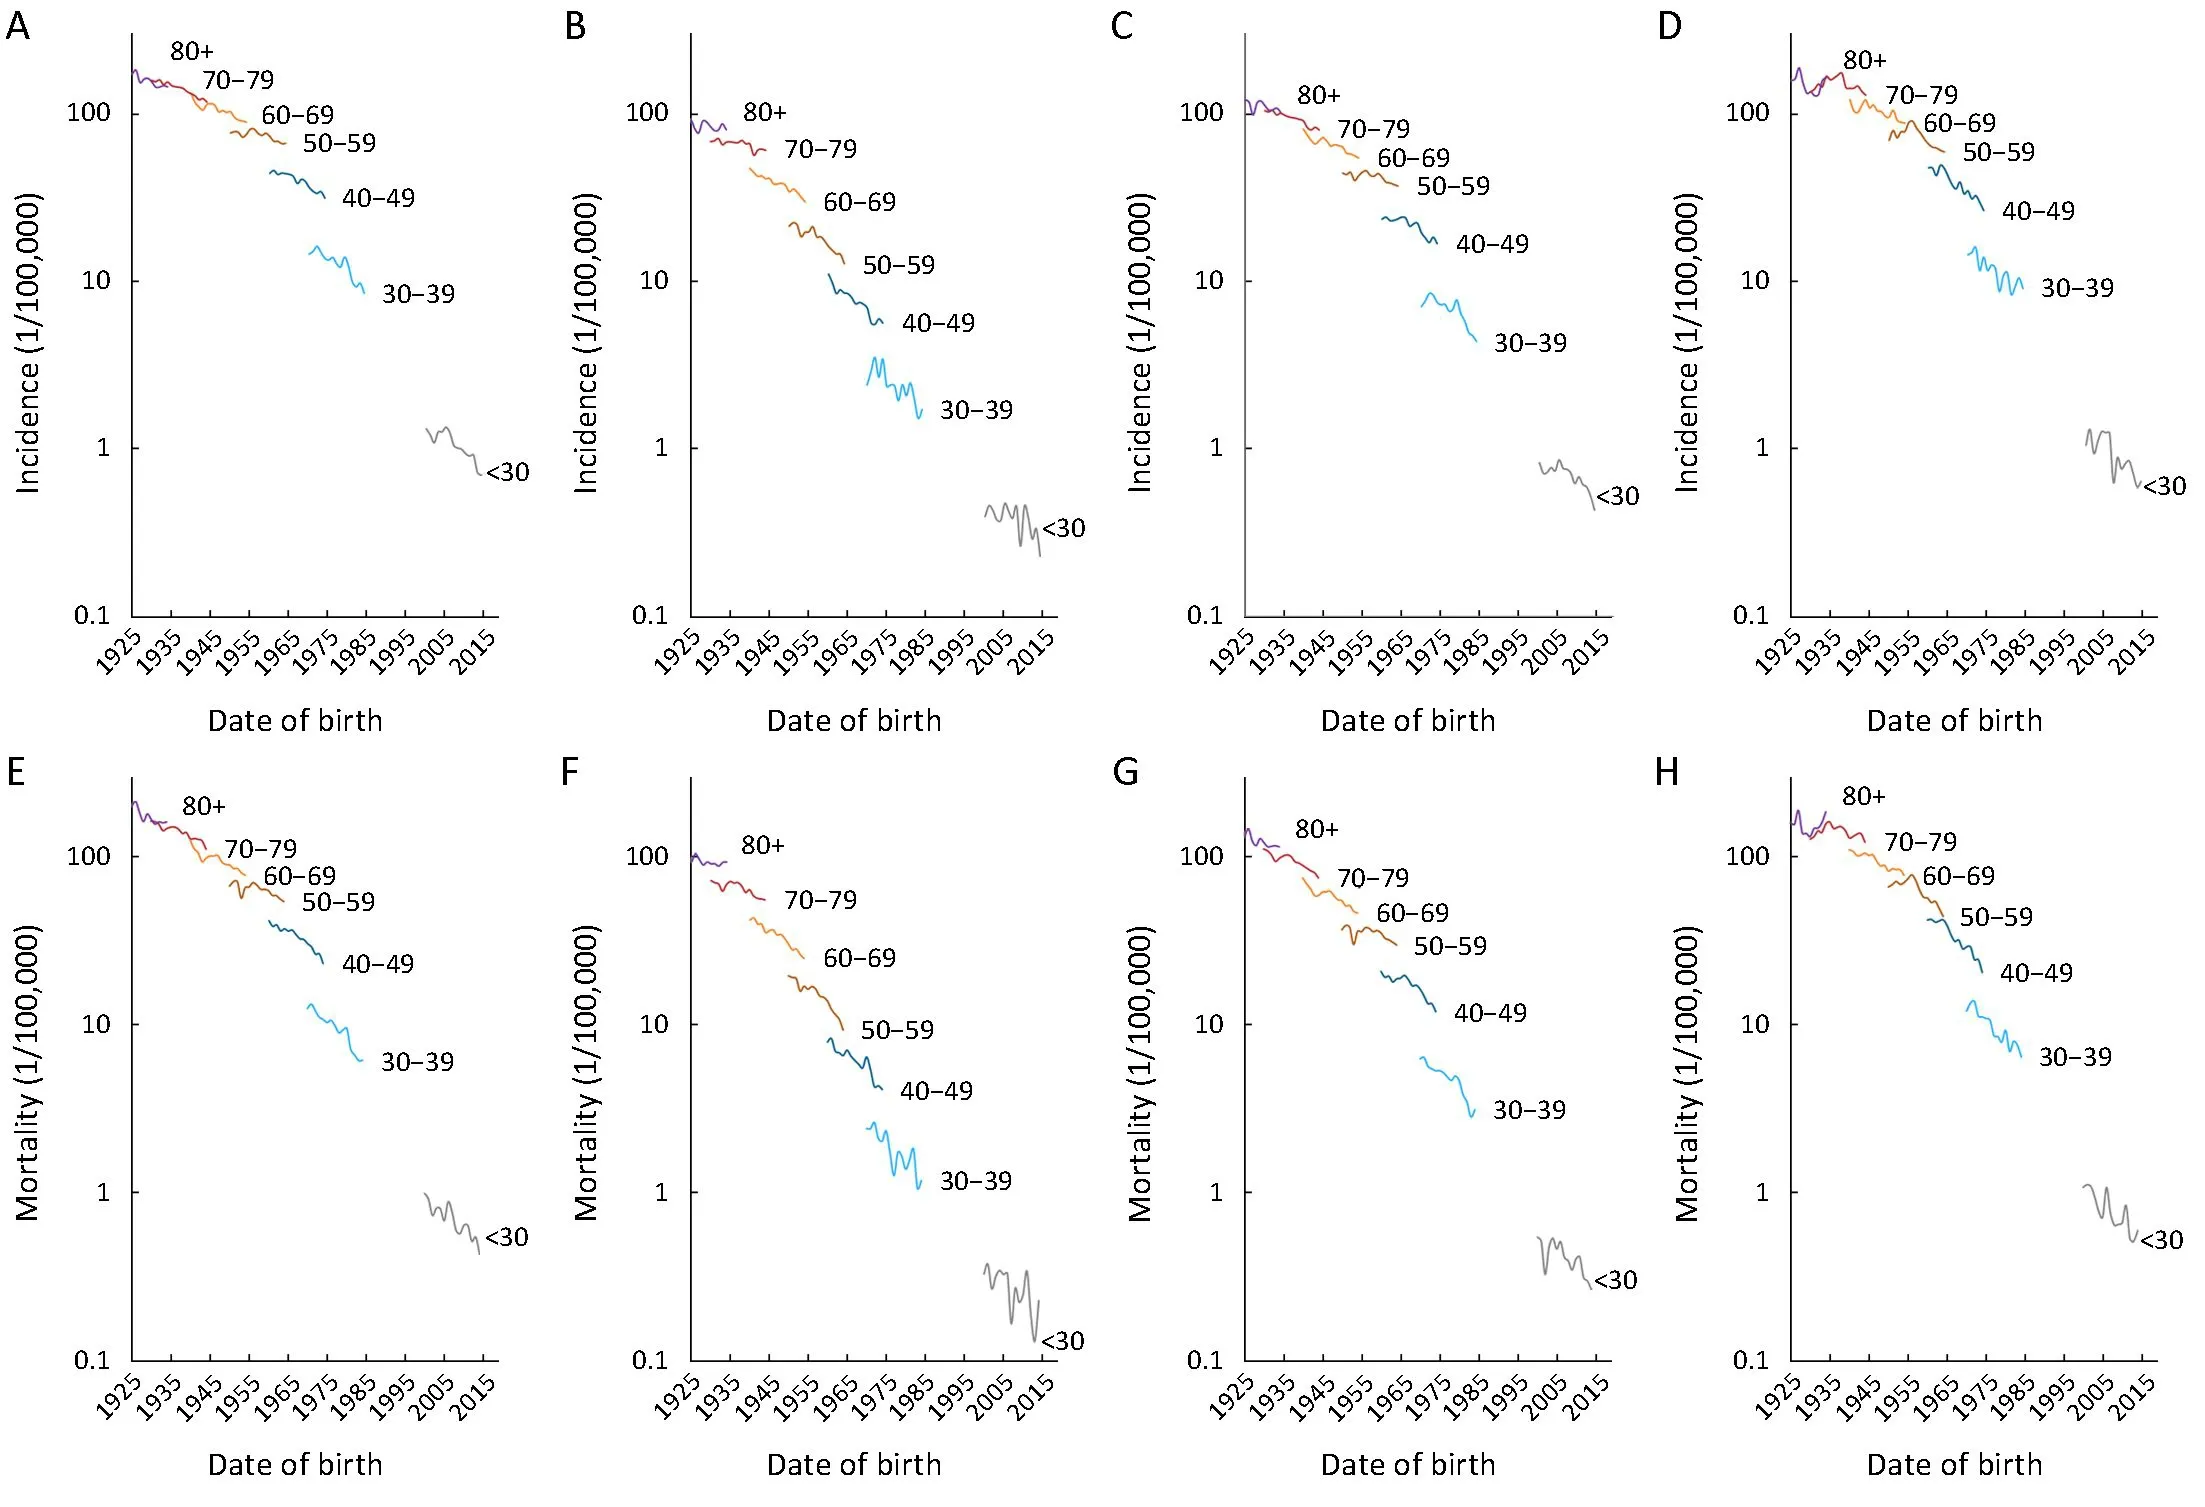
Figure S2 Liver cancer incidence and mortality rates with different birth cohorts by age groups in China. (A) Male incidence; (B) Female incidence; (C) Urban incidence; (D) Rural incidence; (E) Male mortality; (F) Female mortality; (G) Urban mortality; (H) Rural mortality.

Table S1 Liver cancer incidence trends by areas, gender and age, 2000 to 2014

Table S1 (continued)

Table S1 (continued)

Table S2 Liver cancer mortality trends by areas, gender and age, 2000 to 2014

Table S2 (continued)

Table S3 Mean age of diagnosis of liver cancer, by gender and areas in 22 cancer registries
 Chinese Journal of Cancer Research2018年6期
- Chinese Journal of Cancer Research的其它文章
- Liver cancer incidence and mortality in China: Temporal trends and projections to 2030
- Incidence and mortality of lung cancer in China, 2008-2012
- Adjuvant chemotherapy may improve outcome of patients with non-small-cell lung cancer with metastasis of intrapulmonary lymph nodes after systematic dissection of N1 nodes
- Exploratory clinical study of chidamide, an oral subtype-selective histone deacetylase inhibitor, in combination with exemestane in hormone receptor-positive advanced breast cancer
- Voltage-gated K+ channels promote BT-474 breast cancer cell migration
- Construction and external validation of a nomogram that predicts lymph node metastasis in early gastric cancer patients using preoperative parameters