
Physical properties of ternary thallium chalcogenes Tl2MQ3(M=Zr,Hf;Q=S,Se,Te)via ab-initio calculations
2019-11-06 00:45EnginAteserOguzhanOkvuranYaseminOztekinCiftciHaciOzisikandEnginDeligoz
Chinese Physics B 2019年10期
Engin Ateser,Oguzhan Okvuran,Yasemin Oztekin Ciftci,Haci Ozisik,and Engin Deligoz
1Aksaray University,Department of Physics,68100,Aksaray,Turkey
2Gazi University,Science Faculty,Physics Department,06500,Ankara,Turkey
Keywords:electronic band structure,thermoelectric properties,figure of merit,ternary thallium chalcogens
1.Introduction
Recent studies about chalcogens have a variety of applications such as energy,magnetism,superconductivity,electronics,optoelectronics,and catalysis.[1–8]One of the popular topics within these is thermoelectricity,generating electricity by converting the temperature difference to an electrical voltage.For energy management in this way,the thermoelectric materials(TEM)become indispensable.As it is known that,the accomplishment of TEM addresses to dimensionless figure of merit(ZT)which is directly proportional to the power factor(S2σ;S,Seebeck coefficient and σ,electrical conductivity),and inversely proportional to the thermal conductivity(k). Since some of the efficient TEM are narrow band semiconductor chalcogenides and antimonides with heavy and complex structures,[9,10]there are many theoretical and experimental studies on them to advance TEM.While various efforts have concentrated on getting a higher power factor,the others have centered on decreasing the lattice thermal conductivity. One of the ways of Seebeck coefficient enhancement is alloying. For example,in Refs.[11]–[13],Mg and Cd were integrated to SnTe and PbSe,respectively,in order to have more carrier contribution from Σ(heavy)to L(light)hole valance bands by reducing the energy gap between them.Another way of Seebeck coefficient improvement is stoichiometry,e.g.,in Ref.[14],the TEM properties of Tl10−xSnxTe6and Tl10−xPbxTe6were examined as a function of x varying between 1.8 and 2.06 and ZTmax>1(commercially viable value)was obtained.The difficulty of ZT improvement is the interconnection of S,σ,and k.Therefore,they tried to have a higher S while keeping σ unchanged.The strategy was to increase the number of valence electrons which decreases the dominating p-type charge carriers.So a larger Seebeck coefficient could be achieved while leaving the thermal conductivity remained under 0.5 W/m/K.Li et al.have made a pioneering review about introducing some new scattering mechanisms for ZT enhancement via nanostructures in the bulk materials hindering the interconnection of the thermal and electrical transports.[15]Meanwhile,several methodologies have been applied to reduce the lattice thermal conductivity,such as strengthening the phonon scattering.[16–21]Phonon scattering,produced by point defects in Ref.[16]and accommodation of metal cations in Ref.[17],is responsible for having a reduced lattice thermal conductivity.The mass and strain fluctuations between host and guest atoms,which produces strong phonon scattering,could also be maximized by vacancies as demonstrated in Ref.[18]. Furthermore,the substitution of Zn and Sn atoms in the disordered Sb/Se site caused an improved power factor,resulting in the maximum ZT of 0.53 at 657 K.in Ref.[16].It is known that heterostructures on the nanoscale may decrease the thermal conductivity while improving the electronic properties,thereby increasing the ZT value as shown in Ref.[19].
Especially,thallium containing chalcogenides are candidates of narrow band gap semiconductors because of their high atomic weight and so complex structure.Also,the high electronegativity of Tl compared to that of the other alkali metal ions is important for the band gap.Furthermore,it is also important that the presence of a lone pair in Tl+ions causes anharmonicity in the lattice which has a remarkable effect on lowering the lattice thermal conductivity.[22–29]Tl2Ag12Se7,a new pnp conduction switching semiconductor(Eg=0.8 eV)has just been synthesized,possessing a new structure type,namely,super cell of the Zr2Fe12P7-type,[23]Ptype polycrystalline thallium lanthanides Tl9LnTe6(Ln=La,Ce,Pr,Nd,Sm,Gd,Tb)and Tl10−xLaxTe6(0.90 ≤x ≤1.05)were synthesized.The ZT value was improved by using different lanthanides and changing the load concentrations.[24]The ZT values for TlSbTe,Tl9BiTe6,Tl4ZrTe4,and Tl4HfTe4compounds were 0.87 at 715 K,1.2 at 500 K,0.16 at 420 K,and 0.09 at 540 K,respectively.[26,27]Sankar et al.firstly synthesized Tl2ZrSe3(cubic,P213 space group)and found ZT=0.18 at 420 K for Tl2ZrTe3,ZT=0.31 at 500 K for Tl2SnTe3.[28]Later,they synthesized Tl2MQ3(M=Zr,Hf,Q=S,Se)which have a new isostructural monoclinic structure with P21/m space group.[29]They have also studied their crystallographic features,electronic structures,and electrical conductivity.
Using the density functional theory(DFT),we systematically investigate the structural,electronic,mechanic,and thermoelectric properties of Tl2HfS3,Tl2HfSe3,Tl2HfTe3,Tl2ZrS3,Tl2ZrSe3,and Tl2ZrTe3compounds for the first time.We have also added new additional data by comparing them with the previous studies.The organization of this study is as follows.The method of calculation is given in Section 2,the results and overall conclusions are presented and discussed in Sections 3 and 4.
2.Method of calculation
All calculations have been accomplished by using the Vienna ab initio simulation package(VASP)[30–33]based on the density functional theory(DFT).The electron–ion interaction was considered in the form of the projector-augmentedwave(PAW)method with plane waves up to an energy of 450 eV,[33,34]an adequate value for studying the structural,elastic,and lattice dynamical properties. Perdew–Burke–Ernzerhof(PBE)type functional[35]within the generalized gradient approximation(GGA)has been used for the exchange and correlation terms in the electron–electron interaction.17×17×13 Γ-centered Monkhorst–Pack[36]grid of k-points has been used for these monoclinic compounds.
To obtain the transport properties of Tl2MQ3(M=Zr,Hf;Q=S,Se,Te)compounds,we have used the rigid-band approximation and semiclassical Boltzmann theory using Boltz-TraP code.[37]For the calculations of transport coefficients(electrical conductivity σ,thermopower S,and electronic contribution of thermal conductivity ke),we need to calculate the velocities as a function of k for different bands.To get accurate electronic velocities,it is necessary to have a dense k-points mesh.[38]For this reason,we used 34×34×26 Monkhorst–Pack k-points sampling to obtain the band structure.
3.Results and discussion
3.1.Structural properties
We assume that the compounds Tl2MQ3(M=Zr,Hf;Q=S,Se,Te)crystalize in monoclinic structure,similar to Na2FeO3-type,with P21/m space group,as were synthesized in Ref.[29].Their general crystal arrangement can be seen in Fig.1 having 12 atoms occupying 2e(x,z)site in the unit cell(Z=2)given in Table 1.

Fig.1. Unit cell arrangement of the Tl2MQ3 compounds with Na2FeO3-type structure.
We have fully optimized the lattice constants and ionic positions by taking the experimental values from Ref.[29].The obtained equilibrium lattice parameters,volumes,and total energies are listed in Table 2.It is seen that the lattice parameters are in good agreement with the experimental values[29]and a bit higher than them as expected due to the theoretical calculations.

Table 2.Calculated equilibrium lattice parameters(a,b,and c in ˚A),the angle(β in degree),total energies(E0,eV/f.u.),formation enthalpy(∆Hf,eV/atom),and volumes(V0,˚A3)of the Tl2MQ3(M=Zr,Hf;Q=S,Se,Te)compounds.

The thermal stability is calculated by using the formation enthalpy expression.Formation enthalpy ∆H is required for the quantitative evaluation of the structural stability of materials. To determine the stability of the Tl2MQ3compounds crystallized in monoclinic structure,we have calculated ∆H by using the following expression:,andrepresent the computed energies per unit cell at the absolute temperature for Tl,M,and Q,respectively.Generally,if ∆H is negative,then the material is considered to be energetically favorable to be synthesized experimentally.The computed formation enthalpies of these compounds are between −0.758 and −1.603 eV/unit cell for Tl2MQ3(see Table 2). The negative values of ∆H confirm the stabilities of these materials,and Tl2HfS3is the most stable one among the Tl2MQ3(M=Zr,Hf;Q=S,Se,Te)compounds due to the higher magnitude of ∆H.
3.2.Electronic properties
The electronic band calculations have been performed for the titled compounds in monoclinic P21/m structure,and the band structures of each compound along the high symmetry points are shown with the density of states in Figs.2 and 3,where the Fermi energy level is taken as EF=0 for convenience.
As shown in Figs.2 and 3,all compounds in the considered phase exhibit semiconductor character due to the total density of states,which are compatible with the band structures.While the Tl2ZrS3compound has a direct band gap,the others have indirect band gaps.As the atomic weight of the chalcogens increases from S,Se to Te,the band gap changes as follows:Te-containing compounds with(∼0.15 eV),Secontaining compounds with(∼0.60 eV),and S-containing compounds with(∼0.90 eV).It is observed that there are indirect transitions as well as direct transactions having very close(∆Eg∼0.1 eV)energy values of the indirect ones(see Table 3).In spite that indirect(direct)transitions are fundamental,secondary ones are direct(indirect)possessing a bit energy

Fig.2. The electronic band structure and density of states for(a)Tl2ZrS3,(b)Tl2ZrSe3,and(c)Tl2ZrTe3.
The total and projected densities of states of the studied compounds have been calculated and shown in Figs.2 and 3.It can be found that while Q(S,Se,and Te)elements are dominant in the conduction band,the leading elements of the valance band are M(Hf and Zr).
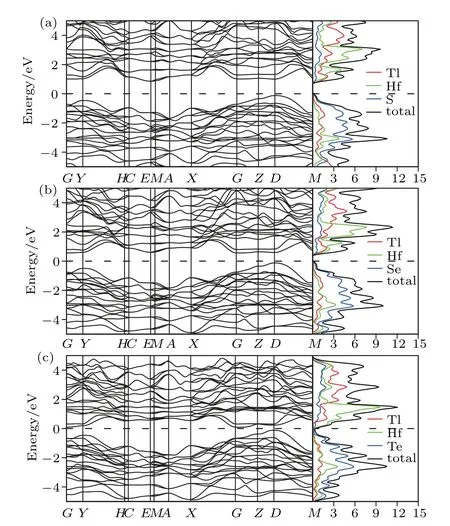
Fig.3. The electronic band structure and density of states for(a)Tl2HfS3,(b)Tl2HfSe3,and(c)Tl2HfTe3.
We have also considered the electronic charge densities of the related compounds for(00)and(1)faces to estimate the bonding mechanism,as seen in Figs.4 and 5 for Tl2HfS3,Tl2ZrS3,and Tl2ZrSe3compounds on(00)and Tl2HfTe3and Tl2ZrTe3compounds on(1).It can be seen that the contribution to binding is more ionic than covalent.

Table 3.The calculated band gaps and for Tl2ZrS3,Tl2ZrSe3,Tl2ZrTe3,Tl2HfS3,Tl2HfSe3,and Tl2HfTe3 compounds.

Fig.4.The contour plot of charge density for(a)Tl2ZrS3,(b)Tl2ZrSe3,and(c)Tl2ZrTe3.
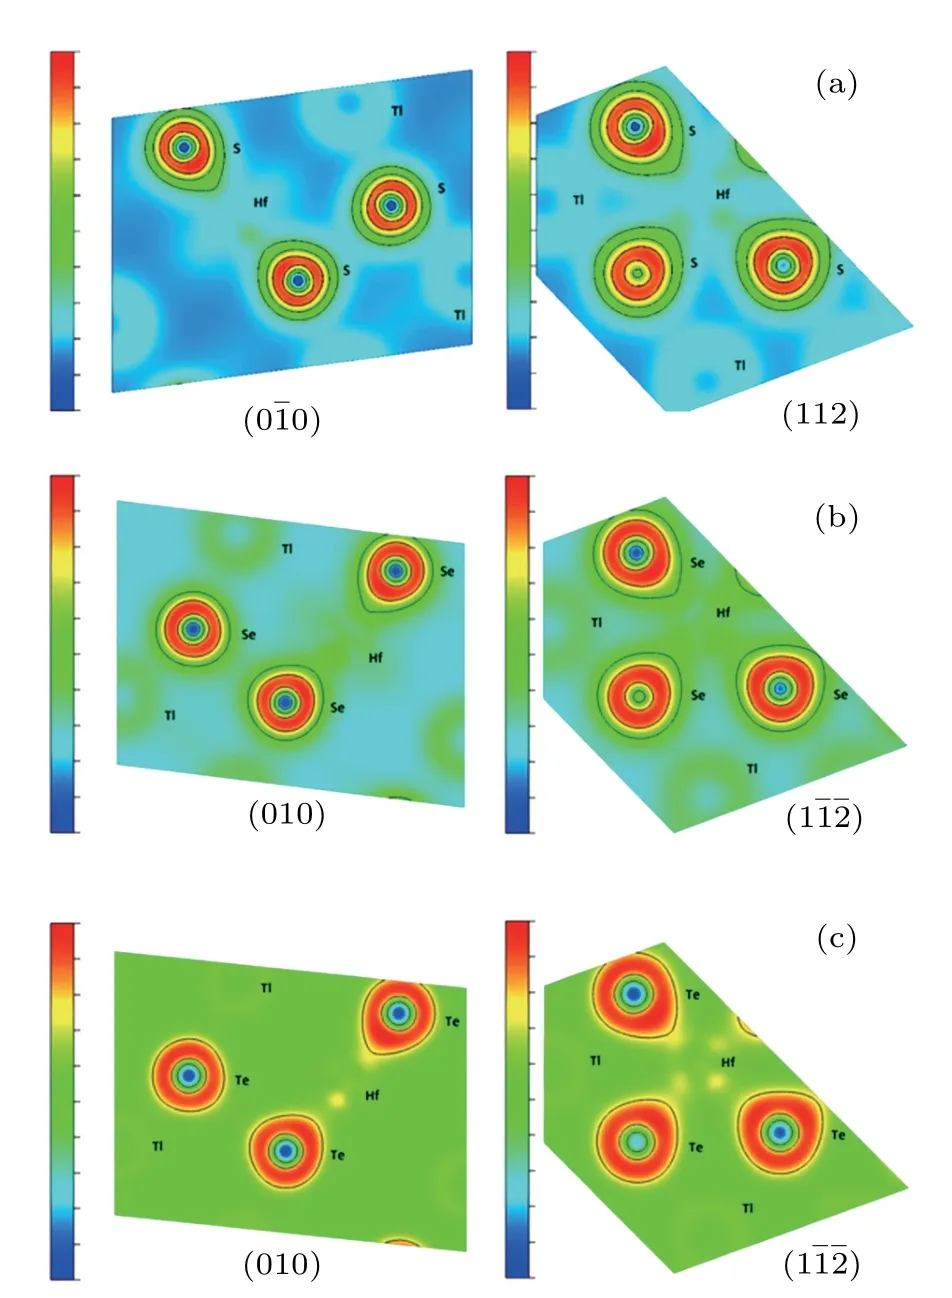
Fig.5.The contour plot of charge density for(a)Tl2HfS3,(b)Tl2HfSe3,and(c)Tl2HfTe3.
3.3.Mechanical properties
3.3.1.Elastic properties
An elastic tensor provides the description of all the responses of a crystal to external forces within the elastic limits. It is one of the fundamental properties that explain the interatomic bonding in a system,and can be correlated with many mechanical,thermal properties for searching process of new material’s discovery and design.[35]We have computed the second order elastic constants(Cij)using the stress–strain methodology embedded in VASP.[30]The calculated Cijfor the titled compounds shown in Table 4 obey the mechanical stability conditions for monoclinic structures given below:
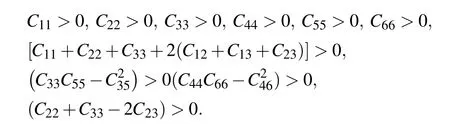
Unfortunately,the experimental values of Cijare not available at present.

Table 4.The calculated elastic constants(Cij,GPa)for Tl2MQ3(M=Zr,Hf;Q=S,Se,Te).
Elastic constants C11,C22,and C33measure the resistance to linear compression in the x-,y-,and z-directions,respectively. All compounds resist to compression in y-direction better than that in the other directions,so the compressibility from higher to lower is βz>βx>βy.As the atomic weight of the chalcogens increases from S to Te,the compressibility increases for the x-and y-directions.On the other hand,there is no significant change in the values along z-direction.The present C11and C33are higher than C44and C66.This indicates the weaker resistance to the unidirectional compression compared to the resistance to shear deformation.[39]It is known that the elastic constant C44is the most important parameter indirectly guiding the indentation hardness of a material.The large C44means a strong ability of resisting the monoclinic shear distortion in(100)plane. In the present case,C44of Tl2ZrTe3has the highest value.
3.3.2.Polycrystalline properties
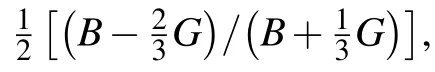

Table 5.Calculated bulk modulus B(GPa),isotropic shear modulus G(GPa),Young’s modulus E(GPa),Poisson’s ratio ν,B/G ratio,Vicker hardness Hv,(GPa)Debye temperature ΘD,(K),and longitudinal,transverse and average sound velocities(ϑl,ϑt,ϑm,m/s).
Their shear moduli are almost similar to each other.However,since the large shear modulus is an indication of the more pronounced directional bonding between atoms.[42]It can generally be said that directional bonding of Tl2ZrS3is more notable than that of the others due to its high value.On the other hand,a larger C44elastic constant result with a larger shear modulus is not valid for our compounds.[43]
A greater Young’s modulus indicates a stiffer material,it is a measure of the resistance against uniaxial tensions.[44]Tl2ZrS3has the largest bond strength among the considered systems,resulting in more resistivity to any deformation.A ductile material can be accessed with the help of Pugh’s ratio(B/G).Since all of the ratios are lower than 1.75,which is the critical starting value of ductility,all our considered systems show a brittle behavior.
The Poisson ratio is a measure of compressibility.when the Poisson ratio is close to 0.5,the material has tendency to be incompressible.[45]Here,the calculated Poisson ratio is about 0.23,which indicates that these materials are less compressible and stable against elastic deformation.[46]The value of Poisson ratio is also indicative of the degree of directionality of the covalent bonding.The Poisson ratio is about 0.1,0.25,and 0.33 for covalent,ionic,and metallic materials,respectively.[47]Since the values are about 0.23,ionic contribution in the intra-atomic bonding is dominant with no central interatomic forces for the considered structures due to the lower limit of 0.25 for the central force solids.According to Frantsevich rule,the critical value of Poisson ratio of material is 0.33. Frantsevich et al.indicated that if the Poisson ratio is less than 0.33,the materials show brittle behavior.[48]This supports our results from the analysis of Pugh’s ratio(B/G).
The elastic and plastic properties of a material can be related to its hardness.The compounds are soft materials,since all of the calculated Vickers hardness values are lower than 10 GPa(see Table 5),as also supported by the bulk modulus values.
As an important fundamental parameter,the Debye temperature(θD)is closely linked to many physical properties of solids such as the specific heat and melting temperature.At low temperatures,the vibrational excitations originate entirely from acoustic vibrations.As a result,the Debye temperature calculated from elastic constants is the same as that determined from specific heat measurements for the low temperature values.Elastic constant data can be used for calculating the Debye temperature by estimating it from the average sound velocity(vm).[49,50]Mostly for hard materials it is higher or vice versa.[51]All of the considered systems are soft materials due to their low Debye temperatures.
3.3.3.Elastic anisotropy
Elastic anisotropy affects many physical processes such as plastic deformation development in crystals,enhancement of positively charged defect mobility,microscale cracking,phonons in crystallites,etc.[52]The degree of anisotropy in the bonding between atoms in different planes(A1,A2,and A3)could be measured by means of the shear anisotropic factors.Any value smaller or greater than 1,which is the isotropy criterion of crystals,is the indication of shear anisotropy.In addition,we have also calculated the percentage elastic anisotropy of bulk and shear moduli.In these expressions,the zero value correlates to the elastic isotropy and the value of 100%pinpoints the largest elastic anisotropy.Our results are given in Table 6.As the atomic weight of chalcogens increases,while anisotropy increases for the values of A1,it decreases for the values of A3.Tl2ZrSe3and Tl2HfSe3can be thought as almost isotropic compounds for the values of A2.The calculated AGvalue of all compounds is higher than the ABvalues,indicating that shear anisotropy is greater than bulk anisotropy.It is obvious that Tl2ZrTe3exhibits relatively high shear anisotropy,while Tl2HfS3exhibits relatively high compressibility among the compounds.

Table 6.The calculated shear anisotropy factors(A1,A2,and A3)and the percentage of anisotropy in the bulk and shear(AB and AG).
3.4.Transport properties
We have calculated the transport properties of the Tl2MQ3compounds based on the Boltzmann transport equation under a rigid band and constant relaxation time approximations(RTA)which are very helpful in evaluating thermoelectric performance of materials based on theoretical band structure calculations,[53,54]i.e.,the chemical potential shifts up or down from the intrinsic limit depending on the doping type and degree of doping and keeping the band structure unchanged.[55]In the rigid band approximation,the band structure is considered to be unaffected by doping,which only leads to change of the chemical potential.Boltzmann transport equations have a derivative of Fermi function with respect to the band structure and varies significantly within a small range near the chemical potential.So,in the calculations,instead of dependence of relaxation time on both the band index and the k vector direction,we have considered a direction independent τ,i.e.,an almost constant relaxation time,which is a rational good approximation to express the transport coefficients.[56,57]Within RTA,the Seebeck coefficient can be calculated without any adjustable parameter.[58]However,the electronic conductivity has to be calculated with respect to the relaxation time and hence instead of calculating the absolute power factor(S2σ),the power factor is calculated with respect to relaxation time(S2σ/τ).[58]
Within the constant relaxation time approximation,the value of relaxation time is fixed to be in the order of τ ∼10−14s,which is a typical value for semiconductors.[59,60]The variation of Seebeck coefficient of Tl2HfSe3with temperature and concentration is depicted in Fig.6.For this material,the maximum Seebeck coefficient is obtained for n-type doping and the optimal carrier concentration is 1017cm3.
The Seebeck coefficient of Tl2HfSe3as a function of ptype and n-type carrier concentration at 300 K is shown in Fig.7. The S of the p-type Tl2HfSe3is positive,while that of the n-type is negative.The absolute S values decrease with the increase of carrier concentration,which means that one can obtain satisfactory S by tuning the carrier concentration.The absolute S of the n-type at lower carrier concentration is larger than that of the p-type,however,the decrease scale is also larger. They both are close to zero at the carrier concentration of 1021cm−3,which implies that Tl2HfSe3cannot be appropriate for thermoelectric application because the very small S will result in very small ZT.
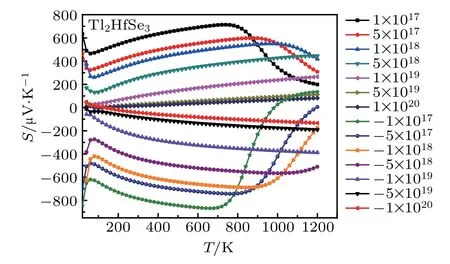
Fig.6.The Seebeck coefficient of Tl2HfSe3 at different concentration(cm−3)and temperature.
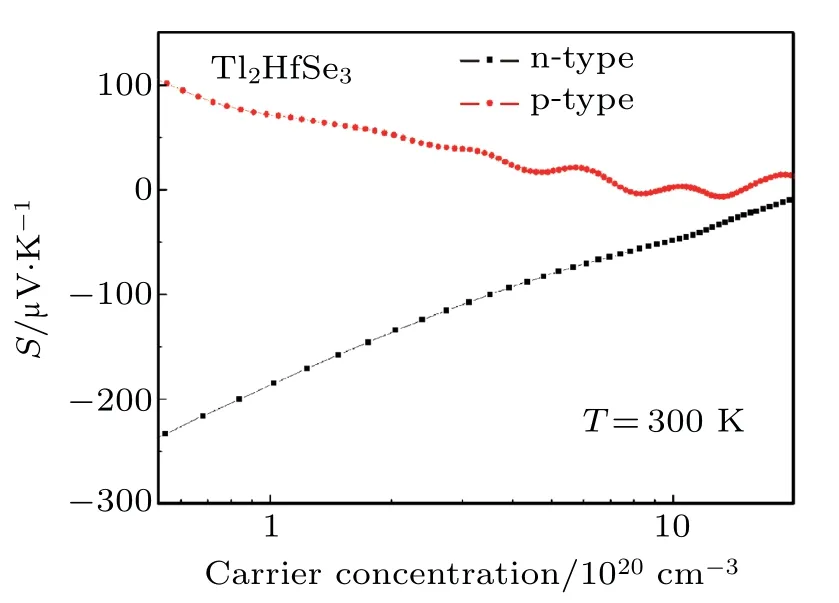
Fig.7. The Seebeck coefficient of p-type and n-type Tl2HfSe3 as a function of carrier concentration at 300 K.
The calculated Seebeck coefficient(S),electrical conductivity(σ/τ),electronic thermal conductivity(ke/τ),power factor(S2σ/τ),and ZTelof Tl2HfSe3as a function of chemical potential at carrier concentration 1017cm−3are plotted in Figs.8–13.
The Seebeck coefficient is an important tool,which provides a sensitive test of the electronic structures of the materials in close proximity to the Fermi energy.Large values of Seebeck coefficient are desired for efficient TE devices.The calculated S of the titled compound as a function ofµat different temperatures is illustrated in Fig.8.In the case of n-type doping,the Fermi level gets up-shifted towards the conduction band,resulting in a positiveµ;while for p-type doping,the Fermi level shifts down towards the valence band,resulting in a negativeµ.Assuming an energy independence of τ concludes a τ independence of Seebeck coefficient. Consequently,S(T)dependency should be considered with respect to the carrier population,the intrinsic velocities,and density of states near the band gap rather than τ(T)dependence.[61]In the vicinity of Fermi level,the Seebeck coefficient exhibits two pronounced peaks for n-/p-types.The investigated material gives the highest S at 300 K,which means that this material has good thermoelectric performance. The maximum value of Seebeck coefficient decreases with increase in temperature.These values are 1104.23µV/K and −985.32µV/K for p-and n-type Tl2HfSe3,respectively.We should highlight that the critical points of Seebeck coefficient for p-and n-type Tl2HfSe3are between 0.26 eV and 0.36 eV where the material exhibits good thermoelectric properties,while beyond these points,S drops rapidly to zero.To see the effect of the GGA+HSE06 functional on Seebeck coefficient calculations at 300 K,we present Fig.9.From this figure,it can be concluded that HSE06 functional on GGA increases the Seebeck coefficient from −985.32µV/K to −1980.9µV/K and shifts right at the higher Fermi level.

Fig.8. The calculated Seebeck coefficient as a function of chemical potential at 300 K,600 K,and 900 K for Tl2HfSe3.

Fig.9. The calculated Seebeck coefficient as a function of chemical potential at 300 K for Tl2HfSe3.
Electrical conductivity σ in units of τ has been calculated as a function of the chemical potentialµat three temperatures(300 K,600 K,and 900 K)given in Fig.10.It can be seen from Fig.10 that the electrical conductivity is minimum between 0–0.66 eV and increases as the chemical potential increases.So desired values of electrical conductivity could be obtained with the change in the chemical potential.The σ/τ value of Tl2HfSe3has two apparent peaks atµ=−1.61 eV(nearly 1.53×10²⁰(Ω·m·s)−1for n-type)andµ=1.83 eV,increases smoothly near the regionµ=0.27 eV.

Fig.10. The calculated electrical conductivity(in units of relaxation time τ)as a function of the chemical potential at 300 K,600 K,and 900 K for Tl2HfSe3.
While lattice vibrations are mostly subject to the heat conduction in semiconductors,free electrons are commonly the key of thermal conductivity in metals.[62]The thermal conductivity involves two parts as k=ke+kl,where electrons and holes in keand phonons in klare responsible for heat transport.The total thermal conductivity in metals could be evenly neglected,because its percentage is less than 2 causing from the lattice part.[63,64]We have obtained ke/τ(in units of τ)as a function ofµat temperatures 300 K,600 K,and 900 K using energy independent relaxation time approximation like before with the results given in Fig.11.Minimum values of ke/τ are obtained withµbetween 0.0 eV and 0.7 eV,having the maximum efficiency for Tl2HfSe3. The maximum values of the electronic thermal conductivity in units of τ are obtained withµbetween −1.5 eV and 2.0 eV,where the maximum values of ke/τ for n-types are lower than those for p-types. Also,it is concluded from Fig.11 that the thermal conductivity increases with temperature because free electrons gain more energy.Electronic thermal conductivity per second for positive chemical potential is smaller than that for negative chemical potential.

Fig.11.Electronic thermal conductivity ke as a function of chemical potential at 300 K,600 K,and 900 K for Tl2HfSe3(the zero at low T corresponds to the undoped systems).
It is important to increase the value of P as much possible as without increasing the total thermal conductivity k.[65]The P is given in Fig.12 for temperatures 300 K,600 K,and 900 K.The power factor is the minimum near the Fermi level and beyond increases rapidly to form two pronounced peaks located atµ=−0.1 eV and 0.72 eV,for p-/n-type doping of Tl2HfSe3.The maximum value of power factor is 0.335×10¹²W/m·s·K2for p-type doping at 900 K,thereafter it decreases with decreasing the temperature.

Fig.12. Power factor of Tl2HfSe3 at 300 K,600 K,and 900 K as a function of the chemical potential.
In the figure of merit calculations,we have only considered the electronic part of ZT because of not know anything(theoretically)about the lattice thermal conductivity.So,we define(ZT)el=S2σT/kel,which depends only on the electronic properties andSinceis greater than 1,ZT<(ZT)el.
The(ZT)elprovides an upper limit to the figure of merit.It is well known that there are two types of kel,as kel,Jat J=0 and as kel,Eat E=0.Extremely small thermopower value in metals or strongly degenerate semiconductors makes these two electronic thermal conductivities nearly the same.[55]Whereas their values are completely different in good thermoelectric possessing large thermopower value.[66]For simplicity in this paper,we will calculate(ZT)elconsidering only kel,E,and plot its graph as a function of the chemical potential for 300 K,600 K,and 900 K in Fig.13.

Fig.13.Figure of merit(ZT)el for Tl2HfSe3.
Seebeck coefficient S,electrical conductivity σ/τ,power factor P,and(ZT)elas a function of different temperature with a doping concentration of 1017cm−3are given in Figs.14(a)–14(d)for the studied compounds. It is clear that the Seebeck coefficient is considerably varying with temperature.The Seebeck coefficient of Tl2ZrTe3and Tl2HfTe3begins from 127µV/K and decreases up to 300 K,and then rises exponentially for both compounds,owing to the rise in temperature up to 600 K,and then at higher temperature shows the slightly constant rate.The S values for Tl2ZrSe3,Tl2HfSe3,and Tl2ZrS3decrease up to 450 K,700 K,and 750 K,respectively,and then increase for higher temperatures.At 750 K,for the Tl2ZrS3compound,the maximum Seebeck coefficient is 473.6µV/K,which endorses that this compound has potential applications in thermoelectric devices.The variation of electrical conductivity is shown in Fig.14(b),per relaxation time with temperature. It can be seen obviously from Fig.14(b)for Tl2ZrTe3and Tl2HfTe3that the electrical conductivity is almost linear with temperature up to 400 K,while for higher temperatures increases linearly. At 1000 K,the highest obtained electrical conductivity for the Tl2ZrTe3compound is 0.04858×10²⁰(Ω·ms)−1.The variation of thermal conductivity is shown in Fig.14(c),per relaxation time with temperature and all compounds increase exponentially with temperature.The(ZT)elfor Tl2ZrTe3,Tl2HfTe3,and Tl2ZrSe3increase to 0.8 till 200 K and then decrease for higher temperatures,which is enough for practical applications.According to Ref.[28]for Tl2ZrTe3,they have found ZT value of 0.18 at 420 K,which is higher than our value(0.044 at 400 K).The highest value of(ZT)elis obtained for Tl2HfSe3as 0.9 at 600 K as shown in Fig.14(d).
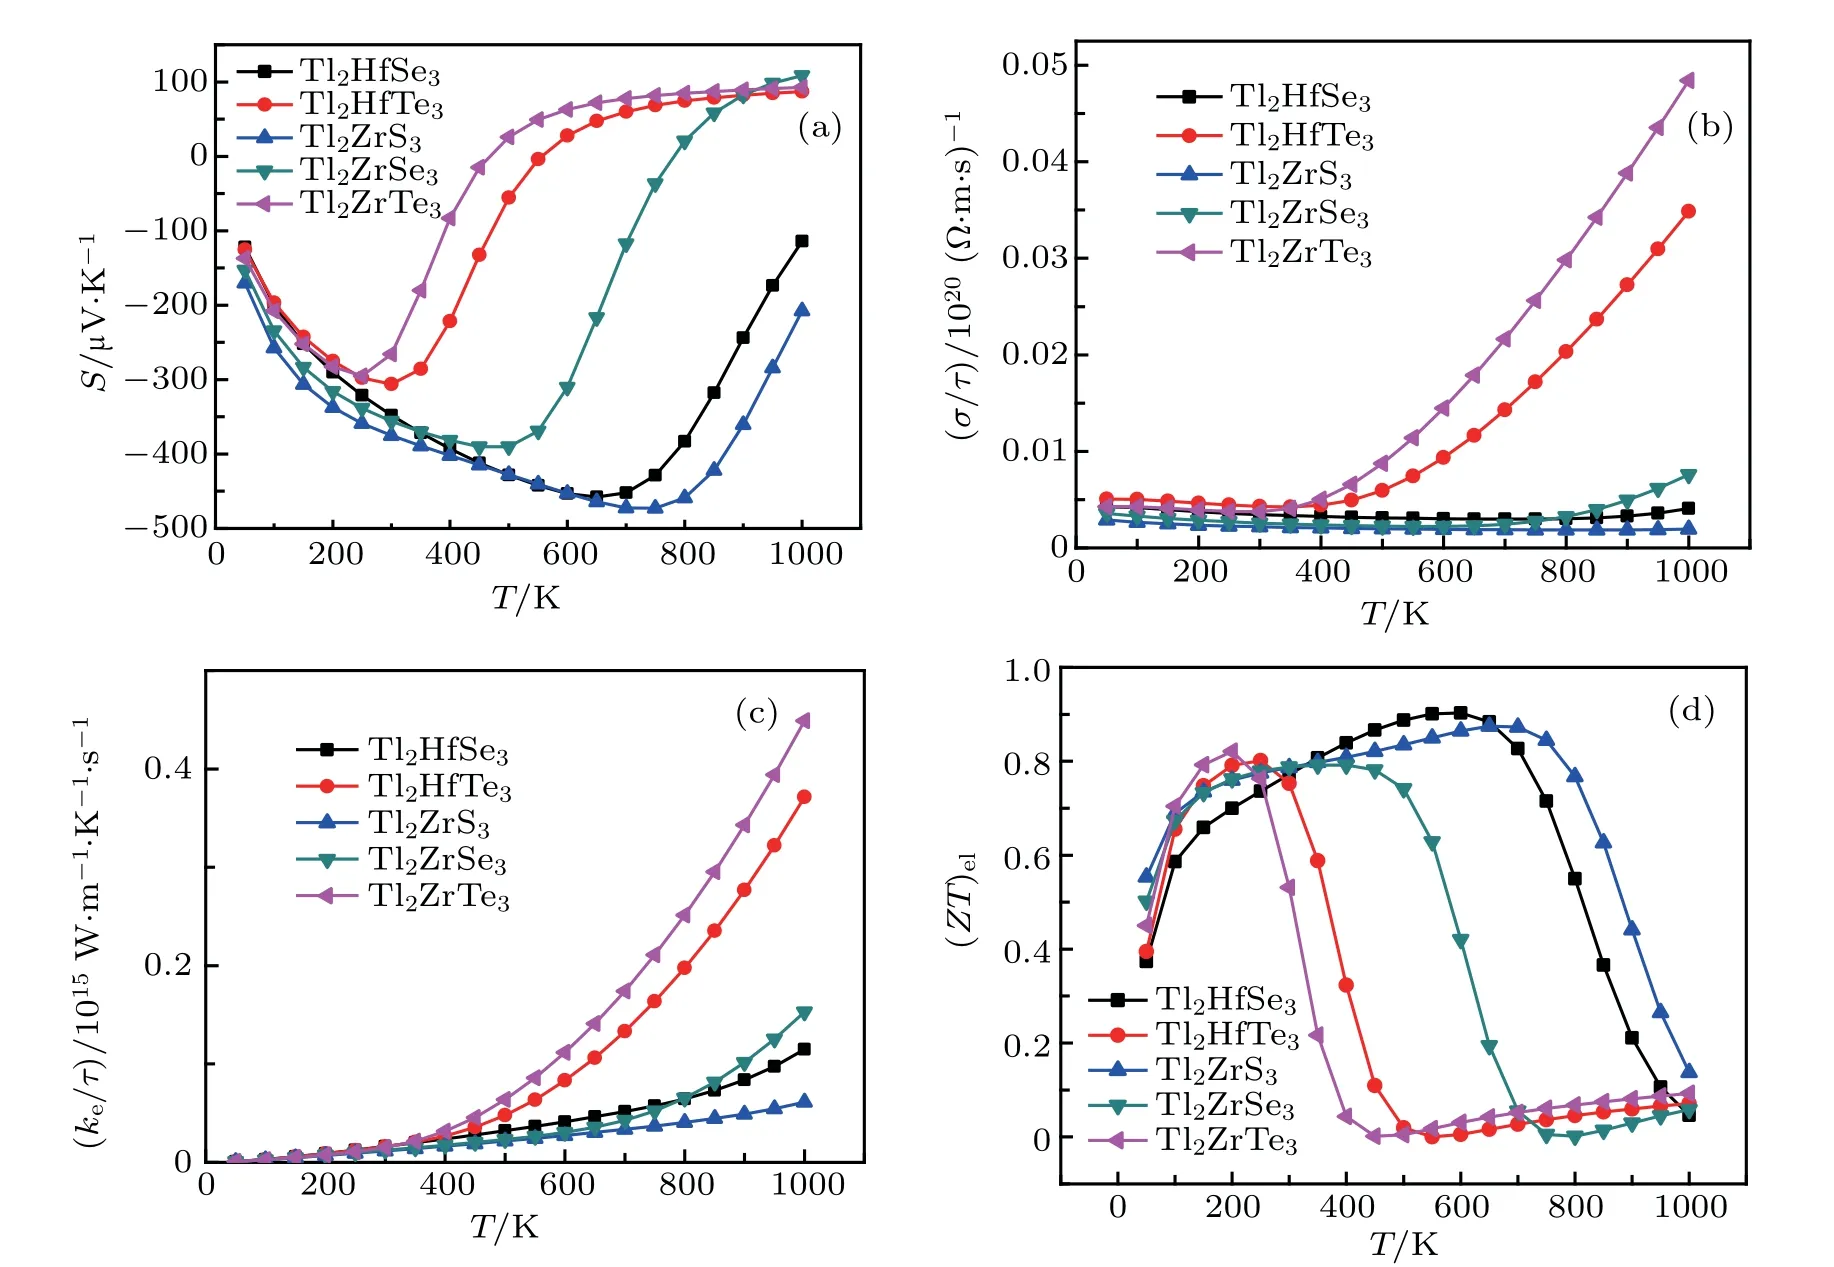
Fig.14.The calculated(a)Seebeck coefficient,(b)electrical conductivity(in units of relaxation time τ)(c)thermal conductivity(in units of relaxation time τ),and(d)figure of merit(ZT)el as a function of temperature for Tl2MQ3(M=Hf,Zr;Q=S,Se,Te).
In order determine the thermoelectric figure of merit of Tl2HfSe3,the thermal conductivity including the klof lattice and the keof electron needs to be calculated.The lattice thermal conductivity klequation derived by Slack[67]is given as

Here M is the average atomic weight,is the average volume of the mass equivalent one atom in the primitive unit cell,T is the absolute temperature,n is the number of atoms per unit cell,γ is the Gruneisen parameter,[68]and A is a coefficient depending upon γ.The Gruneisen parameter is calculated using the following Poison ratio(ν)equation:

At room temperature,the computed value of γ using Eq.(3)is 1.408.The klfor Tl2HfSe3is evaluated as 2.975 W/mK at 300 K.
For Tl2HfSe3,at T=300 K,using relaxation time τ=10−14s,the electronic thermal conductivity and electrical conductivity are obtained to be ke=6.509×10⁻³W/m·K and σ=36.55(Ω·m)−1. Finally,the figure of merit can be obtained from the following equation as 2.1764×10⁻³at 300 K which is very low compared to materials with good thermoelectric performance,

Therefore,Tl2HfSe3should not be a kind of materials with good thermoelectric performance at 300 K.
4.Conclusion
We have studied the structural,mechanical,electronic,and thermoelectrical properties of monoclinic Tl2MQ3(M=Zr,Hf; Q=S,Se,Te)compounds by performing firstprinciples calculations.The calculated lattice parameters are in agreement with the available experimental data.The other original features of the present calculations involve the elastic,mechanical,and thermoelectrical results,which have not been considered previously.The analysis of the elastic constants indicates the mechanical stability and that the compounds have a brittle and soft nature with respect to the B/G(∼1.5),Poisson’s ratio(∼0.23),and Hv(∼3 GPa)criteria.All studied systems are semiconductors in nature,which is also supported by the computed band structures,having an indirect band gap except for the Tl2ZrS3compound. The total and projected densities of states of the studied compounds indicate that while Q(S,Se,and Te)elements are dominant in the conduction band,the leading elements of the valance band are M(Hf and Zr). The electronic transport properties are calculated as a function of the chemical potential and the highest value for(ZT)elis tabulated for Tl2HfSe3as 0.9 at 600 K.But using experimental value of electrical conductivity for Tl2HfSe3at 300 K,ZT is obtained to be 2.176×10⁻³which is very low.We hope that the current theoretical prediction will stimulate extensive experimental synthesis thermoelectric materials.
Acknowledgment
The numerical calculations reported in this paper were performed at TUBITAK ULAKBIM,High Performance and Grid Computing Center(TRUBA resources)and Aksaray University,Science and Technology Application and Research Center HPC System.

- Chinese Physics B的其它文章
- Compact finite difference schemes for the backward fractional Feynman–Kac equation with fractional substantial derivative*
- Exact solutions of a(2+1)-dimensional extended shallow water wave equation∗
- Lump-type solutions of a generalized Kadomtsev–Petviashvili equation in(3+1)-dimensions∗
- Time evolution of angular momentum coherent state derived by virtue of entangled state representation and a new binomial theorem∗
- Boundary states for entanglement robustness under dephasing and bit flip channels*
- Manipulating transition of a two-component Bose–Einstein condensate with a weak δ-shaped laser∗