
Quantitative heterogeneity and subgroup classification based on motility of breast cancer cells∗
2019-11-06 00:46LingXiong熊玲YanpingLiu刘艳平RuchuanLiu刘如川WeiYuan袁伟GaoWang王高YiHe何益JianweiShuai帅建伟YangJiao焦阳XixiangZhang张溪祥WeijingHan韩伟静JunleQu屈军乐andLiyuLiu刘雳宇
Chinese Physics B 2019年10期
关键词:袁伟
Ling Xiong(熊玲), Yanping Liu(刘艳平),Ruchuan Liu(刘如川),Wei Yuan(袁伟),Gao Wang(王高),Yi He(何益),Jianwei Shuai(帅建伟),Yang Jiao(焦阳),Xixiang Zhang(张溪祥),Weijing Han(韩伟静),Junle Qu(屈军乐),‡,and Liyu Liu(刘雳宇),§
1Chongqing Key Laboratory of Soft Condensed Matter Physics and Smart Materials,College of Physics,Chongqing University,Chongqing 401331,China
2Department of Physics,Xiamen University,Xiamen 361005,China
3Key Laboratory of Optoelectronic Devices and Systems of Ministry of Education and Guangdong Province,Shenzhen University,Shenzhen 518060,China
4Materials Science and Engineering,Arizona State University,Tempe,Arizona 85287,USA
5Division of Physical Science and Engineering,King Abdullah University of Science and Technology,Thuwal 23955-6900,Saudi Arabia
6Shenzhen Shengyuan Biotechnology Co.,Ltd,Shenzhen 518060,China
Keywords:cancer metastasis,motility heterogeneity,three-dimensional microenvironment,invasion potential
1.Introduction
As metastasis leads to the majority of human cancerrelated deaths,tumor dissemination,including invasion and metastasis,is a great therapeutic challenge.[1,2]During tumor cell metastasis,the sub-group cells must recognize the extracellular matrix barrier and cross the barrier to achieve distant proliferation.[3]In addition,cell motility has become a strategy for anti-tumor invasion and metastasis.[4]Therefore,cell subpopulation classification based on the motility of cells will help to identify essential cells in tumor cell metastasis.Due to the stimulation of epithelial growth factor(EGF)as a growth factor that promotes cell movement,[5–7]the cell subpopulations will change. Moreover,it has been reported that cell heterogeneity together with microenvironment heterogeneity are essential in cancer cell motility and metastasis.[8]Studies have also suggested that,besides characteristic phenotypes of tumor heterogeneity and other phenotypes,highly motile invasive cells present great heterogeneity in their motility.[9–11]In addition,the existence of heterogeneous cancer cells during the invasion process,e.g.,leader and follower cells,was proven by both in vivo and in vitro experiments[12–14]and indicated that several related genes and pathways are involved.[15,16]Therefore,an easily handled quantitative characterization/classification approach for tumor cell motility heterogeneity in 3D microenvironments[17]could provide deeper insights into the differences between cells within a tumor and promote highly mobile/invasive subgroup cell identification in cancer invasion,metastasis,and evolution.Although there are already some approaches to discriminate various cell types[18]and their separations,[19]it still remains a technical challenge to well characterize cell motility heterogeneity and identify cell subgroups due to great complexity in tumor cell heterogeneity and usually subtle differences among cells in each cell-line.
To identify sub-groups of cells with various mobility,we combined a microfluidic chip inside a 3D microenvironment,a cell-tracking technique,and an improved method to characterize velocity auto-covariance(VACV)and power spectra of tumor cells. Consequently,cell motility heterogeneity in a set of designed and easily controllable medium conditions,i.e.,an EGF-supplemented medium,were analyzed.VACV and power spectra were effective factors to reveal cells with higher migration persistence,which likely included highinvasive leader cells[12,20]in collective cancer cell invasion.As a demonstration,we applied this method to quantify and compare motility heterogeneity between high metastatic potential MDA-MB-231 and low metastatic potential MCF-7 breast cancer cells.
2.Materials and methods
2.1.Cell culture
Human breast carcinoma MDA-MB-231(China Infrastruture of Cell Line Resource,Beijing,China)were cultured in DMEM(GIBICO,Life Tech)supplemented with 10%Fetal bovine serum(FBS).Breast cancer cell line MCF-7(China Infrastruture of Cell Line Resource,Beijing,China)was cultured in MEM medium containing 10%FBS and 0.01-mg/mL insulin.All of the medium were containing 1%penicillin/streptomycin(Corning). These cells are cultured in a 37-◦C incubator with 5%CO2.
2.2.Microchip fabrication and cell culturing in chip
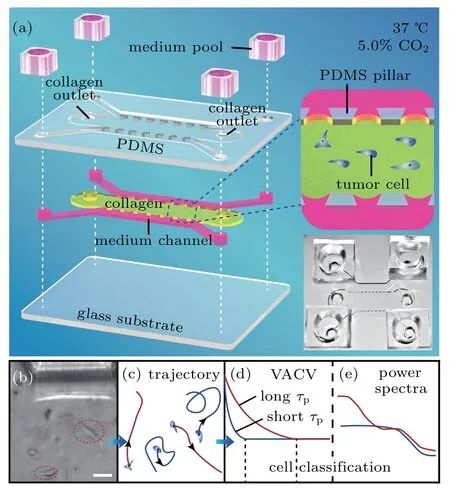
Fig.1.The microfluidic chip structure and cell classification steps.(a)Structure hierarchical diagram of the polydimethylsiloxane(PDMS)microfluidic chips. The PDMS scaffold(top layer)is bonded to a glass substrate(bottom layer),forming three channels(middle layer)separated by two arrays of micro-sized pillars(upper sides 200-µm long,bottom side 400-µm long,and high 200µm)that center spacing 400µm.Tumor cells are injected into the middle channel(7200-µm long and 3000-µm wide)with a collagen solution,which gelatinizes after incubation for 30 min at 37 ◦C and 5.0%CO2.The two shoulder channels are supplied with culture medium pools in experiments.This is also illustrated in the middle-right insert.Bottom-right insert displays a representative photo of a microfluidic chip.(b)and(c)Images of cell movement in collagen(scale bar,50µm)and trajectory diagram,respectively.(d)and(e)Cell classification process diagram,based on VACV with different persistent times(τp)of cells and power spectra,respectively.
Based on soft-lithographic technology,a polydimethylsiloxane(PDMS)chip in 300-µm depth was designed for incubation of live cells on a microscope.As shown in Fig.1(a),the chip[8]consisted of three parallel PDMS channels on a glass substrate,with four medium reservoirs on top. Two micro-sized pillars arrays separated the side channels,where media with various components could be added for microenvironmental control and exchange of nutrition/signaling biomolecules. In experiments,the middle channel was used for cell injection in the final density of 2 mg/mL and the PH value of 7.2 Collagen I(Corning,#354236,U.S.A)adjusted by 1-mol/L NaOH(Fluka),which forms a 3D network microenvironment[21]after gelatinization for 30 min at 37◦C.Subsequently,two side channels were filled with medium or medium containing the final concentration 25-ng/ml EGF,and the entire chip was kept in an incubator with 5.0%CO2 at 37◦C during cell tracking.
2.3.Cell tracking
Cells were monitored in the bright-field mode by an inverted fluorescence microscope Ti(Nikon,Tokyo,Japan)with 20×objective. Time lapse videos were captured using a charge-coupled device(CCD)camera(HAMAMATSU,MODEL C11440-22CU)head DS-Ri 1,and the interval time is 2 minutes.Data collection and imaging analysis were performed using the ImageJ(National Institutes of Health).The acquired images were then processed with ImageJ first and CellTracker[22](Hungarian Academia of Sciences,Hungary)to acquire the trajectories of individual cells in the x–y plane.Therefore,the trajectories were the projections of the 3D motions,a simplified representation with the well characteristics of the latter.The coordinates data were obtained in the semiautomatic tracking model with two tunable parameters,the maximal cell displacement and the cell diameter. The displacement was chosen between 20µm and 50µm,and the cell diameter was chosen between 20µm and 40µm,for different tracking cell,which will have better tracking effect by changing the parameters multiple times.
3.Data analysis
3.1.Mean square displacement(MSD)
In order to quantify the differences,the average MSD versus time trajectories is calculated for both cells as shown in Fig.2,and it is larger for MDA-MB-231 cells than MCF-7 cells in all respective media.
For a rough understanding of the ability of cells migration,we computed the MSD during a time-lapse of duration t,and which is defined in Eq.(1)

where τ=n·∆t and n=1,2,...,and ∆t is the time interval of each frame,anddenotes averaging over time t.
3.2.Migration speed
After obtaining migratory trajectory,we could directly estimate corresponding velocity vectors by
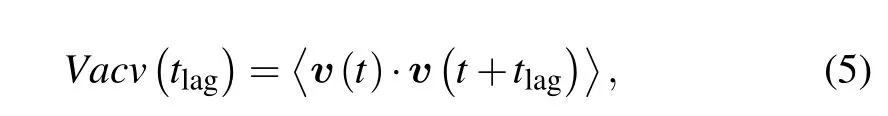
3.3.Velocity auto-covariance function
On the basis of velocity vectors, the velocity autocovariance function is defined as follows:
3.4.Cells classification based on VACV
After obtaining the relationship between the velocity auto-covariance function and time,we have found that there are two kind of exponential decays of auto-covariance function,one is bi-exponential decay,another mono-exponential decay for the same type of cells in same micro-environment.To determine which decay mode the velocity auto-covariance function obeys,we take a few steps as follows:first,fitting experimental velocity auto-covariance function of all cells with Eqs.(6)and(7)

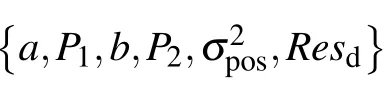
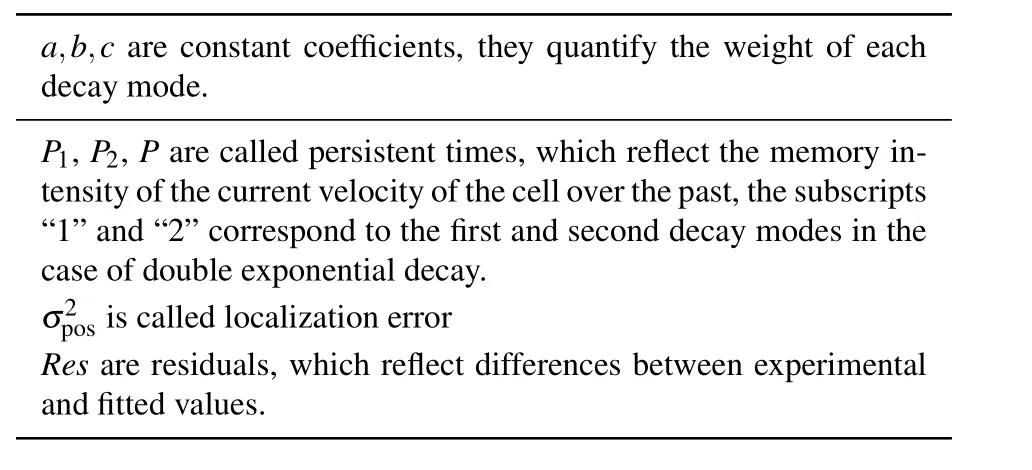
Table 1.The meaning of the obtaining motile parameters.
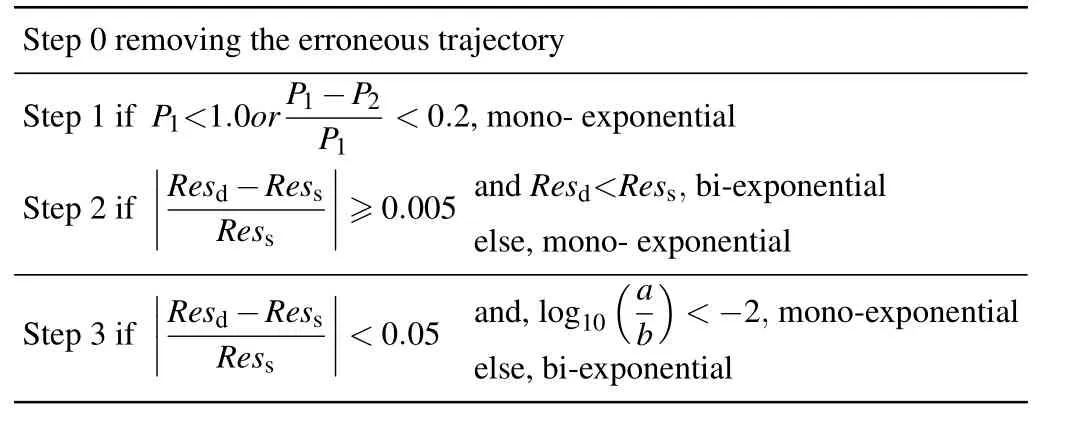
Table 2.The thresholds of physical quantities.
3.5.Power spectrum
Due to the highly correlation of values of auto-covariance function in time,a least-squares fit to those data does not return reliable estimates,what’s more,fits of VACV function cannot return migration speeds of cells.However,the power spectrum can be decoupled from time and not only return persistent time P but also return the speed of cell migration,thus a fit to power spectrum can make up the defect and return reliable values.
According to Wiener–Khinchin theorem,the power spectrum of velocities of cell migration is the Fourier transformation(FT)of the velocity auto-covariance function.There is a definition of discrete FT as follows:
where fk=k·∆f,∆f=1/tmsr,tmsr=N·∆t,k=1,2...,N/2,∆t is the time interval of each frame,N is the total steps in the tracking trajectory.Thus

On the basis of velocity vectors derived from cell trajectories,we could compute experimental power spectrum that fitted by maximum likelihood method(See Supplementary material for detail)using above Eq.(9).
4.Results and discussions
4.1.EGF enhances the motility difference between high metastatic MDA-MB-231 cells and low metastatic MCF-7 cells
In order to study the motility of high-metastatic MDAMB-231 cells and low-metastatic MCF-7 cells,the individual cell trajectories and the changes of MSD over time can be used to illustrate the average motility of the two types of cells[Fig.2(b)].Both the broader migration range and larger MSD of MDA-MB-231 cells(See Supplementary material,Fig.S1)clearly show the higher motility of this metastatic breast cancer cell line.In addition,the motility of MDA-MB-231 cells is significantly improved by the addition of EGF[Fig.2(c)],which EGF is a growth factor that can induce tumor cell invasion.It is noteworthy that uniform EGF environment was constructed by introducing medium of the same concentration into the channels on both sides of the chip,which effectively avoided cell movement caused by EGF gradient.[23]Obviously,the average speed of MDA-MB-231 cells is raised in the presence of EGF,while the change of MCF-7 cells is almost unobservable,in consistent with their metastatic potential.

Fig.2.Motility of the two breast cancer cell lines.(a)Trajectories of MDA-MB-231 breast tumor cells show a larger range of motion after EGF addition.(b)The average MSD vs.time for MDA-MB-231 cells and MCF-7 cells in EGF-and EGF+medium conditions.(c)The speed histograms of MDA-MB-231 and MCF-7 cells in two medium conditions.
The velocity power spectrum is the Fourier transform of the VACV function,and is uncorrelated between various frequencies,[24]so is better for the quantification of cell motility and comparison.To determine factors in cell migration factor contributing to the high mobility of MDA-MB-231 cells,VACV and power spectrum of each cell is analyzed in details. Figure 3 illustrates the average VACVs and power spectra of two cell-lines in two medium conditions.Specifically,EGF addition differentiates the average VACVs between MDA-MD-231 and MCF-7 cells. For MDA-MB-231 cells,the average VACVs remains positive until 20 min in EGFsupplemented medium[Fig.3(b)].For MCF-7 cells,the average VACVs is approximately zero for two medium conditions[Figs.2(a)and Fig.2(b)].This reflects the larger persistence time for MDA-MD-231 cell migrations,indicating it as an appropriate parameter to highlight the diverse mobility between these two cell-lines.
To further confirm and quantify the persistent time difference,velocity power spectra are analyzed. As displayed in Figs.3(c)and 3(d),the average power spectra of two celllines demonstrate significant differences.At the low frequency region,i.e.,<0.02 min−1(corresponding to long persistent time),power is higher for MDA-MB-231 cells,and the difference is enhanced with EGF addition.In contrast,the velocity power for MCF-7 cells shows limited changes with EGF addition and stays at a low level in the whole frequency region analyzed.Therefore,both VACV and power spectra well characterize distinct persistence in migration between two celllines. Moreover,they also showed that MDA-MB 231 cells were more active than MCF-7 cells.
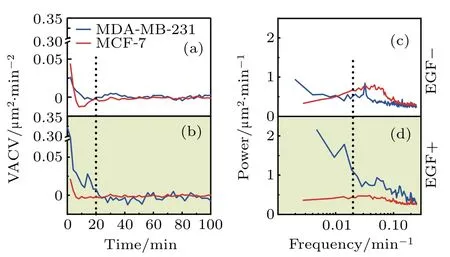
Fig.3.Velocity auto-covariance(VACVs)and power spectra of two breast cancer cell-lines.(a)and(b)Average VACVs of MDA-MB-231(blue)and MCF-7(red)cells in two medium conditions,as indicated.The dashed line refers to t=20 min.(c)and(d)The corresponding power spectra of MDAMB-231(blue)and MCF-7(red)cells.Higher power in the low frequency part of the spectra is found for MDA-MB-231 cells in two medium conditions,and its highest power spectrum is found in EGF+medium.The dashed line highlights the frequency of 0.02 min−1,which is referred to as the low frequency region in the discussion.
4.2.There are subpopulations in each cell line showing different migration modes
Above results clearly display differences in motility by average between two cell lines.It is necessary to analyze the VACV of single cells to look into the details in their motility variations.At the individual cell level,persistence displays great heterogeneity,which could be used as a characteristic for cell mobility heterogeneity.In contrast to clear differences in average trajectories,significant overlap in VACV and power trajectories of individual cells smears the difference between cell-lines.Even for the same cell line,these trajectories from various medium are also overlapping. Nevertheless,we believe that the broad distributions of VACV and power spectra for individual cells could become one of the aspects to characterize heterogeneous cell mobility. Analysis of individual VACV trajectories reveals two behavioral types.Some VACV trajectories could be well fitted by mono-exponential decay,and the others are better fitted by bi-exponential decay(see data analysis section for detailed fitting protocol).
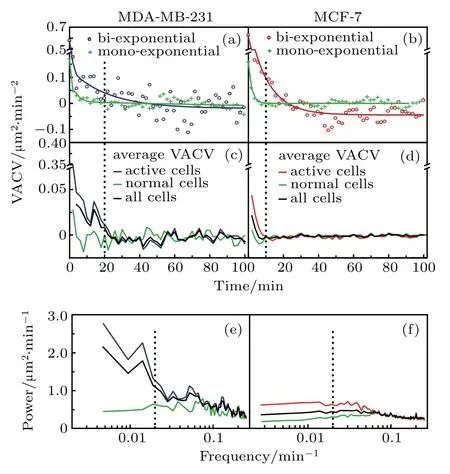
Fig.4.Differentiation of active cells from normal cells by VACVs.(a)and(b)Typical VACV trajectories of individual MDA-MB-231 and MCF-7 cells:active cells(blue or red circles)and normal cells(green crosses),and the fitting curves(solid lines).(c)and(d)Comparison between active and normal cells in EGF+medium:average VACVs of active cells(red or blue)and normal cells(green),compared to average VACV(black)of all cells,for MDA-MB-231 and MCF-7 cells,respectively.(e)and(f)Corresponding power spectra for MDA-MB-231 and MCF-7 cells.These VACVs and power spectra show similar trends for normal cells of both cell-lines.
Figures 4(a)and 4(b)present typical mono-and biexponential VACV trajectories,where bi-exponential trajectories display an additional component with a persistent time longer than that for mono-exponential trajectories.According to this aspect,individual cells are categorized into two subgroups: normal cells(mono-exponential VACV)and active cells(bi-exponential VACV).The general steps of cell subpopulation separation are shown in Figs.1(b)–1(e).Normal cells show a fast decay to zero in their average VACVs,regardless of cell-line[Figs.4(c)and4(d)].In contrast,average VACVs remain positive for ∼20 min and ∼10 min for active groups of MDA-MB-231 and MCF-7 cells in EGF+medium,respectively.Furthermore,the average power spectra[Figs.4(e)and 4(f)]for normal cells from both cell-lines remain at a low level over the whole frequency range,while those for active cells are well separated from normal cells with significant higher power in the low frequency region(i.e.,<0.02 min−1).Similar trends in average VACVs and power spectra for each cell group have been obtained for other medium,regardless of celllines(See Supplementary material,Fig.S3).This validates the above categorization of cell subgroups by persistence heterogeneity.
4.3.The heterogeneity in motility positively correlates to the invasive potential of the two cancer cell lines
To further verify cell categorization and to characterize migration persistence,the power spectrum of each cell is fitted following the reported protocol[24](See Supplementary material,Fig.S4).Figures 5(a)–5(c)and 5(d)–5(f)show histograms of persistent time from power spectra fitting for MDA-MB-231 and MCF-7 cells in EGF+medium,respectively.Clearly,persistent times for normal cells demonstrate similar narrowranged distributions within the experimental time resolution(2 min),irrespective of cell types.This suggests a similar limited memory in the motion of these cells. For active cells,two distinct persistent times are identified.The other persistent time P2(See Supplementary material,Fig.S5)is longer and indicative of“active”cells,i.e.,advancing much further with a better persistence than normal cells.Consequently,the migration mode of P2is expected to contribute significantly to the higher motility potential of invasive cancer cells. These results demonstrate that aforementioned classification of cells into two subgroups is a successful step toward clarifying their mobility heterogeneity.
Next,we investigated differences in subgroup ratios between the two cell-lines. Figure 5(g)illustrates that active cells generally occupy at least 40%of the overall cells in two medium conditions. The ratio of active cells(ract)is consistently higher for high-invasive MDA-MB-231 cells in all tested medium,i.e.,ractclose to or above 60%.In addition,the ract(>70%)for MDA-MB-231 cells in EGF-supplemented medium is higher than(∼60%)without EGF.In contrast,the ractis only around 40%for MCF-7 cells and does not rise upon EGF addition.Furthermore,in EFG+culture medium,more cells in the MDA-MB-231 active subgroup possess a P2longer than 10 min[Figs.5(c)and 5(f)].This suggests ractas a good quantitative parameter for mobility heterogeneity among each cell line.Additionally,it quantifies differences in persistence time between these two cell-lines.

Fig.5.Persistent time of cells in EGF+medium with and ratio of active cells.(a)–(f)Histograms of persistence times from maximum likelihood estimation fitting of power spectra for MDA-MB-231(blue)and MCF-7(red)cells:(a)and(d)persistent time of normal cells,(b)and(e)short persistent time component of active cells,(c)and(f)long persistent time component of active cells.(g)Ratio of active cells in four media types for MDA-MB-231(blue)and MCF-7(red)cells.
Reasonably,ractcould be positively correlated to the metastatic potential of cancer cells,potentially making it a useful reference.It has been reported that in collective invasion of MDA-MB-231 cells,leader and follower cells co-exist.[12,25]The leader cells are expected to possess higher motility and better directionality in comparison to follower cells. Obviously,better persistence increases the chance of tumor cells to migrate further from the original site,and thus extraordinarily mobile leader cells are likely to evolve from the active cell subgroup.In this way,cancer cell heterogeneity in migration persistence could significantly influence invasion processes,and thus the ratio of active cells(ract)is an essential indicator.At the same time,the above approach to obtain the ratio racthas the following advantages:(i)while it evaluates mobility and heterogeneity of cells,ractfocuses more on active cells with a large migration persistent time,i.e.,potential leader cells in collective invasion;(ii)ractprovides a relative scale from 0 to 100%that could be useful in comparison across cell-lines and types;(iii)the absolute ractis independent of other cells;(iv)acquisition of ractis fast(as short as 4 hours),in contrast to no less than 24 hours in conventional methods to evaluate cancer cell invasiveness;(v)the approach could identify active cells while keeping them alive for further investigations,including,but not limited to,the molecular mechanisms(e.g.cell contractive force,cell adhesion to collagen,secreted protease,etc.)of cancer cell invasion,[16,26–28]impact of physiological conditions,and environmental factors(e.g.growth factor gradient,matrix fiber orientation,etc.[29,30]
5.Conclusion
In order to quantify the motility of breast tumor cells and identify the subgroup of more mobile cells(potentially high invasive)for cancer metastasis investigation and future clinic application,we developed a rapid and unique approach in combination of the microfluidic chip,3D tracking analysis and cell sub-group identification to distinguish the higher invasive MDA-MB-231 and the low invasive MCF-7 cells by their motility and heterogeneity. Significant heterogeneity among the motility of individual cells in each cell group is successfully quantified by the ratio ractof active cell subgroup identified with our approach.It turns out that the EGF is a good promoter to differentiate active cells from normal cells and enhances the ratio ractof high-metastatic potential cells,but not low-metastatic potential cells.The higher population of active MDA-MD-231 cells together with its much enhanced motility and persistence,are positively correlated to the high invasiveness of MDA-MD-231 cells in contrast to MCF-7 cells.Thus,the method of identify active cell population,ract,in an EGF+media introduces a new,rapid and effective way to evaluate the invasive potential of cancer cells.In addition,the separation of active motile cells from normal cells also provides a well-defined approach for cancer invasion and metastasis investigation.We believe that the above approaches may apply to primary tumor cells in clinics and potentially provide physicians with a quantitative reference.
猜你喜欢
——中储天津新港分公司安办副主任袁伟
中国储运(2022年6期)2022-06-18
青春(2021年6期)2021-06-01
做人与处世(2020年14期)2020-08-28
青春(2019年8期)2019-10-20
校园英语·上旬(2018年13期)2018-01-23
小康(2017年26期)2017-09-26
中国石油企业(2015年10期)2015-09-24
金融周刊(2013年39期)2013-11-29
故事会(2011年4期)2011-02-17

- Chinese Physics B的其它文章
- Compact finite difference schemes for the backward fractional Feynman–Kac equation with fractional substantial derivative*
- Exact solutions of a(2+1)-dimensional extended shallow water wave equation∗
- Lump-type solutions of a generalized Kadomtsev–Petviashvili equation in(3+1)-dimensions∗
- Time evolution of angular momentum coherent state derived by virtue of entangled state representation and a new binomial theorem∗
- Boundary states for entanglement robustness under dephasing and bit flip channels*
- Manipulating transition of a two-component Bose–Einstein condensate with a weak δ-shaped laser∗