
Theory and method of dual-energy x-ray grating phase-contrast imaging∗
2019-11-06 00:46FengRong荣锋YanGao高艳CuiJuanGuo郭翠娟WeiXu徐微andWeiXu徐伟
Chinese Physics B 2019年10期
关键词:徐伟
Feng Rong(荣锋),Yan Gao(高艳),Cui-Juan Guo(郭翠娟),Wei Xu(徐微),and Wei Xu(徐伟)
1College of Electronics and Information Engineering,Tianjin Polytechnic University,Tianjin 300387,China
2Tianjin Key Laboratory of Optoelectronic Detection Technology and System,Tianjin Polytechnic University,Tianjin 300387,China
Keywords:x-ray imaging,dual-energy analyzer grating,phase retrieval
1.Introduction
Traditional x-ray imaging is based on the varied absorption of x-rays by the different materials in the object of interest.While it is widely used in medical imaging and industrial non-destructive testing,the poor absorption of x-rays by soft tissues in organisms,such as in ligaments and tumors,results in poor absorption contrast.Fortunately,phase contrast imaging can compensate for this deficiency.Absorption and phase contrast of x-rays result from the attenuation of their amplitudes and shifts of their phases,respectively.Upon exposure to hard x-rays(0.01 nm–0.1 nm),the shift of phase is at least three orders of magnitude higher than that caused by the attenuation of amplitude.Even for thin specimens,the presence of light elements can cause an obvious phase contrast.This means that phase-contrast imaging can achieve more detailed imaging of specimens that are unrecognizable when imaged by absorption contrast.Therefore,for objects composed of light elements,detecting a shift of phase is easier and more efficient than detecting an attenuation of the amplitudes.
Since the late twentieth century,various forms of x-ray phase-contrast imaging have gradually been developed. Although the crystal interferometer[1]and free-space propagation techniques[2]yield ideal results for specific problems,none of them has found wide applications in medical or industrial area,which typically require the use of a laboratory x-ray source,a large imaging field of view and good imaging system stability.Grating phase contrast imaging represented by the Talbot–Lau interferometer[3]can solve the above problems. However,its corresponding method of retrieving the phase,called“phase stepping”,requires the multi-stepping of the grating in its single period with the sample existing,which will bring two limitations. The first limitation is that the objects need to be exposed to x-rays at least three times(generally 5–11 times),prolonging the data acquisition time,and causing the ionizing x-ray radiation to be absorbed excessively,which may leads organisms to suffer from genetic disease or even carcinosis.The second limitation is that the grating must be moved in micron-sized steps,thus requiring a high-level mechanical precision. The reduction of radiation doses during x-ray imaging and the number of phase steps have been a focus of recent investigation.
Zhu et al.[4]proposed a method of projecting objects forward and backward without a stepping device for grating in 2010. Their method reduces the exposure time but requires high grating uniformity. Liu et al.[5]proposed a two-step method by combining the analyzer grating with fluorescent screen in 2010.However,a stepping device was still required.In 2017,for free-space propagation techniques,Wang et al.[6]proposed an excellent method,which is expected to be used in zero-step grating phase contrast imaging. In 2010,Kottler et al.[7]applied the dual-energy modality of the traditional x-ray imaging to the Talbot–Lau interferometer,thus enabling the phase contrast imaging to discriminate the information about the specific material composition.With this background,Rong[8]et al.proposed the dual-energy x-ray grating phase contrast imaging(DEPCI)with a dual-energy analyzer grating[9]in 2018. With omitting the stepping device,only the working energy in the DEPCI system needs to be changed once in the imaging experiment.However,accurate theoretical calculations have not yet been made for this method of retrieving the phase.In this paper,the theoretical framework of DEPCI is first elaborated.Furthermore,a new method of retrieving the phase is proposed.The relevant simulation and experimental results demonstrate the effectiveness of this method.
2.Theoretical background
As shown in Fig.1,the DEPCI system is composed of a normal x-ray source,a source grating G0,a phase grating G1,a dual-energy analyzer grating G2,and a charge coupled device(CCD)detector.The object is placed near the front of G1.All components are centrally coaxial.The G0–G1distance,l,is larger than G1–G2distance,d.
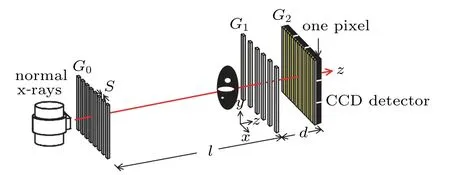
Fig.1.Model of DEPCI system.
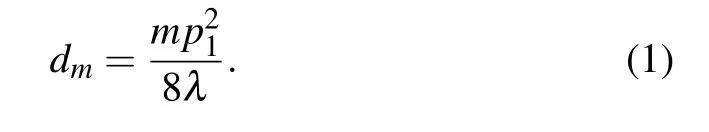
The source grating G0divides the normal x-rays into several slit x-rays.In particular,x-rays within the same slit are coherent.The Talbot effect occurs when the spatial coherence length lcohmeets the condition lcoh=lλ/s>p1,where λ,p1,and s denote the wavelength of the x-rays,period of grating G1,and slit width of G0,respectively.The coherent x-rays in each slit produce an interference fringe called the self-image of G1at the Talbot distance downstream of G1.As shown in Fig.2,self-images and grating G2have the same period.[10]In order to improve the transmission efficiency of x-rays,a π phase grating is selected as G1.The m-th order Talbot distance dmcan be calculated from[11]
Then,the Lau effect occurs if p0/p2=l/d,where p0and p2denote the periods of G0and G2,respectively.All the interference fringes are staggered by one period and superimposed incoherently.Therefore,the contrast of the total interference fringe is greatly enhanced,even without a highly coherent xray source.
However,the period of a self-image is typically a few microns,which is smaller than the minimum resolution of CCD detector.Therefore,a dual-energy analyzer grating G2is overlapped with the self-image at an angle to form large-period moirè fringes. The coordinates of the self-image and dualenergy analyzer grating are shown in Fig.2. A dual-energy analyzer grating is staggered with low-energy and high-energy grid bars.The joints of low-and high-energy grid bars align with the center of bright or dark stripes in the self-image.The low-energy grid bars convert the low-energy x-rays into visible light,and the high-energy grid bars block low-energy xrays from passing through.The high-energy grid bars convert high-energy x-rays into visible light,and the low-energy grid bars allow high-energy x-rays from passing through directly without being converted to visible light.[8]

Fig.2.Effect diagram for the dual-energy analyzer grating.
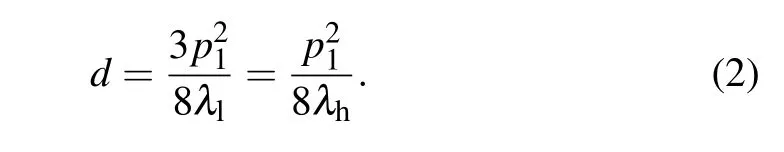
The alternating response of the high-and low-energy grid bars of G2to high-and low-energy x-rays are equivalent to a step in the traditional grating of Talbot–Lau interferometer.Therefore,it is necessary to ensure that the Talbot distance and fringe distribution of the self-images in high-and low-energy x-rays are consistent with each other. According to Eq.(1),if λl=3λh,where λhand λldenote the wavelengths of highand low-energy x-rays,respectively,the third-order Talbot distance of low-energy x-ray imaging is equal to the first-order Talbot distance of high-energy x-ray imaging. Therefore,d can be calculated from
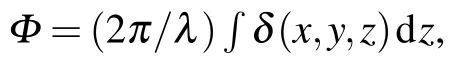
The physical description of object can be expressed by a complex refractive index n=1−δ+iβ,where the real part δ and the imaginary part β represent the phase factor and absorption factor,respectively.The formula for the phase factor[12]can be derived from Maxwell’s equations as δ=ρλ2NA∗reZ/2πA∗,where ρ is the mass density,reis the classical radius of the electron,NA∗is Avogadro’s constant,Z is the atomic number of the element,and A∗is the atomic mass. Therefore,if λl=3λh,the relationship between the phase factors of the high-energy x-rays δhand the phase factor of the low-energy x-rays δlis

Assuming that δgis the phase factor of G1,which has thickness T,the phase change ∆ϕ of the x-rays caused by G1can be calculated from[13]

In DEPCI,G1is designed to shift the phase of the lowenergy x-rays by π.Correspondingly,G1shifts the phase of the low-energy x-rays by 3π.The self-images of the π and 3π phase grating are consistently distributed.[14]
3.Intensity distribution
As shown in Fig.3,Σs,Σp,and ΣDrepresent the sourcegrating,phase-grating,and detector planes,respectively,with Σsbeing far away from Σp.Furthermore,the size of each slit s is so small that the incident x-rays are approximated as divergent spherical waves.
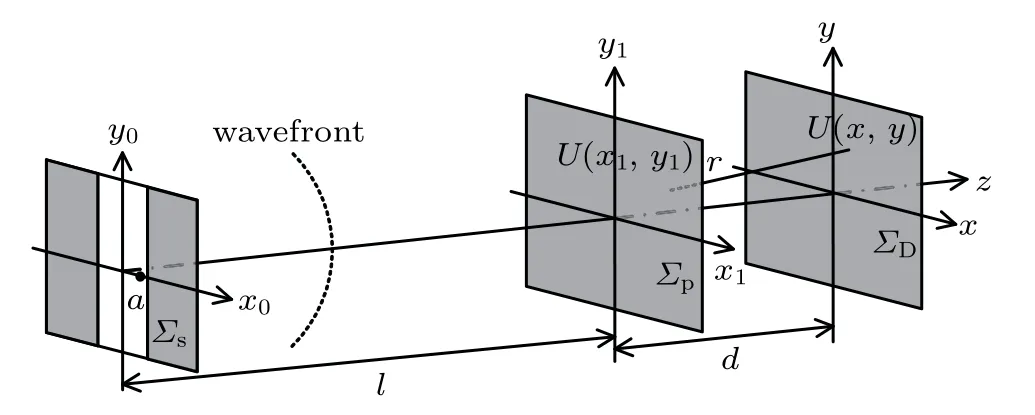
Fig.3.Schematic diagram of coherent x-rays propagating in DEPCI system.
The complex wave-front amplitude propagating from the point source a of Σsto Σpis expressed as
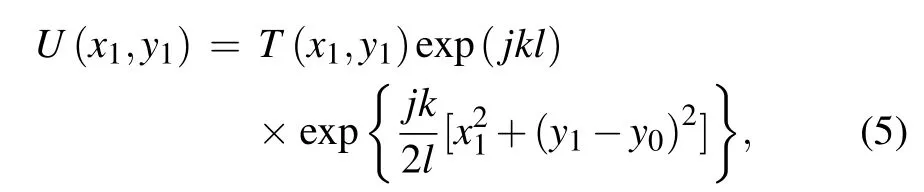
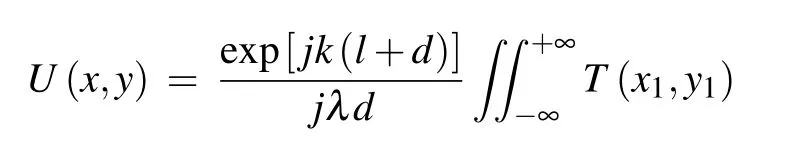
where T(x,y)is the transfer function of the phase grating and k=2π/λ is a wavevector. After passing through the phase grating,the spherical wave follows the Fresnel–Kirchhoff diffraction.The complex wavefront amplitude U(x,y)at ΣDis

where r represents the distance from a point in Σpto a point in ΣD.The sample size is much larger than the x-ray wavelength,so it conforms to the paraxial approximation,i.e.,
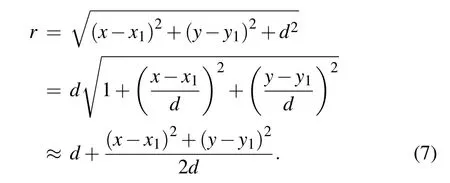
The approximation is reached by substituting d for r in the denominator of Eq.(6).In the numerator,a change in r will cause the exponential value to change dramatically.Therefore,if r in the numerator takes a second-order approximation as shown as Eq.(7),then equation(6)can be written as

Equation(8)can be reorganized into

with
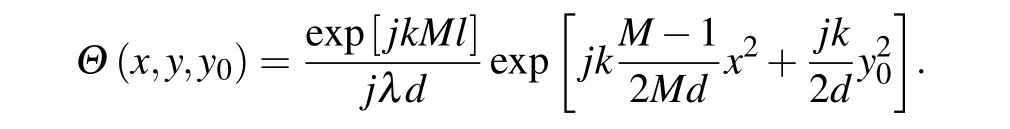
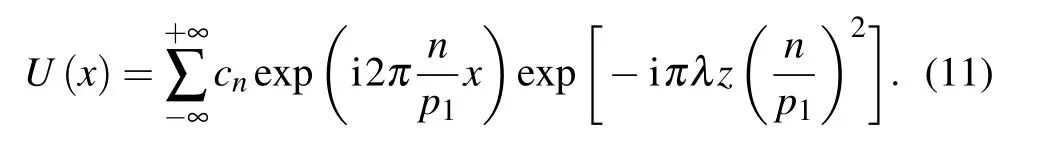
The Fourier series of the transfer function of G1is
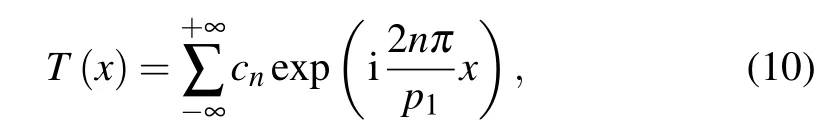
where cn=sin(π/2)sinc(n/2)(n=±1±2,...)is the Fourier coefficient. In DEPCI,ld,so the magnification M=(l+d)/l ≈1.Combining Eq.(9)with Eq.(10)yields
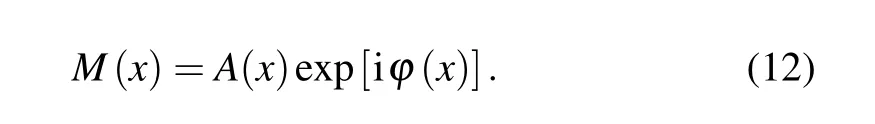
When a sample is placed in the DEPCI system,x-rays undergo amplitude(A(x))attenuation and phase(ϕ(x))shift.According to Ref.[15],the transmission function M(x)of the sample is
The phase grating G1splits the x-rays,producing a shear expressed as s=zλ/p1. In particular,zeroth-order diffraction results in enhanced background imaging,which reduces the fringe contrast.The π phase grating eliminates the zerothorder diffraction,allowing more than 80%of the intensity to be concentrated on the±1st order diffraction.[16]Therefore,in this paper we only consider the±1st order diffraction and p2=p1/2.[17]Combined with Eq.(12),equation(11)can be written as
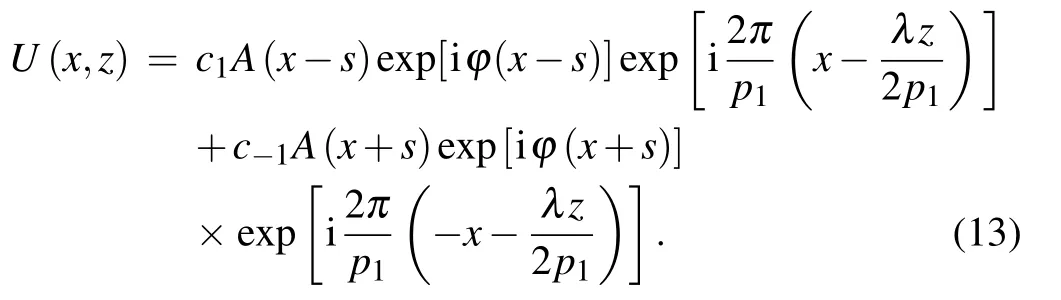
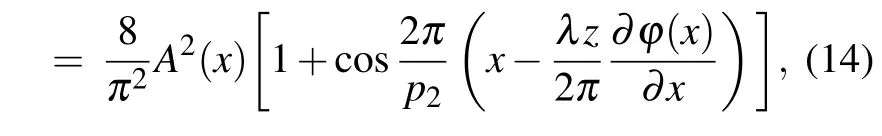
For hard x-rays in light-element objects,the shear quantity of the amplitude attenuation is quite small,so we can reasonably take the following approximation: A(x−s)≈A(x+s)≈A(x). Due to c1=c−1=π/2,the intensity distribution at ΣDis

It should be noted that as the x-ray energy increases,the values of the absorption cross sectionstend to be constant and their dimensions are on the order of 10−23.This means that the linear absorption coefficientµl(x,y,z)of the lowenergy x-ray and the linear absorption coefficientµh(x,y,z)of the high energy x-ray are approximately consistent with each other.
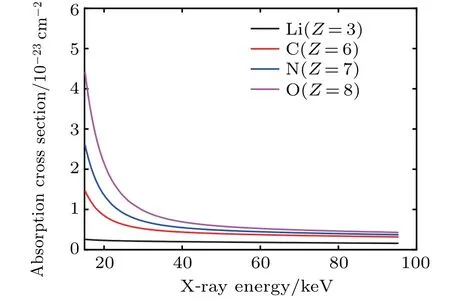
Fig.4. Curves of absorption cross section versus x-ray energy for 4 different light elements.
4.Phase recovery method
As shown in Fig.5,χ represents the relative displacement between the self-image and G2.With alternating highand low-energy grid bars along the x axis,the normalized intensity of a pixel changes sinusoidally.The duty cycle of G2is 1:2.When a single pixel contains N periods of self-imaged fringes,the intensity of a single pixel is given by
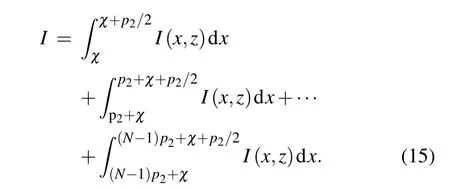
If we assume the optical coupling efficiency of G2to be an ideal value,and consider Eq.(14),we can rewrite Eq.(15)as
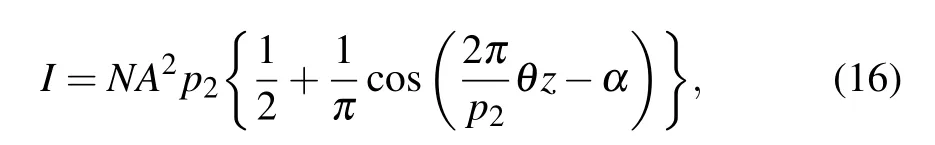
where θ=(λ/2π)(∂ϕ(x)/∂x)is the refraction angle[20]and α=2πχ/p2.In the DEPCI experiment,two interferograms are collected by using the setup as shown in Fig.1,first at low energy corresponding to χ=−p2/4,and second at high energy corresponding to χ=p2/4.The refraction angle caused by the same object under low-and high-energy x-rays are expressed by θland θh,respectively.The intensity obtained by the detector in low-and high-energy x-ray imagings are denoted by Iland Ih,respectively.According to the expression for θ,we can conclude that θl=9θh.Consequently,the intensities Iland Ihare
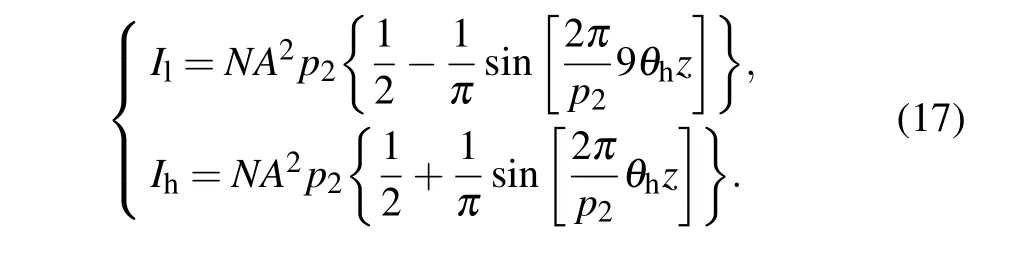
Solving the above equations gives
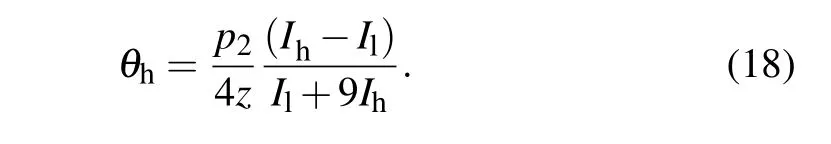
This is similar to the formula mentioned in Ref.[21].The absorption information of the sample can also be further obtained as follows:
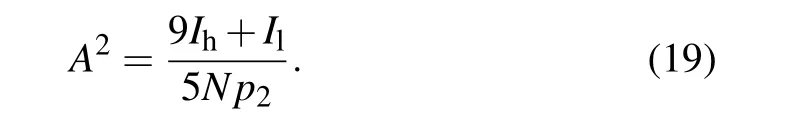
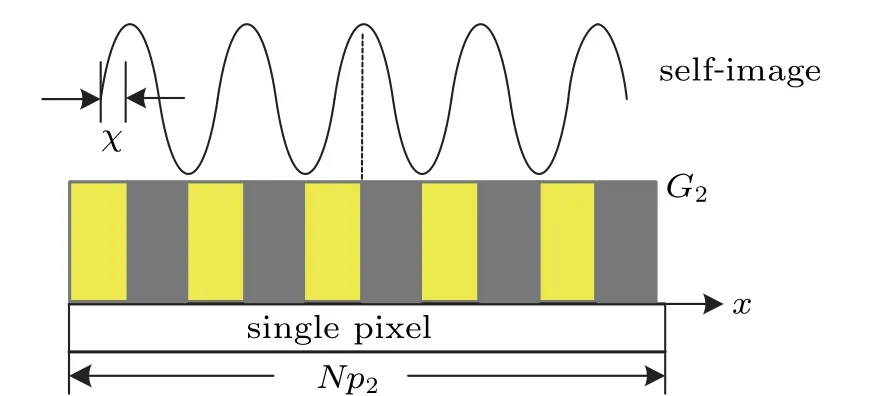
Fig.5.Model for detecting self-image by using dual-energy analyzer grating.
5.Simulation and experiment
5.1.Simulation of DEPCI system
To demonstrate the feasibility of the proposed method,we simulated the imaging procedure of DEPCI with a PMMA-formvar ball. The ball had an average density ρ=1.19 gm/cm3,and filled half of the entire field of view. To meet λl=3λh,20-keV and 60-keV x-rays were selected as sources with low energy Eland high energy Ehby using λ=1.24×10⁻⁹/E(keV).[22]After the appropriate normalization of the two interferograms in intensity,the calculations of the normalized interferograms as shown in Eq.(18)yielded the phase contrast image of the sample,which is shown in Fig.6(a).Its relevant line profile is shown in Fig.6(b).
As shown in Fig.6(a),a clear phase contrast image of the PMMA-formvar ball can successfully and clearly be obtained.Furthermore,it can be seen from Fig.6(b)that the simulation results are consistent with the experimental results from Ref.[3]. The refraction effect is obvious at the edge of the ball,which proves that the method of phase retrieval given by Eq.(18)is applicable to DEPCI.

Fig.6.(a)Phase contrast image,(b)line profile corresponding to red line in panel(a).
5.2.Experiments
During the DEPCI experiment,the focal spot size of the conventional tungsten target x-ray source was 1 mm×0.8 mm.An x-ray energy radiation detector was used to calibrate the energy of x-rays.Since the required exposure decreased as the difference between the two energies increased,[23]the widespectrum x-rays with the central photon energy of 20 keV and 60 keV were selected as the values of low and high energies,respectively.The tube current was also adjustable from 2 mA to 4 mA.The duty ratios of G0and G1were 1:3 and 1:2,respectively.The following parameters were used in the simulation:p0=24.6µm,p1=9.6µm,p2=6µm,d=55.7 cm,and l=228.4 cm. The sample was a crayfish,and p2was coupled with a 2048×2048 pixel(96µm/pixel)CCD camera.The exposure time of each interferogram was 8 s.The phase and absorption contrast images of the sample can be obtained by Eqs.(18)and(19).The effects of the reconstructed images are shown in Figs.7(a)and 7(c).Furthermore,for the sake of analysing the effect of DEPCI,we performed a four-step phase stepping by using a Talbot–Lau interferometer. The central photon energy of wide spectrum x-rays was 30 keV.The effects of the reconstructed images are shown in Figs.7(b)and 7(d).Two body parts of the sample marked in Figs.7(a)and 7(b)were used to fit the data,and the results are shown in Figs.7(e)and 7(f).
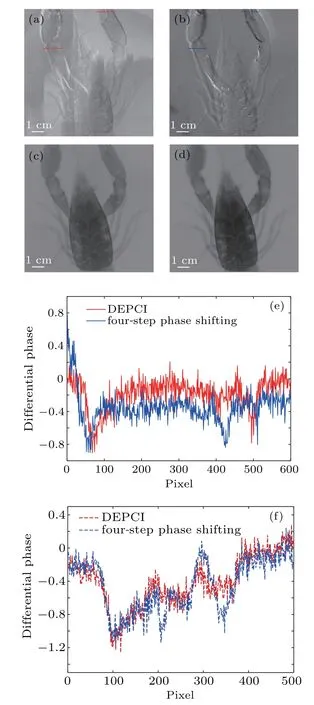
Fig.7.(a)Phase contrast image using DEPCI system,(b)phase contrast image using Talbot–Lau interferometer,(c)absorption contrast image using DEPCI system,(d)absorption contrast image using Talbot–Lau interferometer,(e)data fitting for the cross-section of solid line in panels(a)and(b),and(f)data fitting for cross-section of dashed line in panels(a)and(b).
From the extracted information shown in Fig.7,it can be intuitively seen that the structural characteristics of the sample are successfully demonstrated.The energy of the x-rays used in the Talbot–Lau interferometer was different from that used in DEPCI during the experiments.Illuminating the same object,the x-rays with different energies will produce different phase shifts. In this case,if the trends presented in the two reconstructed phase contrast images are consistent and correspond to the structure of sample,we can determine that the reconstructed images are correct.As can be seen in Figs.7(e)and 7(f),the trend of the differential phase obtained by the proposed method is almost the same as that obtained by four-step phase stepping.
However,the DEPCI has a disadvantage that it cannot be used for dark field imaging.In Ref.[24],equation(16)is written in Fourier series.The 0th and 1st Fourier coefficients constitute the expression of dark field information of object.In the DEPCI,only the ratio of 0th Fourier coefficients can be calculated through the relationship between high and low energies of x-rays,while the 1st Fourier coefficients cannot.Furthermore,the surface contrast in dark field imaging requires sufficient intensity of incident x-rays.[25]From Figs.7(a)and 7(c),we can see clearly that the intensity obtained by the DEPCI system is weak,compared with the intensity obtained by the Talbot–Lau interferometer. This indicates that the x-ray energy utilization in the DEPCI system was low.Future improvements to the design of the dual-energy analyzer grating and grating fabrication process may break through this limitation.
6.Conclusions and perspectives
In this paper,we present theoretical calculations for DEPCI.Furthermore,by exploiting the intrinsic phase change and characteristics of linear absorption coefficient of lowand high-energy x-rays,a method of retrieving the phase for DEPCI is found. The results of simulation and experiment demonstrate that this method is suitable for DEPCI.The phase-contrast image recovered from the two interferograms collected by the DEPCI without moving any device has a similar effect to the phase-contrast image recovered from the four interferograms collected by the Talbot–Lau interferometer by moving the grating four times.Due to the short exposure time,high stability,and computed tomography(CT)compatibility,the DEPCI may become,we believe,a popular method of obtaining the x-ray grating phase contrast imaging.
猜你喜欢
Chinese Physics B(2022年6期)2022-06-29
莫愁·时代人物(2022年6期)2022-06-15
计算技术与自动化(2022年1期)2022-04-15
Plasma Science and Technology(2021年5期)2021-05-22
Plasma Science and Technology(2021年2期)2021-02-27
华中科技大学学报(社会科学版)(2020年2期)2020-05-08
河南教育·职成教(2020年2期)2020-04-14
做人与处世(2007年7期)2007-06-30

- Chinese Physics B的其它文章
- Compact finite difference schemes for the backward fractional Feynman–Kac equation with fractional substantial derivative*
- Exact solutions of a(2+1)-dimensional extended shallow water wave equation∗
- Lump-type solutions of a generalized Kadomtsev–Petviashvili equation in(3+1)-dimensions∗
- Time evolution of angular momentum coherent state derived by virtue of entangled state representation and a new binomial theorem∗
- Boundary states for entanglement robustness under dephasing and bit flip channels*
- Manipulating transition of a two-component Bose–Einstein condensate with a weak δ-shaped laser∗