
Theoretical investigation of the pressure broadening D1 and D2 lines of cesium atoms colliding with ground-state helium atoms
2019-11-06 00:43MoussaouiAbdelazizAliouaKamelAlloucheAbdulrahmanandBouledrouaMoncef
Chinese Physics B 2019年10期
Moussaoui Abdelaziz,Alioua Kamel,2,†,Allouche Abdul-rahman,and Bouledroua Moncef
1Université Chérif Messaidia,B.P.1553,Souk-Ahras 41000,Algerie
2Laboratoire de Physique de la Matière et du Rayonnement LPMR,Université Chérif Messaidia,B.P.1553,Souk-Ahras 41000,Algerie
3Université Lyon 1,CNRS,LASIM UMR5579,bât.A.Kastler,43 Bd du 11 novembre 1918,F-69622 Villeurbanne,France
4Laboratoire de Physique des Rayonnements LPR,Université Badji Mokhtar,B.P.12,Annaba 23000,Algerie
Keywords:absorption coefficient,emission coefficient,pressure broadening,potential curves
1.Introduction
The principal and dominant alkali-metal D1and D2lines,broadened by elastic collisions with rare-gases,have been a subject of many theoretical and experimental studies. More precisely,the determination of the profiles and satellite features in the wings of the heavy alkaline atoms evolving in the bath of He atoms has been,very recently,the goal of several theoretical[1–7]and experimental[5,8,9]works.
On the other hand,the spectroscopic studies of the alkali–rare-gas system have demonstrated their significance in a few fields,such as astrophysics and laser physics. In fact,the experimental measurement or theoretically simulation of the absorption–emission spectra must be a crucial tool for determining the physical and chemical properties of the environments of extrasolar giant planets and brown dwarfs.[10–16]Furthermore,the analysis of the collisionally induced spectral broadening of the D1and D2lines has played a very significant role in the conceptual design and manufacturing of several new type and efficient lasers,namely,the diode-pumped alkali lasers(DPAL),[7,17–20]and the excimer-pumped alkali vapor lasers(XPAL),[21–24]which was proposed as an alternative to high-power diode-pumped solid-state lasers,and could be used not only for technological applications but also for very important medical application in magnetic resonance imaging.
As far as we know,the photoabsorption profiles generated by the pressure-broadening of D1and D2lines of cesium atom immersed in a bath of diluted helium gas has been studied theoretically,in the frame work of classical theory,by Allard et al.[1]and Hager et al.[5]using the unified and Anderson–Tallman theories,respectively.In addition,the photoemission profiles are experimentally realized by Hedges et al.,[8]however,the photoabsorption spectra are very recently measured by Hager et al.[5]
The primary focus of the current work is to determine,in the framework of purely quantum mechanical study,the photoabsorption and photoemission profiles of the D1and D2lines of the cesium atom perturbed by the helium one,and the satellite features appearing in the wings.We also analyze carefully the behavior of the shape profiles,the form of the satellites,and their positions at certain well-defined temperature values.
For this purpose,we start with calculating the potentialenergy curves (PECs) of the low-lying CsHe molecular states,namely,the groundand the excited,andstates,and the transition dipole moments(TDMs)for the allowed transitions,that is to say,andThe ab initio calculations are performed at different levels of theory,starting with the state-averaged complete active space self-consistent field(SA-CASSCF)followed by the multireference configuration interaction(MRCI)method with Davidson correction,and ending by the spin–orbit(SO)coupling effects including the basis-set superposition error(BSSE)corrections.All these methods are implemented in MOLPRO package.[25]In order to assess the accuracy of the obtained PECs and TDMs curves,we have determined their spectroscopic parameters,and the ro-vibrational energy levels of the molecular states.To ensure the quality of the absorption–emission profiles and satellite features,the results are finally compared with previous theoretical and available experimental work.
2.Pressure broadening coefficients

We must precise that during the transition process,the first broadened D1line of absorber–perturber is attributed to the transitions between the groundstate and the first excitedstate of CsHe quasi-molecule,while the second broadened D2line is attributed to the contribution of transitions between the groundstate and the second excitedstate on one hand,and between thestate and the third excitedstate on the other hand.Since bothandstates are dominantly repulsive whereas theandstates are less deep,we consider in such case only the free–free(ff)and free–bound(fb)transitions.
In the following,we will especially focus on the determination of reduced coefficients of the photoabsorption and the photoemission.
2.1.Absorption coefficients
One can characterize the pressure-broadened profile of the cesium D1or D2resonance line in the presence of the helium He(1s2)atoms by defining the temperature-dependent reduced absorption coefficient αr(ν)at frequency ν in such way that the free–free reduced absorption coefficientsat frequency ν,[26,27]corresponding to transitions from the lower(l)to upper(u)continuum levels,are expressed at temperature T by

where the symbols appearing in this formula,namely,c,h,kB,and stand for the speed of light,the Plank’s constant,the Boltzmann’s constant,and the reduced mass,respectively.The electronic energy levels,εland εu,are related via the relationship

with ν0being the frequency of the D1or D2resonance line. Moreover,the free–bound reduced absorption coefficientsderived for the transitions from all lower continuum levels to a set of upper bound levels are given by the relation

where the integer numbers J and v are the rotational and vibrational quantum numbers,respectively.The factor ω is the probability that a transition takes place towards a final state.The transition factors corresponding to theandstates are ω=1,ω=2/3,and ω=1/3,respectively.
We notice that the rotational quantum numbers J involved in the computations are generally very large.It is,therefore,possible to assumeThe transition dipole moment is defined bywhere riis the coordinate of the i-th electron,stands for all electronic coordinates,andis the electronic wave function at the internuclear distance R.
Furthermore,the radial-wave functions g(R),as well as the transition dipole moments D(R),are needed to compute the matrix elements shown in Eqs.(1)and(5),which vary with the nuclear separation R,and the wave functions are the solutions of radial Schrödinger equation

where V(R)is the electronic potential energy of the CsHe system at hand and ε is the energy of the relative motion.Note that the free wavefunctions u(R)=uεJ(R)are energynormalized,while the bound wavefunctions u(R)=uvJ(R)are rather space-normalized,and both ε and V(R)are measured with respect to the respective dissociation limits.
2.2.Emission coefficients
For the emission spectra,we consider for the D1line the bound–free and free–free transitions between theandstates.For the D2line,we take into consideration the two bound–free and free–free transitions between theandstates and only free–free transitions between theandstates.
On one hand,the free–free reduced emission coefficientsare given at temperature T by[28–30]and on the other hand,the bound–free reduced emission coefficientsare expressed by


In the equations cited above(Eqs.(1),(3),(5),and(6)),it appears clearly that for every internuclear distance R,the electronic interaction potentials V(R)of molecular states and the corresponding transition dipole moments D(R)must be determined accurately.
3.Potential energy curves and transition dipole moments
We investigate the fourth low-lying doublet electronic states of the molecule CsHe using complete active space self consistent field(CASSCF)procedure followed by a multireference configuration interaction with Davidson correction treatment for the electron correlation. The energies for Ωstates have been obtained using the state-interacting method,which means that the spin–orbit eigenstates are obtained by diagonalizingin a basis of eigenfunctions ofwhereis the electronic Hamiltonian andis the spin–orbit pseudo-potential.elements matrix are calculated at CASSCF/MRCI level of method and the spin–orbit coupling terms are calculated using a spin–orbit pseudo potential.The basis set superposition error(BSSE)is taken into account using the counterpoise method(CP)approach.[31]All calculations are made using the computational chemistry program Molpro.[25]
We use the aug-cc-pCV5z[32]basis set for helium atom while the small Stugrart relativistic pseudopotential is used for Cs atom,[33]with its corresponding basis set for s,p,d,and f,and after small modifications for the last four exponents p basis set that become:0.121000,0.065500,0.016200,0.0061 with two additional ones which are 0.0026,0.0016 and leaving intact their coefficients. The change are also made on the last two sets of three parameters that belong to the term series of p spin–orbit pseudopotential. These two sets of parameters are: (2,2.280961580,−23.7438456037161)and(2,2.103490505,23.7485580204565).
In this pseudo potential,only 9 electrons are explicitly considered. In CsHe molecule,the s and p inner orbitals of Cs and the 1s of He are considered as closed orbitals and 1 valence electron is explicitly treated using 6 active orbitals in our CASSCF calculation.The correlations of inner electrons are treated at MRCI level of theory.All computations are performed without symmetry.

Fig.1. CsHe potential-energy curves V(R)(in a.u.) for the ground and excited and molecular states.

Table 1.Calculated atomic energy levels(in cm−1)of the Cs atom compared with results from National Institute of Standards and Technology(NIST)recommended data.
Table 1 shows our calculated energy transitions for2P1/2and2P3/2states for Cs atom. Compared to experimental values,[34,35]we are able to reproduce these values with an error of only 11 cm−1corresponding to a relative error of about 0.09%.For CsHe molecule,the potential energy curves and the dipole moment functions are performed over the interval 2for the fourth states considered in our calculation,namely,andFrom now,in order to lighten the writing,we use,if necessary,the following non-conventional notation for the abovementioned states,i.e.,X1/2,A1/2,A3/2,and B1/2.The energy curves of the X1/2,A1/2,A3/2,and B1/2states are shown in Fig.1. Likewise,the transition dipole moments DΣ1/2−Π1/2,,andof theand B1/2←X1/2transitions,respectively,are shown in Fig.2.Their corresponding spectroscopic constants are given in Table 3. It is clear that both X1/2and B1/2states are mostly repulsive,whereas the A1/2and A3/2states have very shallow wells.Compared to available theoretical values in literature,the equilibrium distances for the X1/2and B1/2states are close to each other,and the well depth of X1/2state is shallower than that calculated by Blank et al.[2]and comparable with these of Medvedev et al.[36]while our calculated value of dissociation energy of B1/2state is three times bigger than that calculated by Blank et al.[2]For A1/2,our calculated equilibrium distance and dissociation energy are very close to those calculated by Blank et al.,[2]Zbiri et al.,[37]and Enomoto et al.[38]The potential of A1/2has a barrier and a second minimum at long distance.Our barrier measured from the dissociation limit is about 74.2 cm−1at R=4.7,in very good agreement with 75.2 cm−1at R=5.0obtained by Enomoto et al.[38]and in agreement with 57.7 cm−1at R=4.87obtained by Blank et al.[2]Our second minimum has a well of −0.25 cm−1from the dissociation limit,located at 10.6to be compared to−1.9 cm−1at R=9.2obtained by Blank and his coworkers.Concerning A3/2,our calculated spectroscopic constants are close to that predicted by Blank et al. while there is a disagreement with values calculated by Pascal et al.and by Zbiri et al. The vibrational energy levels of A1/2and A3/2have been calculated by Blank et al.using an ab initio method and by Enomoto et al. using a semi-empirical approach to take account of the spin–orbit effect.These values and ours are shown in Table 2.For A1/2,only one vibrational state is predicted in all works with a good agreement for energy level between our value and that predicted by Blank et al.[2]and by Enomoto et al.[38]However,for A3/2,we have predicted four states while six vibrational states have been predicted by Blank et al.[2]and five ones by Enomoto et al.[38]Note that only three vibrational states have been observed experimentally.[38]To our knowledge,the experimental spectroscopic constants are not yet available in literature. The dipole moment functions from the three electronic excited states to the ground state are shown in Fig.2.At long distance(R>12),the three functions converge toward a unique value. It is about 3.44 atomic units(a.u.),corresponding to a line strength of about 23.73 a.u.,in good agreement with the atomic experimental value 20.23 a.u.for2P1/2atomic state.[39]The line strength of A3/2plus that of B1/2gives a value of 47.46 a.u.to be compared to 40.08 a.u.,the atomic experimental of2P3/2−2S1/2transition.[39]As shown in Fig.2,the dipole moments change slightly with the internuclear distance.The variation is about 10%forandtransitions and it is about 15%forone.

Table 2.Vibrational energy levels Ev(in cm−1)for the CsHe A2Π1/2 and A2Π3/2 excited molecular states. The results are compared with theoretical values from Blank et al.[2]and Enomoto et al.[38]

Fig. 2. Transition dipole moments and as a function of the internuclear distance R.
Table 3.CsHe equilibrium distances Re(in)and potential well depths De(in cm−1)compared with other published works.
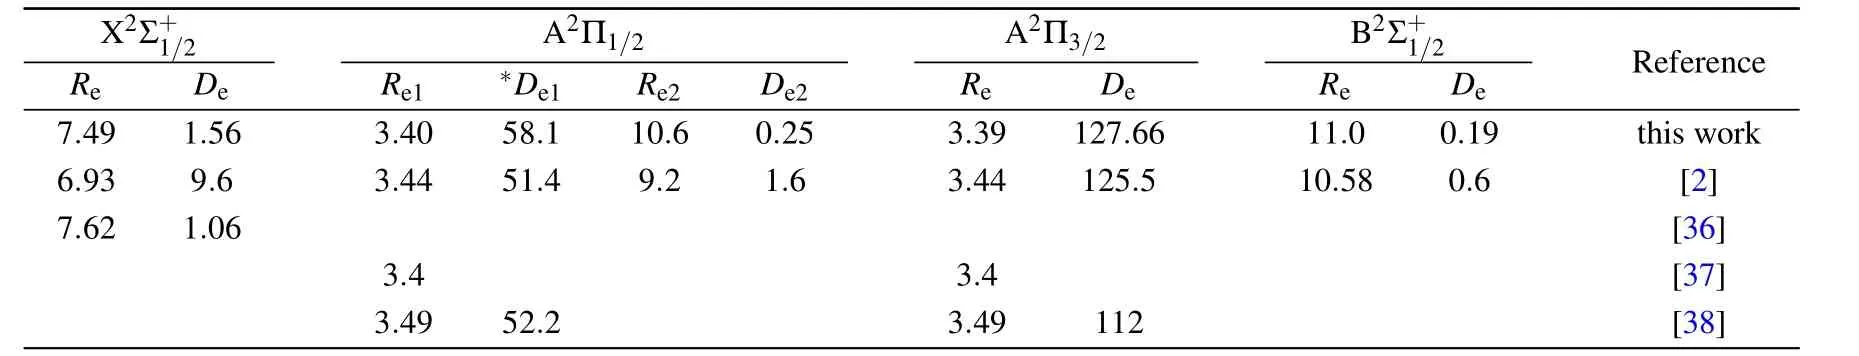
Table 3.CsHe equilibrium distances Re(in)and potential well depths De(in cm−1)compared with other published works.
*The well depth is determined from the bottom of the barrier.
Re X 2 Σ+1/2 D e Re1 ∗DeA 1 2Π 1/2 Re2 De2 Re A 2Π3/2 D e Re B2 Σ+1/2 De Reference 7.49 1.56 3.40 58.1 10.6 0.25 3.39 127.66 11.0 0.19 this work 6.93 9.6 3.44 51.4 9.2 1.6 3.44 125.5 10.58 0.6 [2]7.62 1.06 [36]3.4 3.4 [37]3.49 52.2 3.49 112 [38]
4.Results and discussion
The potential-energy curves and transition dipole moments correctly built in the previous section can be utilized in the computation of the absorption and emission profiles.One has to primarily point out some important details.
4.1.Calculation details
The normalized wave functions appearing in Eqs.(1),(3),(5),and(6)are obtained by solving numerically the radial wave Eq.(4)with the Numerov algorithm,[40]and the matrix elements are computed using the Simpson rule with equally spaced intervals ∆R=0.01a0.
For a given temperature T,the profiles of the broadened lines at the far wings depend closely on the maximum value of the chosen rotational quantum number Jmax.Calculations show that as Jmaxincreases,the intensity and the shape of the profile increase and become practically steady.The maximum rotational numbers Jmax=250 and Jmax=25 are enough in the calculations of the reduced absorption and emission coefficients for the free–free and free–bound transitions,respectively.In addition,one can remark that for a specific value of the rotational number J,the intensity of the profile increases when J increases and reaches its maximum for J=50,then decreases gradually for J varying from J=50 to J=250.We note that the shape of the profile does not substantially change when J varies.We use a frequency step size ∆ν=10 cm−1for different temperatures,and all the bound and quasibound levels are included in these calculations.In particular,the Gauss–Laguerre quadrature[41]with 100 weighted points has been used to compute the free–free integral appearing in Eqs.(1)and(5).We have also adopted the mathematical transformation used in Ref.[27]to avoid the numerical problem arising from the divergence of the matrix elements shown in the previous equations.
4.2.Classical satellite positions
At this stage,one may predict the possible existence of satellites in the far wings by adopting the classical point of view based on potential-difference curves. Indeed,satellites might appear where the curves of the potential differences between the ground and excited states exhibit extrema.Accordingly,we display in Fig.3 the energy differences,converted into wavelengths,as a function of the internuclear distance R for vertical transitions between,andThis shows clearly the presence of an eventual satellite in the blue wing of the D2line due to thetransitions. Quantitatively,a satellite should arise near the wavelength λ825 nm from the potential variations in the short-range region close to R ∼7.5a0in Fig.3.

Fig.3.Wavelengths,converted from the potential differences,for the CsHe quasi-molecular as a function of the distance R.
4.3.Absorption profiles
Generally,the photoabsorption profiles around the cesium D1or D2resonance lines are determined in the far wings by transitions from the ground to the excited CsHe molecular states,taking into account that the ground and excited molecular states are either repulsive or shallow.We may therefore consider just the transitions of the type free–free or free–bound.
More precisely,for the D1resonance line broadened around the wavelengthnm,the CsHe reduced absorption coefficients in the far wings are only arising from.The X1/2electronic state is dominantly repulsive,and the A1/2state is slightly bound;the photoabsorption profiles are therefore resulting from thefree–free and free–bound transitions.For the case of D2line,since the B1/2state is mainly repulsive and the A3/2state is less deep,the shapes in the far wings around the wavelengthnm are resulting from the contributions of theandfree–free and thefree–bound transitions.
We may mention that in both cases,and for all considered temperatures,the calculations show that the CsHe absorption spectra of the broadened D1and D2lines are largely dominated by the free–free transitions.
Nevertheless,the partial reduced absorption coefficients of the broadened D1line,in the range 800–1000 nm of the wavelength are presented in Fig.4(a)for temperatures T=323 K,448 K,500 K,1000 K,2000 K,and 3000 K.It is easy to see that when we survey the graph,the profile falls quickly in the blue wing and the branches are so close together that they almost overlap,and do not depend on the temperature.In the red wing,the branches have undulated descents which disappear at low temperature,and they increase in magnitude as the temperature increases. They can be the results of the existence of the bound and,mainly,quasi-bound levels of the molecular A1/2state.[28]
We have illustrated in Fig.4(b),at the same temperatures,the shape of the partial reduced absorption coefficients of the broadened D2line.The calculations show that the blue and red wings must result from theandfree–free transitions,respectively.We are able to follow the graph from the center of the line to the wings,and we have found that the intensity of the profiles increases as the temperature increases. In particular,the spectra exhibit a satellite around the wavelength 825 nm in the blue wing for all temperatures and present undulations in the red wing.These rapid quantum oscillations are specifically due to the transitions from the potential repulsive region of X1/2state to the attractive A3/2state.

Fig.4. Theoretical reduced photoabsorption coefficients αr of the broadened cesium D1 and D2 lines in panels(a)and(b),respectively,at different temperatures.
The total absorption profile of the quasi-molecular CsHe is the sum of the partial contributions of the broadened D1and D2lines,which can be seen in Fig.5.We notice that the total absorption spectra increase as the temperature increases and the satellite whose intensity grows with temperature begins its appearance from T=323 K.Regardless of the temperature,the position of satellite does not change,which shows that the temperature has no influence on the satellite position.

Fig.5. Theoretical reduced photoabsorption coefficients at different temperatures.
We have at our disposal some results of previous works,as a theoretical study related to calculations of photoabsorption spectra,using a semi-classical method by Allard et al.[1]This study was carried out by Allard and his coworkers in the framework of the unified theory based on the potentials and dipole moments of the CsHe system calculated by Pascale.[42]They theoretically found at the temperature of 1000 K,with the low perturber density of about 1020cm−3,a blue-wing satellite close to the wavelength 420 cm−1corresponding to 820 nm.On the other hand,Gilbert and Ch’en[43]observed experimentally a satellite in the blue wing of the CsHe profiles located around 387±9 cm−1which corresponds to 755±18 nm.In addition,we have presented in Figs.6(a)and 6(b)the curves of D1and D2profiles at temperature T=3000 K plotted with those obtained by Allard et al.[1]

Fig.6.Comparison of our computed T=3000 K photoabsorption profiles around the cesium D1 and D2 lines,presented in panels(a)and(b),respectively,with those obtained within the unified theory of Allard et al.[1]
Moreover,Hager and his collaborator[5]have experimentally observed a satellite near the wavelength position 827 nm for Cs collisions with He at a high pressure of 2280 torr in the temperature range of 323–448 K.Figures 7(a)and 7(b)show our quantal results of D1and D2profiles at T=323 K and T=448 K with the experimental data points measured,in the interval of temperature T=323–448 K,by Hager et al.[5]We can easily notice that these spectra have the same general shape and present,especially,satellite peaks in the same wings around close positions.
All these results confirm that our calculated photoabsorption spectra are in good agreement with experimental measurements and theoretical calculations,and illustrate in particular the sensitivity of the pressure broadening calculations to the quality of potentials and the accuracy transition dipole moments we have used.

Fig.7.Comparison of our computed photoabsorption profiles around the cesium D1 and D2 lines,presented in panels(a)and(b),respectively,at T=323 K and T=448 K,with those measured by Hager et al.[5]
4.4.Emission profiles
The full quantum-theoretical photoemission profiles for both broadened D1and D2resonance lines are displayed in the wavelength interval from 800 nm to 1000 nm,at temperatures T=323 K,448 K,500 K,1000 K,2000 K,and 3000 K.As a matter of first importance,one needs to underline as with the CsHe absorption profile calculations that only the free–free transitions contribute to building the D1and D2emission spectra.In particular,the shapes of the emission profiles of the broadened D1line in the blue and red wings are constructed by A1/2→X1/2free–free transitions for all temperatures.As shown in Fig.8(a),the red wing structures show undulations that virtually disappear at low temperatures,whereas in the blue wings the profiles fall quickly and become insignificant.
For the broadened D2resonance line,the computations state that the A3/2→X1/2free–free transitions are clearly dominant in the red side,while the A3/2→X1/2and B1/2→X1/2free–free transitions are significantly dominant in the blue side.Figure 8(b)displays the occurrence of satellites in the blue far wings close to the wavelength 825 nm.In addition,in the red wings,there is a shoulder whose intensity and shape vary with temperature and its position moves away from the line as the temperature increases.One may notice that the satellite positions in both emission and absorption spectra are the same.If we add up the two contributions due to the D1and D2lines,we obtain the total profile of the emission spectrum as shown in Fig.9.

Fig.8. Reduced photoemission coefficients kr of theoretical reduced photoemission coefficients of the broadened rubidium D1 and D2 lines presented in panels(a)and(b),respectively,at different temperatures.

Fig.9.Total reduced emission coefficients presented at temperatures ranging between 323 K and 3000 K.
Very recently,Blank et al.[2]have used the classical quasistatic approximation,based on the B1/2−X1/2difference potential,to estimate the satellite peak position of broadened D2line.As a result,they calculated the blue shifted satellite around 810.9 nm. Following a procedure described in their paper,[2]Blank and his co-workers could predict the CsHe experimental value.They foresee the value 825 nm for the CsHe experimental satellite peak.
To our knowledge,the only available experimental data of the CsHe emission profile is the normalized infinitetemperature emission spectra for 1019cm−1perturber density measured by Hedges et al.[8]To successfully reproduce the experimental spectrum at the infinite temperature(T →∞),we have estimated that the temperature of 3000 K is sufficient to be used in our calculations because the theoretically profile of the spectrum as well as its intensity does not change practically beyond this value.Finally,figures 10(a)and 10(b)show our theoretically emission profiles of D1and D2lines at 3000 K together with the experimental profiles of the same lines at infinite temperature T,respectively.It is easy to see that there is almost no difference between the D1and D2line profiles,likewise,the peaks of the two satellites in the blue wing of D2line are at the same locations.This shows a good agreement.

Fig.10.Comparison of our computed T=3000 K photoemission profiles around the cesium D1 and D2 lines,presented in panels(a)and(b),respectively,with those measured at the infinite temperature by Hedges et al.[8]
5.Conclusion
In this work, we have performed full quantummechanical calculations related to the CsHe absorption and emission profiles in the wavelength range of 800–1000 nm,at temperatures going from 323 K to 3000 K.For this purpose,we have computed accurate potential energy curves of groundand excited,andstates and the corresponding transition dipole moments using high-level ab initio calculations SA-CASSCF,MRCI,and SO coupling with the Davidson and the BSSE corrections.A blue satellites around 825 nm are found in the spectra of both absorption and emission which arise from the free–freetransitions.A good agreement is found with previous theoretical and experimental results.
Acknowledgments
This work was granted access to the HPC resources of the FLMSN,“Fédération Lyonnaise de Modélisation et Sciences Numériques”,partner of EQUIPEX EQUIP@MESO,and to the“Centre de calcul CC-IN2P3”at Villeurbanne,France.

- Chinese Physics B的其它文章
- Compact finite difference schemes for the backward fractional Feynman–Kac equation with fractional substantial derivative*
- Exact solutions of a(2+1)-dimensional extended shallow water wave equation∗
- Lump-type solutions of a generalized Kadomtsev–Petviashvili equation in(3+1)-dimensions∗
- Time evolution of angular momentum coherent state derived by virtue of entangled state representation and a new binomial theorem∗
- Boundary states for entanglement robustness under dephasing and bit flip channels*
- Manipulating transition of a two-component Bose–Einstein condensate with a weak δ-shaped laser∗