
Construction of an Hα diagnostic system and its application to determine neutral hydrogen densities on the Keda Torus eXperiment∗
2019-11-06 00:44JunfengZhu朱军锋TaoLan兰涛GeZhuang庄革TijianDeng邓体建JieWu吴捷HangqiXu许航齐ChenChen陈晨SenZhang张森JiarenWu邬佳仁YimingZu祖一鸣HongLi李弘JinlinXie谢锦林AhdiLiu刘阿娣ZixiLiu刘子奚ZhengweiWu吴征威HaiWang汪海XiaohuiWen温晓辉HaiyangZhou周海洋ChijinX
Chinese Physics B 2019年10期
关键词:陈晨
Junfeng Zhu(朱军锋), Tao Lan(兰涛),†, Ge Zhuang(庄革), Tijian Deng(邓体建), Jie Wu(吴捷),Hangqi Xu(许航齐), Chen Chen(陈晨), Sen Zhang(张森),Jiaren Wu(邬佳仁), Yiming Zu(祖一鸣),Hong Li(李弘), Jinlin Xie(谢锦林), Ahdi Liu(刘阿娣), Zixi Liu(刘子奚), Zhengwei Wu(吴征威),Hai Wang(汪海), Xiaohui Wen(温晓辉), Haiyang Zhou(周海洋),Chijin Xiao(肖持进),2, Weixing Ding(丁卫星), and Wandong Liu(刘万东)
1KTX Laboratory and Department of Engineering and Applied Physics,University of Science and Technology of China,Hefei 230026,China
2Plasma Physics Laboratory,University of Saskatchewan,Saskatoon,SK S7N 5E2,Canada
Keywords:Hα diagnostic,neutral density,Keda Torus eXperiment(KTX)device
1.Introduction
The Hαdiagnostic is one of the most fundamental diagnostic systems on magnetically confined plasmas;many plasma properties can be obtained by analyzing the spatial and temporal distributions of the Hαemission.Its intensity can reflects the electron density,electron temperature,plasma confinement condition,recycling processes in the plasma,etc.[1,2]In addition,the particle confinement time,neutral density,total hydrogen,and impurity radiation can be determined from the local emissivities and the electron temperature and density.[3,4]
Neutral particles,serving as the plasma fuel through ionization,are obviously very important for investigating recycling phenomena and particle balance in magnetically confined plasmas.For example,the neutral density is closely involved with the loss of fast ions by charge exchange,and it is necessary to control the neutral density to prevent the loss of fast ions.[5,6]In magnetic confinement devices,the Monte–Carlo method is often used to determine the neutral density with the Hαemission data.[3,7]
On the Keda Torus eXperiment(KTX),a new built reversed field pinch(RFP)device,the recyling and the wall condition require the fundamental Hαdiagnostic for the inductive backing,pulse discharge cleaning,and glow discharge cleanning in the conditioning phase.Currently,the KTX has attained a maximum plasma current of 205 kA and a maximum discharge time of 21 ms,and it has achieved typical reversed field pinch(RFP)discharges lasting 2 ms in RFP state.Presently,there are a few foundational diagnostic systems operating on the KTX[8–10]and the Hαdiagnostic is one of the most fundamental diagnostics on KTX.
An Hαdiagnostic system has been designed and implemented successfully to obtain the plasma confinement condition and determine the neutral density on KTX.Lenses are widely used in the design of the Hαdiagnostic system.However,to obtain better spatial resolution,the lenses have been replaced with an aperture slit in the KTX Hαdiagnostic system.A flexural interference filter is designed to avoid excessive angle of incidence and so that the detector can receive Hαlight for each channel.Generally,Hαdiagnostic systems in current low-β fusion devices have a maximum frequency response of a few tens of kHz.However,the magneto-hydrodynamics(MHD)activities have a higher frequency range in RFP plasmas.And the Hαdiagnostic is designed to have a bandwidth up to 300 kHz for high frequency fluctuation measurement on the KTX.In RFP configuration,the vacuum vessel wall is very close to plasma,thus it is necessary to consider the proportion of the reflection in the Hαsignals.In Section 2 of this paper,we describe the setup and laboratory tests of the KTX Hαdiagnostic system.In addition,the proportion of the reflection and some experimental data are analyzed and discussed for the KTX plasmas.The method used to calculate the neutral hydrogen density is described in Section 3.Section 4 provides a summary of the paper.
2.Experimental setup and laboratory tests
2.1.Experimental setup of the Hα diagnostic system
The KTX is a new RFP device with a major radius of R=1.4 m and a minor radius of a=0.4 m.[9,11–13]The materials of the first wall and limiter are stainless steel and molybdenum,respectively.The height of the poloidal and toroidal molybdenum limiters is 2 cm.The Hαdiagnostic is the most basic and important of all diagnostics operating on the KTX at present.
Figure 1 shows the schematic of the Hαdetector,which is cylindrical in shape with 45 mm diameter and 300 mm long.As shown,it consists of an aperture slit,protective glass,interference filter,photodiode array,and a preamplifier,all surrounded by black aluminum foil.Light from the plasma first passes through an aperture slit(0.5 mm×10 mm)and a protective glass.A 1.5 mm thick protective glass is placed behind the aperture slit and plays an important role in stopping both plasma sputtering and strong electromagnetic radiation such as x-rays.Thus the signal quality will improve significantly because the photodiode and preamplifier inside the diagnostic system will not be affected by the strong electromagnetic radiation.And the glass of 1.5 mm thick has the light refracted but it does not affect the adjacent channels.After passing through the narrow bandpass interference filter,the light shines onto the photodiode array,and the weak photocurrent signal is amplified by the preamplifier.
When the incident angle increases from vertical incidence,the wavelengths transmitted through the filter will shift toward shorter wavelengths and can be described by the equation[14],where θ is the angle of incidence,λ0is the unshifted wavelength at vertical incidence,and neffis the effective index of refraction,which is relative with filter,spectral feature,and polarization. For the KTX Hαdiagnostic,the maximum incident angle reaches about 37◦(see Fig.1),which makes Hαlight cannot pass through the filter used on the KTX with a center wavelength of 658 nm and a bandwidth of 20 nm. Therefore the actual design of the flexural interference filter is shown in Fig.1 and it has a 30◦bend,which ensures the angle of incidence,θ,is less than 15◦for each channel.According to the formula above,a 15◦angle of incident will give about 1%change in wavelength,which is nearly 7 nm for the Hαline. On account of the bandwidth of 20 nm for the filter,thus the detector can receive Hαlight for each channel.The AXUV20ELG photodiode array from IRD is chose as the Hαlight detector,because it has nearly 100%internal quantum efficiency(QE),includes a sensitive area of 3 mm2per element,has a rise time of 200 ns,and has a minimum shunt resistance of 100 MΩ at 25◦C. This 20-element photodiode array also retains a stable response after exposure to high energy radiation with the responsivity of about 0.35 A/W at 656.3 nm.To avoid the impact of the crosstalk between adjacent photodiode elements,only all the even number elements in the array are selected to detect the ten-channel Hαsignals.The preamplifier has a frequency bandwidth of 500 kHz with a high current-to-voltage conversion factor of 106V/A,and it is connected with a data acquisition card.

Fig.1.Schematic of the Hα detector:1.light from the plasma;2.aperture slit;3.protective glass;4.interference filter;5.photodiode array;6.preamplifier;7.black aluminum foil.

Fig.2.A poloidal cross section of the KTX,showing the experimental layout of the Hα detector.
The entire diagnostic system is installed in a 2 mm thick cylindrical aluminum cylinder to reduce the influence of electromagnetic interference.Black aluminum foil,BKF12 from Thorlabs,[15]with a reflectance of only 5%in the visible and near-infrared(VIS NIR)waveband,is attached to the interior surface of the aluminum shielding cylinder and effectively eliminates the reflected light inside the device.The Hαdetector is placed on port GU of the KTX,which is a vertical top port with an inside diameter of 47 mm.An aperture slit has been employed instead of an optical lens to increase the spatial resolution because of the limited port size.Figure 2 shows the experimental layout of the Hαdiagnostic system on a round poloidal cross section of the KTX.As shown,the 10 chords cover almost the entire poloidal cross section.
2.2.Laboratory tests of the Hα diagnostic system
The frequency bandwidth of the diagnostic system is 300 kHz,as obtained by laboratory tests. We use a highfrequency(100 MHz)wide spectrum light emitting diode(LED)as the visible light source and it is biased with a DC voltage to ensure that it is operated in the linear I–V range.The oscillations added onto the DC bias voltage vary from 1 kHz to 1 MHz. Figure 3 shows the output amplitude and phase shift of the system.As shown,the amplitude of the output signal remains roughly constant with increasing frequency up to about 50 kHz,and it decreases to half the value at 50 kHz at a frequency of 400 kHz.The phase shift increases to 180◦when the frequency is 300 kHz.Thus,the Hαdiagnostic system has a frequency bandwidth of 300 kHz.

Fig.3.Calibration of the amplitude and phase shift frequency response of the Hα diagnostic system.
The geometrical parameters of the diagnostic system were also tested,including the chord positions and the overlap between two neighboring channels. Figure 4 shows a schematic illustration of the spatial geometry used for the calibration.The dashed circle represents the poloidal cross section of the KTX vacuum vessel.The geometric position of the Hαdiagnostic system in the laboratory test setup is the same as that in the experimental device.The 420 mm distance shown in the schematic is the actual distance from the aperture slit to the center of the KTX vacuum vessel.As shown,the linear actuator based on the stepping motor technique is placed crossing the center of the poloidal cross section for the laboratory test. A cold cathode fluorescent tube(CCFT)is used as an isotropic light source having a slender shape,and it is mounted vertically on the linear actuator.During the test,the CCFT moves along the linear actuator over a total distance of 800 mm,which equals the diameter of the poloidal cross section of the KTX.The test results are shown in Fig.5 and these data in Table 1 are obtained from the results.Table shows a list of the full width at half maximum(FWHM)of the channels,and the maximum FWHM is about 40 mm. The degrees of overlap between the channels listed in Table 2 are each about 3%,based on these test data. For each column in Table 2,which shows HαAvs.HαB,overlap rate 1 refers to the former and overlap rate 2 to the latter.Here,the overlap between the 8th and the 9th channels is higher than others,which may be the crosstalk defect between these two elements of the photodiode array.

Fig.4.Schematic of the spatial geometry used for calibration.

Fig.5.Results of the laboratory tests.The r axis is the perpendicular distance from the center of the vacuum vessel to the chord.

Table 1.FWHM for each of the 10 channels.

Table 2.Overlap between adjacent channels.
2.3.The simulation analysis of the proportion of the reflection
Because of the smooth surfaces of the metals at the inner wall of the vacuum vessel on KTX,the effect of reflection on the Hαsignals has to be considered. To assess the proportion of the reflection,a two-dimensional model is constructed according to ray tracing equation dr/dt=∂ω/∂k,dk/dt=−∂ω/∂r,where r is the minor radius of the KTX.In the model,the geometric positions of every part,including the ports,slit,detector elements,and so on,are the same with the real experimental geometry.The number of rays from the plasma we used in the model is 4000.The ray direction vector is spherical and the number of rays in wave vector space is 150.The source power per unit thickness is from the emissivity profile.And some other main parameters we used are as follows:the refractive index of a vacuum,n=1;wavelength,656.3 nm;plasma minor radius,rp=0.36 m.In the model,when the rays from plasma strike the detector element,the detector element will record the power of the incident rays.On KTX,the material of the first wall is stainless steel,the reflection coefficient of which is from 0.55 to 0.65.According to the smoothness of the KTX first wall,we chose a reflection coefficient of 0.6 in the model.The transmitted ray power recorded by the detector elements was obtained with the reflection coefficients of 0.6 and 0,respectively.In this way,the proportion of reflection can be estimated in the signals.Firstly,we use the experimental data to obtain Hαemissivity profile by the Abel inversion without the reflection.Then the Hαemissivity profile is inputted into the numerical model and the proportion of the reflection can be roughly estimated in the signals.Afterwards,in the case of wall reflection,the results are used to calculate a new Hαemissivity profile and estimate a new proportion of the reflection.Finally,the optimal results can be converged by repeated iterations.
2.4.Experiments on KTX
The ultra-low q discharge[9]is the typical discharge on the KTX.For an ultra-low q discharge,figure 6 shows the waveforms of the plasma current Ip,loop voltage Vloop,and 10-channel Hαsignals.As shown by the locations of the different Hα-signal channels,the level of Hαemission is currently strong in the center of the KTX.Since Hαis the first spectral line of the Balmer series(with a wavelength of 656.3 nm),the intensity of the Hαemission is proportional to the neutral hydrogen density in the atomic energy level p=3.[16]Because the KTX plasma is currently in a low temperature state of about several tens eV,the neutral hydrogen cannot be ionized rapidly and the recombination of hydrogen ions occurs easily to form neutral atoms,so it maintains a high density in the p=3 excited state in the core plasma.The relative level of the Hαemission will be lower in the plasma center when the plasma is heated to a higher temperature,[16]e.g.,to 500 eV.

Fig.6. Waveforms for an ultra-low q discharge on KTX:(a)plasma current Ip;(b)loop voltage Vloop;(c)ten-channel Hα signals.

Fig.7.Waveforms for a tokamak discharge on KTX:(a)plasma current Ip;(b)two-channel Hα signals(Hα5 and Hα6);(c)cross-power spectrogram of Hα5 and Hα6;(d)two-channel differential poloidal magnetic field signals(Bθ1 and Bθ2);(e)cross-power spectrogram of Bθ1 and Bθ2.
To demonstrate the frequency response of the Hαdiagnostic system,the Hαsignals with obvious MHD activity are shown in Fig.7 in a tokamak discharge.[9]The MHD activity oscillates with a frequency of about 10 kHz,as observed in the cross-power spectrogram of Hα5and Hα6.Oscillations at about 10 kHz are confirmed by the cross-power spectrogram of Bθ1and Bθ2,which are differential poloidal in vessel magnetic field signals at the poloidal angles of θ=303◦and θ=348◦,respectively. Moreover,the 2nd and 3rd harmonic peaks of the MHD activity also can be seen clearly from the Hαcrosspower spectrogram in the high frequency region.Thus,with its high-frequency response and good spatial resolution,this diagnostic is capable of providing more detailed analysis of the physics of RFP plasmas.
3.Neutral density determination
3.1.Relationship between neutral density and Hα emission
The Hαemission originates from neutral hydrogen when an electron undergoes a transition from energy level p=3 to p=2.The main mechanism for the Hαemission is electron–neutral collisions.Hence,the neutral density has a direct relation to the intensity of the Hαemission. An approximate expression for the neutral hydrogen density is given by[16]

Here γαis the emissivity of Hα,Eα=3.03×10⁻¹⁹J is the energy of an Hαphoton,and A32is the Einstein spontaneous emission coefficient for Hα. The quantities r0(3)and r1(3)are numerical coefficients given in Ref.[17],which vary with the electron temperature and density,where 3 indicates the atomic energy level p=3. The quantities nE(1)and nE(3)are the Saha-equilibrium population densities in atomic energy levels 1 and 3,respectively;they are given by[17]nE(p)=n(H+)nep2(h2/2πmkBTe)3/2exp(Eip/kBTe),where Eipis the ionization energy for atomic energy level p,and n(H+)is assumed to be equal to the electron density. The expression given by Eq.(1)agrees closely with the ADAS simulation code,[18]although it becomes incorrect at low electron temperatures and densities.The comparisons between the neutral density calculated using a fixed emissivity of 0.1 MW/m3and the ADAS database are shown in Fig.8.

Fig.8.The comparisons between the computed results and the ADAS database.
In a plasma,the emissivity of Hαis a quantity that changes in both space and time. For each Hαchannel,the measured value of the local Hαemissivity is relative to the geometrical position of the aperture optics. And the radiation of the Hαline is assumed to be isotropic in the plasma.Therefore,the overall power of a photodiode viewing along the chord L(p,φ)is given by

where T1and T2are the transmissivity of the protective glass and the interference filter,respectively;Aapand Adetare the effective area of the aperture slit and the sensitive area per element for the photodiode;and cosθincand cosare the angle between the surface normal to the photodiode and the chord viewed and the angle between the surface normal to the aperture slit and the chord viewed,respectively. The d is the distance between the photodiode and the aperture slit.The output voltage from the preamplifier can then be written as Voutput=PαR(λ)RL,where R(λ)=0.35 A/W is the responsivity of the AXUV20ELG photodiode at 656.3 nm,and RL=106Ω is the transimpedance gain of the preamplifier.Thus,Pαcan be calculated from Voutputand the emissivity γα(r,θ)can be obtained by the Abel inversion of Eq.(2):[19,20]where f(p,φ)is the brightness of a chord in units of W/m2.Finally,the neutral density profile in the plasma can be calculated from Eq.(1)using the results for γα(r,θ).
3.2.Neutral densities on KTX
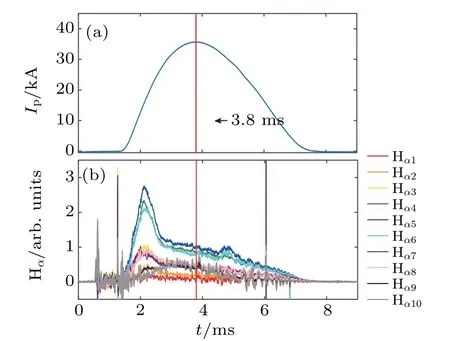
Fig.9.(a)Time evolution of the plasma current Ip and(b)the Hα signals for the ultra-low q discharge.
Figure 9 shows the time evolution of Ipand the Hαsignals for an ultra-low q discharge on KTX.We use the data for the Hαemission at 3.8 ms,when the plasma current reaches its peak value(see Fig.9).The proportion of the reflection is estimated by numerical simulation with the emissivity profile of Hα,and the results of multiple iterations are shown in Table 3.The considerable proportion of the reflection in the simulated results suggests that the effects caused by the reflection of the vacuum vessel should not be ignored.The profiles of electron density and temperature at 3.8 ms are shown in Fig.10 by the blue-dashed and red-dashed lines,respectively.The profiles of these plasma parameters are measured with a radially movable Langmuir probe at the mid-plane.The blue and red solid lines are fittings to the measured data.The quantities r0(3),r1(3),nE(1),and nE(3)in Eq.(1)can be obtained with the profiles of electron density and temperature. The brightness for 10-channel Hαsignals and the Hαemissivity profile at 3.8 ms are shown in Figs.11(a)and 11(b),respectively.The brightness is about 35 W/m2and the emissivity profile is not hollow at 3.8 ms.Figure 11(c)shows the profile of neutral density obtained from Eq.(1)using the data for the Hαemission and the fittings to the profiles of electron density and temperature at 3.8 ms. In this ultra-low q discharge,the neutral density in the core plasma is about 2.9×10¹⁶m−3,and at the edge it is about 4.5×10¹⁶m−3.Based on the ideal gaseity equation and the breakdown pressure P=6.0×10⁻³Pa,the background neutral density is about 1.5×10¹⁸m−3at normal temperature.The red dashed line at r=0.38 m in the figure indicates the position of the limiter on KTX.

Table 3.The proportion of the reflection in the Hα signals.
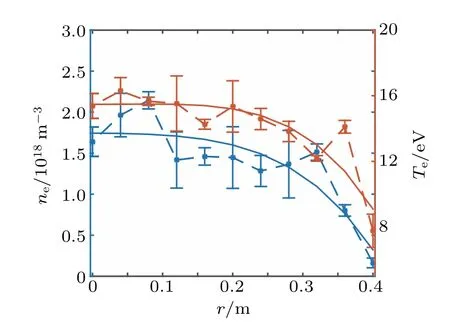
Fig.10.Profiles of the electron temperature Te(r)and electron density ne(r)at 3.8 ms,as obtained using the Langmuir probe.
Figure 12 shows the experimental data for Ipand the Hαsignals for a tokamak discharge on KTX.The plasma current reaches its peak value at 4.0 ms.Figure 13 shows the profiles of electron density and electron temperature at 4.0 ms as measured by the Langmuir probe.Figures 14(a)and 14(b)show the brightness for the 10-channel Hαsignals and the Hαemissivity profile,respectively.The brightness is about 40 W/m2and the emissivity profile has a peak value at the plasma center.With the low electron temperature in KTX,the Hαemission mainly comes from the center rather than the edge of the KTX,thus the plasma facing components do not contribute a major impact.As a result,the Hαradiation would be approximately symmetric on KTX.In the same manner as above,the profile of neutral hydrogen density is obtained at 4.0 ms(see Fig.14(c)).In the tokamak discharge,the neutral density in the core plasma is about 3.0×10¹⁶m−3,and at the edge it is about 1.0×10¹⁷m−3.The background neutral density is about 9.7×10¹⁷m−3with a breakdown pressure P=4.0×10⁻³Pa at normal temperature. The neutral hydrogen density in the tokamak discharge is currently higher than that in the ultra-low q discharge,because the KTX plasmas are in a lower temperature state in the tokamak discharge.Also,due to the lower plasma temperature,there is a higher bump at the edge of the poloidal cross section in the profile of neutral density in the tokamak discharge.
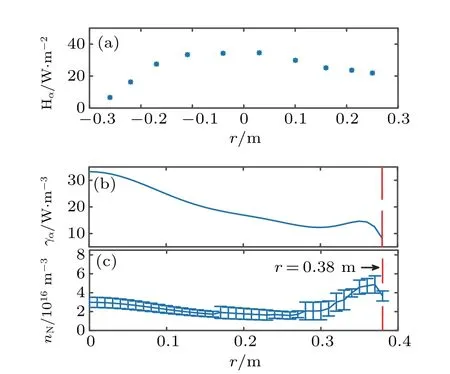
Fig.11.The ultra-low q discharge on KTX at 3.8 ms:(a)the brightness for 10-channel Hα signals;(b)profile of Hα emissivity γα(r);(c)profile of neutral density nN(r).

Fig.12. (a)Time evolution of the plasma current Ip and(b)the Hα signals for a tokamak discharge.

Fig.13. Profiles of electron temperature Te(r)and electron density ne(r)at 4.0 ms from the Langmuir probe.

Fig.14.The tokamak discharge on KTX at 4.0 ms:(a)the brightness for 10-channel Hα signals;(b)profile of Hα emissivity γα(r);(c)profile of neutral density nN(r).
4.Summary
An Hαdiagnostic system has been successfully implemented on the KTX and have shown that it is capable of analyzing the physical phenomena in RFP plasmas. Our 10-channel Hαdiagnostic system has a rapid response rate of 300 kHz,spatial resolution of about 40 mm,and overlap between adjacent channels of about 3%.With the design of an aperture slit replacing the optical lens,the Hαdiagnostic system has better spatial resolution and smaller overlap between adjacent channels. The design of a flexural interference filter keeps the light incidence angle within an allowable scope.And the use of black aluminum foil can also help to reduce the influence of stray light.Moreover,the accuracy of experimental results is improved by simulation analysis of the proportion.We used the data for the Hαemission,together with the electron density and temperature profiles to calculate the neutral density profiles on the KTX for cases in which the plasma current has reached its maximum value.The calculated neutral density is high for neutral hydrogen not being rapidly ionized and hydrogen ions can recombine fleetly with electrons in present low temperature plasma situations.In the future with the diagnostic upgrades of multi-chord interferometer for electron density and 2D double-foil soft x-ray for electron temperature,the time-varying profile of the neutral density will also be able to be obtained.
Acknowledgments
The authors are grateful for the support from the Madison Symmetric Torus(MST)team and the RFX team. The authors also thank Xiaoqing Zhang and Zhifeng Cheng(College of Electrical and Electronic Engineering,Huazhong University of Science and Technology)for the helpful discussions and suggestions.
猜你喜欢
天中学刊(2022年4期)2022-09-29
锦州医科大学报(2022年2期)2022-05-07
语数外学习·初中版(2021年4期)2021-11-30
电子乐园·中旬刊(2021年6期)2021-05-16
科学家(2021年24期)2021-04-25
动漫星空(兴趣百科)(2019年6期)2019-06-11
创新作文(1-2年级)(2018年5期)2018-11-16
动漫星空(兴趣百科)(2018年11期)2018-10-29
动漫星空(兴趣百科)(2018年5期)2018-10-26
动漫星空(兴趣百科)(2018年9期)2018-10-25

- Chinese Physics B的其它文章
- Compact finite difference schemes for the backward fractional Feynman–Kac equation with fractional substantial derivative*
- Exact solutions of a(2+1)-dimensional extended shallow water wave equation∗
- Lump-type solutions of a generalized Kadomtsev–Petviashvili equation in(3+1)-dimensions∗
- Time evolution of angular momentum coherent state derived by virtue of entangled state representation and a new binomial theorem∗
- Boundary states for entanglement robustness under dephasing and bit flip channels*
- Manipulating transition of a two-component Bose–Einstein condensate with a weak δ-shaped laser∗