
Underwater pulsed spark discharge influenced by the relative position between the top of a pin electrode and an insulating tube
2020-06-14 08:45XudongGAO高旭东JixuanWANG王继选YanfengGAO高艳丰HongyanYAN闫红艳KaiqiangXUE薛凯强XingnanDENG邓星男andXinYANG杨新
Plasma Science and Technology 2020年5期
Xudong GAO (高旭东),Jixuan WANG (王继选),Yanfeng GAO (高艳丰),Hongyan YAN(闫红艳),Kaiqiang XUE(薛凯强),Xingnan DENG(邓星男)and Xin YANG (杨新)
School of Water Conservancy and Hydroelectric power,Hebei University of Engineering,Handan 056038,People’s Republic of China
1 Author to whom any correspondence should be addressed.
Abstract
Keywords:discharge strength,development speed of discharge channel,plasma properties,randomicity of spark discharge,underwater pulsed spark discharge
1.Introduction
In recent years,underwater discharge has attracted much attention because of its ability to produce nanomaterials[1,2],producing reactive species [3],killing microorganisms[4–7],and generating shock waves[8–10].Different types of electrode and reactor geometry have been studied for underwater discharge,such as needle-to-plane [11–14],needle-toneedle [15,16],multiple needle-to-plane [17],wire-plane reactor [18],wire-cylinder reactor [19],and pinhole reactor[20];needle-to-plane geometry has been applied the most[21].However,it is very difficult to form plasma discharge by directly placing the needle-plate electrode into water,because the ions present in an aqueous solution will participate in conduction,especially for high-conductivity liquid.The field strength formed between the two electrodes will rapidly decrease due to the action of ion current.This problem can be effectively solved by using an ultrashort pulsed high-voltage power supply and insulating the needle electrode (except for the tip of the needle,which is one of the discharge poles).

Figure 1.Schematic diagram of the ultrashort pulsed power system.
An ultrashort pulsed power supply can instantaneously form a high-strength pulsed electric field between electrodes.This strong instantaneous pulsed electric field can only accelerate high-energy electrons without energy consumption due to accelerating ions.High-energy electrons collide with the surrounding molecules,ions,and atoms to generate plasma channels and form an underwater pulsed spark discharge.This process has both physical and chemical effects.Besides a strong electric field,the physical effects can also generate shock waves and light effects.The chemical effects can generate various active species.
The discharge current was found to be very sensitive to the relative position between the needle tip and insulating layer when droplet formation mechanisms were studied by electrostatic dispersion in a liquid–liquid system [22]and chemically active species were generated by electrical discharge in water[23].Locke et al[21]summarized that a small protrusion from the insulator surface led to better discharge in water compared to a large protrusion.These studies lay the foundation for further study of pulsed discharge in water.However,besides the needle tip protruding from the insulating layer,two other relative positions are available:the tip recessing in and flushing with the insulating layer.Few studies have been performed on how and to what extent the needle tip recessing in or flushing with the insulating layer affects the underwater discharge intensity.In addition,systematic studies on the effect of protrusion length on the underwater discharge intensity are still scarce,and this deserves further study.
This study aimed to evaluate the effect of the insulation structure of the electrode,specifically the relative position of the needle tip and insulating layer,on discharge strength and discharge energy efficiency.The aim of the study was to improve the discharge strength of ultrashort pulsed spark discharge in water by changing the position relationship between the needle electrode and insulating material to obtain brighter light effects,more efficient chemical species,and force effects from stronger shock waves.Pulsed spark discharge is used because it consumes less electrical energy relative to arc discharge.The study was based on the idea of consuming less electrical energy and using the force effects of shock waves to prevent wall fouling,while using light effects and chemical species to kill microorganisms in water.
Because of multiple factors affecting discharge and its possible randomness,based on many experiments,a statistical method was used to determine the probability distribution.
2.Experimental apparatus and methods
The electrical conductivity of the water solution used in the experiments was ~1076 μS cm-1obtained by adding NaCl to double-distilled water.The reason for using a prepared solution is that the number of experiments is relatively large,and it is necessary to ensure that the composition of the solution in each experiment is basically the same.The highconductivity configuration ensures that the conclusions of this study can be applied to urban tap water.The higher the conductivity,the less likely it is to achieve underwater pulsed spark discharge,while the conductivity of urban tap water is~125 μS cm-1to 1250 μS cm-1.The temperature and conductivity of the water solution were monitored using a conductivity meter (DDBJ-350).
The underwater ultrashort pulsed discharge system consists of an ultrashort high-voltage pulsed power supply (rise time <40 ns,full width at half maximum (FWHM) <30 ns,DGM-45,Dalian Power Technology Co.,Ltd)and a point-toplane electrode system immersed in water.The ultrashort high-voltage pulsed power supply consists of a control board,a DC high-voltage power supply,a storage capacitor Cs,an isolation inductor,a pulse-forming capacitor Cf,and an electromagnet spark-gap switch.A schematic diagram of the pulsed power system is shown in figure 1.
The electromagnet spark-gap switch was used to generate ultrashort high-voltage pulses from the pulse-forming capacitor Cf.First,Cfwas charged through inductor L using a storage capacitor Csand DC high-voltage power supply,and then Cfwas discharged through the electromagnet spark-gap switch to the plasma reactor.The repetition rate in pulses per second (pps) of the spark-gap switch was constant,but it could be adjusted using the control board.The repetition rate was adjusted once per minute in the experiments.Pulseforming capacitor Cfwas isolated from storage capacitor Csand the DC high-voltage power supply using inductor L.During the ultrashort pulsed discharge,inductor L prevented continuous power drain on the supply,long pulse tails,and possible arc formation.The output voltage of the DC highvoltage power supply was adjusted to 25 kV,and the pulseforming capacitor Cfwas adjusted to 5 nF in the experiments.
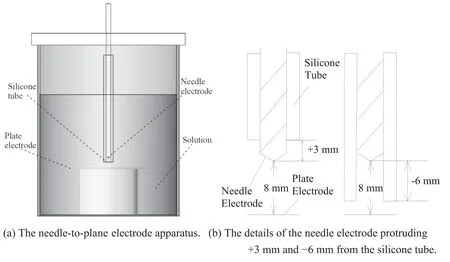
Figure 2.Schematic diagram of the electrode device.
A schematic diagram of the needle-to-plane electrode apparatus is shown in figure 2(a).A glass beaker was selected as the water container because it was transparent enough for observation.The glass beaker contained 1000 ml aqueous solution in the experiments.The high-voltage electrode was a rod electrode (anode) made of stainless steel 316 with a diameter of 4 mm.The tip of the anode electrode was rounded and sharpened to 0.3 mm diameter with a 120°cone angle.A stainless-steel-316 square plate with dimensions 65 mm ×65 mm × 0.8 mm acted as the grounded cathode,which was placed on an insulating trunk in a glass beaker.The distance between the anode electrode and stainless-steel square plate was 8 mm.The high-voltage needle anode (outer diameter 4 mm)was covered with a silicone tube(inner diameter 3 mm and outer diameter 8 mm)for an interference fit.The distance between the anode tip and silicone tube head face was adjustable.
The length of needle electrode protruding from the silicone tube could be adjusted from +3 mm to -8 mm by pushing the silicone tube head along the needle electrode axis,achieving three types of relative position between the tip and insulating tube:namely,the tip protruding from the insulating material,the tip flushing with the insulating material,and the tip recessing into the insulating material.Details of the needle electrode protruding +3 mm and -6 mm from the silicone tube are shown in figure 2(b).
To measure the current,a magnetic-core Pearson current probe was used (0.1 V/A ±1% sensitivity,5 ns usable rise time,and 120 MHz bandwidth).Voltage was measured using a wide bandwidth of 1:1000 voltage probe (P6015A,Tektronix Co.).Signals from the current and voltage probes were acquired and recorded using a digital phosphor oscilloscope(DPS) (1 GHz bandwidth,5 × 109Sa/s,AgilentDSOX4104A).
3.Voltage–current waveforms in the experiments and analysis
Twelve groups of experiments were conducted to evaluate the effect of the relative positions of the needle electrode and insulating tube on underwater pulsed discharge intensity.First,the tip of the needle electrode was protruded 3 mm from the silicone tube head face,and then the silicon tube was pushed 1 mm at a time along the needle electrode axis until,in the last group,the length of the tip of the needle electrode recessing into the silicone tube was 8 mm.
Experiments were carried out to determine the randomness of underwater pulsed discharge under the experimental conditions.The voltage and current waveforms exhibited significant differences,even with the same experimental conditions.Therefore,30 repeated experiments were conducted in each group to obtain reliable statistical results.
These waveforms could be roughly classified into four different types in the discharge experiments.All the types were found when the tip of the anode electrode was flushed with the silicone tube head face.The results are shown in figure 3.
Based on whether a conductive plasma channel was formed between the electrodes,the four types of waveform can be classified into two categories:namely,pulsed spark discharge and pulsed corona discharge.The significant differences between these two categories were observed in the voltage–current waveforms.In spark discharge,the voltage rapidly dropped to zero or a negative value;but in corona discharge,the voltage slowly dropped to zero.The reasons are as follows.Once the plasma channel forms an electrical connection,which takes place in spark discharge,the resistance between the positive electrode and negative electrode in a water solution will rapidly drop to zero.Subsequently,the energy stored in the capacitor is released instantaneously;therefore,the capacitor voltage steeply drops to zero or negative.In corona discharge,the electrical connection does not occur.A large resistance always exists between the positive electrode and negative electrode in a water solution,resulting in a slow process of energy release from the capacitor.Therefore,the capacitor voltage will slowly decrease to zero.

Figure 3.Four types of voltage and current waveforms in discharge experiments.
Figures 3(a)and(b)show the voltage–current waveforms of two types of pulsed spark discharge.
Figure 3(a) shows the voltage–current waves of typical pulsed spark discharge.The stage of t0–t1is a streamer inception and propagation phase [21,24,25].In this phase,the voltage slightly decreases with a low conduction current(leakage current <10 A).The average speed of propagation of the spark discharge channel can be calculated as follows:
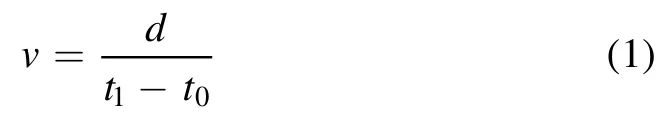
where ν is the average speed of propagation of the spark discharge channel,and d is the distance between electrodes.t0is the time when the high voltage was applied,and t1is the starting time of the spark.
By integrating the voltage and current,the dissipated energy in the solution during the streamer inception and propagation stage can be calculated as follows:
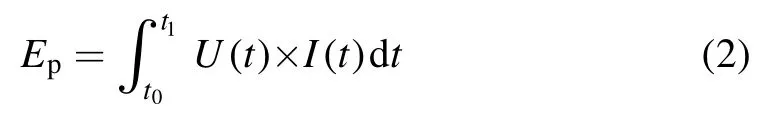
where Epis the energy dissipated in the streamer inception and propagation stages,and U(t) and I(t) are the voltage and current recorded using the oscilloscope,respectively.The meanings of t1and t0are the same as in equation (1).
The stage of t1–t2is a spark discharge phase.In this stage,the rapid rise in current (up to 270 A) and abrupt drop in voltage indicate that an electrical connection was formed between the electrodes.A large amount of plasma in the spark discharge channel decreased the resistance between the poles dramatically,from 2000 Ω to less than 1 Ω (the resistance is obtained by dividing voltage by current).
Similarly,by integrating the voltage and current,the energy deposited in the spark discharge stage can be calculated as follows:

where Esis the energy deposited in the spark discharge stage,and t2is the ending time of the spark.The meanings of t1,U(t),and I(t) are the same as above.
The pulsed energy Ebstored in pulse-forming capacitor Cfcan be calculated as follows:

where C is the capacitance of Cf,and Ubis the voltage peak of Cf.
The voltage waves and current waves of a pulsed spark with streamer discharge are shown in figure 3(b).The t3–t4stage is the inception phase of discharge channel propagation.In this phase,the voltage decreases slightly with a low conduction current.The current and voltage waveforms in the t3–t4time interval contain narrow peaks of current and voltage,corresponding to the appearance of a streamer.Then,the system relaxes,as reflected in the steady-state current (10 A)against the background of a slow voltage drop because the leakage current reduces the amount of electricity in the capacitor.The discharge current has a ‘bulge’ in the stage of t4–t5,but this phase still belongs to the corona discharge.This is because the resistance between electrodes is greater than 250 Ω,which does not comply with the characteristic of resistance which is close to 0 when an electrical connection is formed between the electrodes.The t5–t6stage is the spark discharge phase,because the resistance decreases to ~10 Ω.The resistance does not drop to zero because too much energy is consumed in the pre-breakdown stage t3–t5.As a result,the current could only reach 110 A (far less than the 270 A in typical spark discharge),even if the rest of the electrical energy is released instantaneously.Release of electrical energy with relatively lower intensity makes the number of conductive plasmas relatively less in the discharge channel,thus the resistance between electrodes is no less than 1 Ω.Similarly,the pre-breakdown or spark discharge energy of a pulsed spark with streamer discharge could be calculated by integrating the voltage and current in the t3–t5or t5–t6stage,respectively.
Two types of pulsed corona discharge waveforms are shown in figures 3(c) and (d).Figure 3(c) shows the voltage and current waveforms of typical pulsed corona discharge,which is an overdamped monotonic decay.At the beginning of discharge,the voltage increases rapidly from 0 kV to 25 kV in a very short time (<75 ns).At the same time,the current increases abruptly from 0 A to 15 A.In the following process,the voltage and current gradually decrease toward 0 synchronously.The high voltage leading to high current and low voltage leading to low current indicate that an abrupt decrease in electrical resistance does not occur in the entire discharge.The resistance between electrodes is always greater than 420 Ω,indicating that an electrical connection was never formed between the electrodes.
Figure 3(d) shows the voltage and current waveforms of pulsed corona discharge with a current bulge,which has a significant difference to pulsed spark discharge and typical pulsed corona discharge.The resistance is higher than 300 Ω during the entire discharge,indicating that an electrical connection does not form,i.e.,the corona discharge in nature.Previous studies [26]showed that the peak value of the current bulge is related to the conductivity of the solution;a higher conductivity of solution leads to a higher peak value of current bulge.The electrical energy is mainly released through the current bulge.
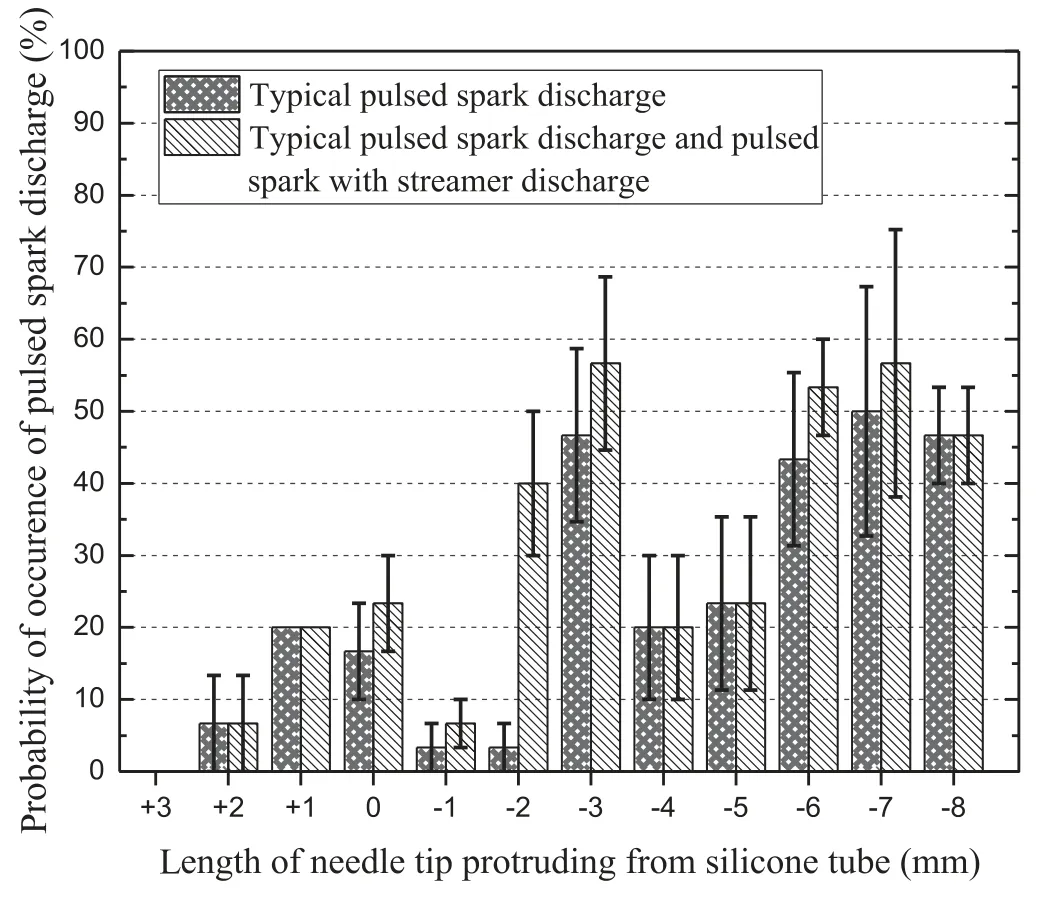
Figure 4.Probability of occurrence of pulsed spark discharge versus relative positions.
4.Results and discussion
4.1.Effect on probability of occurrence of pulsed spark discharge
The experiment was repeated 30 times in each group.The results show that the number of occurrences of spark discharges was quite different in each group.The probability of occurrence can be calculated using equation (5).
where P is the probability of occurrence of some type of discharge,n is the number of occurrences of some type of discharge in each group,and 30 is the total number of discharge times in each group.
The effect of relative positions of the sharp needle tip and insulating material on the probability of occurrence of pulsed spark discharge is shown in figure 4.
The experiments showed that when the tip of the needle electrode protruded by 3 mm from the silicone tube,all discharges showed the characteristics of typical corona discharge.This is because the anode electrode surface is significantly exposed to the conductive solution,and excessive energy loss occurs through electrolysis [27].
Within the range of the tip of the needle electrode protruding 2 mm from the silicone tube to recessing 2 mm into the silicone tube,both typical pulsed spark discharge and pulsed spark with streamer discharge occurred,as shown in figure 4.In particular,when the tip of the needle electrode protruded 0–1 mm from the silicone tube,the probability of occurrence of strong typical spark discharge was the largest,but only by ~20%.When the tip recesses 3 mm or more into the silicone tube,the probability of occurrence of typical pulsed spark discharge varies from 20% to 50%.

Figure 5.Electrostatic field comparison between the needle electrode recessing 6 mm in the silicone tube and protruding 1 mm from the silicone tube.
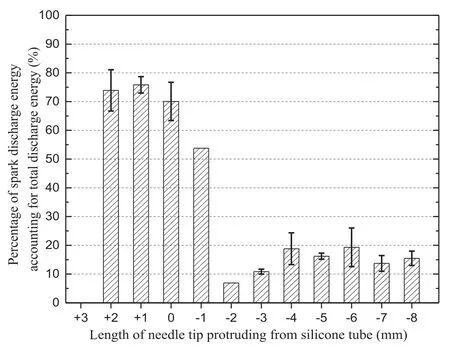
Figure 6.Ratio of the energy deposited in spark to the total discharge energy.
Figure 4 shows that the tip recessing in the insulating material is more likely to generate spark discharges than when it is protruding from the insulating material.To obtain a physical explanation of this experimental phenomenon,we carried out a comparative analysis of electrostatic fields.The comparison was carried out between the needle electrode recessing 6 mm into the silicone tube (representing the tip recessing in the insulating material) and protruding 1 mm from the silicone tube (representing the tip protruding from the insulating material).The analyses of electrostatic fields were carried out using Ansys Maxwell software.The comparison results are shown in figure 5.
It is generally believed that the order of magnitude of field strength should be greater than 106V m-1,which is beneficial for the emergence of a breakdown.Figure 5 shows a connected region of field strength greater than 1.4 × 10⁶V m-1in the cylindrical space between the needle electrode and plate electrode when the silicone tube protrudes from the needle electrode,and in particular the field strength of the space surrounded by the silicone tube is greater than 2 × 10⁶V m-1.The needle electrode protruding from the silicone tube formed a smaller space volume of field strength greater than 1.4 × 10⁶V m-1or 2 × 10⁶V m-1than when it was recessed into the silicone tube.The tip recessing in the insulating material is more likely to generate spark discharge than the tip protruding from the insulating material,probably because of the greater space volume which is beneficial for the emergence of a breakdown.
It is desirable that the tip recesses into the insulating material for the target to receive spark discharge as many times as possible.However,the spark discharge intensity is also an issue of concern besides the probability of occurrence.The spark discharge intensity can be represented by the spark discharge energy.
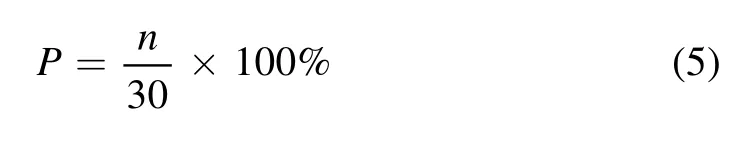
4.2.Effect on energy deposited in spark
The energy deposited into the spark discharge stage of typical pulsed spark discharges in each group can be calculated using equation (3).Figure 6 shows the ratio of energy deposited in spark to the total discharge energy.The percentage is calculated from Es/Eb.
Figure 6 shows that the discharge intensity in each group is quite different.Within the range of the tip of the needle electrode protruding 2 mm from the silicone tube to recessing 1 mm into the silicone tube,the discharge intensity is higher,and the spark discharge energy accounts for 54%–76%of the total discharge energy.When the tip of the needle electrode recesses 2 mm or more into the silicone tube,the discharge intensity is lower,and the percentage of spark discharge energy in the total discharge energy is less than 20%.
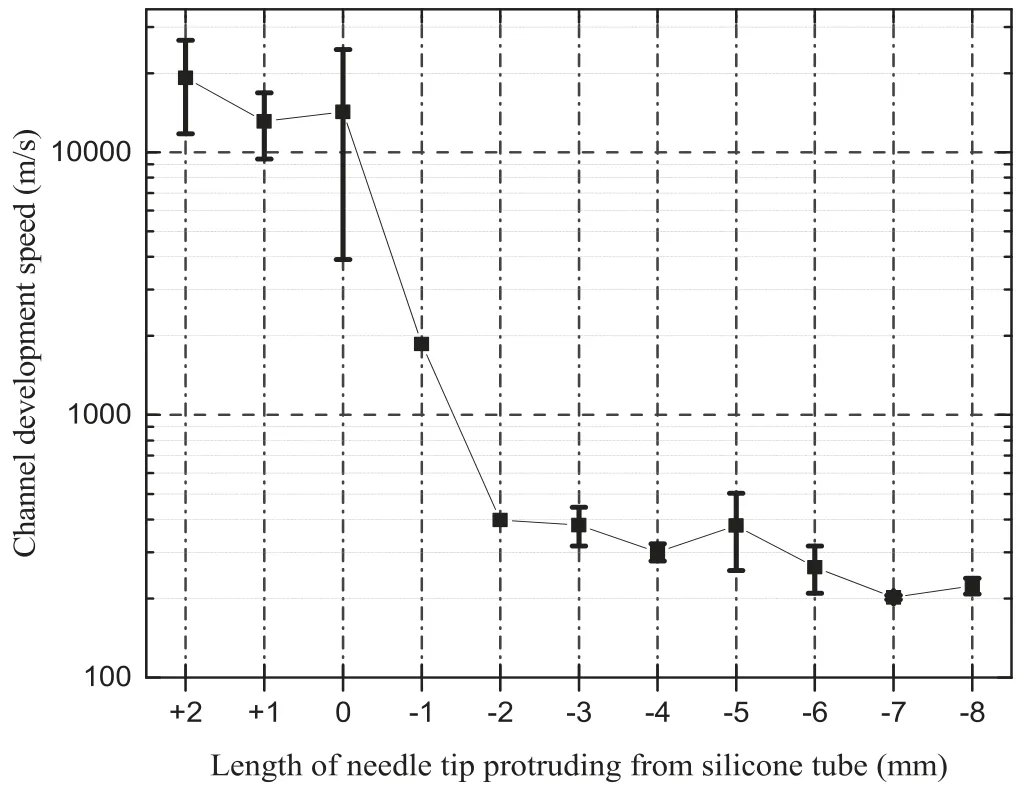
Figure 7.Development speed of a typical spark discharge channel in each group.
Thus,to achieve strong spark discharge,the tip should be within the range of recessing 1 mm into the silicone tube to protruding 2 mm from the silicone tube.Combined with the probability of occurrence of spark discharge shown in figure 4,the results indicate that it is a better choice for the needle tip to protrude from the silicone tube within the range of 0 mm to 1 mm,and as close as possible to 1 mm.In this case,the probability of occurrence of typical spark discharge is ~20%,and the effective energy utilization rate of spark discharge is ~76%.
When the tip recesses 3 mm or more into the silicone tube,a higher probability of occurrence of typical spark discharge could be obtained,but the spark discharge energy utilization rate is low (all are below 20%).To determine the reasons for the notable differences in the effective energy utilization rate of spark discharge between different groups,the effect of relative positions on the development speed of the spark discharge channel is analyzed in section 4.3.
4.3.Effect on channel development speed
The development speed of a typical spark discharge channel in each group can be calculated using equation(1);the results are shown in figure 7.
According to figure 7,the channel development speeds of typical spark discharges are significantly influenced by the relative positions of the needle tip and silicone tube.Within the range of the tip of needle electrode protruding 0–2 mm from the silicone tube,the speeds are higher,and all the speeds can reach more than 10 km s-1.The speed decreases rapidly after the tip recesses into the silicone tube.The speed decreases to 1.9 km s-1when the tip recesses 1 mm into the silicone tube.When the tip recesses 2 mm or more into the silicone tube,the development speed decreases to a few hundred meters per second.

Figure 8.Electric field strength distribution of the needle electrode recessing 5 mm into the silicone tube.
Because the development speed slows down,more energy is consumed in the pre-discharge process.By the time the discharge channel is established,too much energy stored in the capacitor has been dissipated.Therefore,the available energy efficiency of spark discharge clearly decreases from the tip of the needle electrode protruding from the silicone tube to recessing into the silicone tube.
The reason for the slowing down in spark discharge speed can be analyzed as follows.Because an ultrashort highvoltage pulsed power supply(rise time <40 ns)was used and the full width of an ultrashort pulse in the aqueous solution was less than a few microseconds in these experiments,an ultrashort pulsed high-strength electric field between electrodes could be established instantaneously in the aqueous solution.Because the voltage amplitude of an ultrashort pulse was reduced to half in a few microseconds,the ions cannot move and consume energy,while ultrasmall electrons can be accelerated by high-voltage pulses to be 3–20 eV high-energy electrons [25].Using the point-to-plane electrode system to produce a pulsed discharge in water,a high-intensity electric field of the order of 107–109V m-1is required to initiate discharges[28,29].The electric field is strongest near the tip of the needle because it is concentrated near the edge of the electrode.Figure 8 shows a cloud map of the electric field strength distribution of the needle electrode recessing 5 mm into the silicone tube using ANSYS Maxwell software under the experimental conditions.
Figure 8 shows that only a small area near the tip of the needle has an electric field strength greater than 107V m-1;therefore,the discharge process can only be started in this area.When a positive voltage is applied to the needle,the electrons presented in this small area are accelerated and move towards the tip of the needle to become high-energy electrons.While moving,the high-energy electrons collide with the surrounding molecules,ions,and atoms and ionize them to form electron avalanches (primary avalanche),while emitting photoelectrons.When the electrons in the avalanche head arrive at the needle electrode,the positive ions are accumulated to become positive ion space charges in front of the needle electrode because the positive ions cannot move.The positive ion space charges can generate an electric field strength with the plate electrode even greater than the applied field because of the large positive ion concentration[25].The two fields are superimposed to form a stronger electric field towards the plate electrode.
Figure 9.Development process of the discharge channel.
The photoelectrons from the primary electron avalanche also form electron avalanches(secondary electron avalanche)because of the stronger field towards the plate electrode.When the secondary avalanche electrons enter the primary electron avalanche ion space under the attraction of primary electron avalanche ions,the positive ions that do not move in the secondary electron avalanche are connected with the positive ion space charges of the primary electron avalanche,developing the discharge channel.
Positive space charges in the discharge channel reduce the applied field of discharge channel space,weakening the directional movement of electrons in the discharge channel.At the same time,the electrons presented in the channel are frequently recombined with the positive ions,and the electrons change from a free state to a bound state.The energy is released outward in the form of photons,generating new photoelectrons and new secondary electron avalanches.The development of the discharge channel is shown in figure 9.
Because photons radiate randomly in all directions andthe location where a photon generates a photoelectron israndom,the forming location of secondary electron avalanches is random,and the development of discharge channels is tortuous and forked.When the needle electrode is bound by the insulating tube,many photons that can generate photoelectrons radiate to the tube wall,thus failing to generate secondary electron avalanches and causing the discharge channel from the needle electrode not to be connected in time.As a result,the development speed of the discharge channel slows down.
5.Conclusions
This study systematically evaluated how and to what extent the relative positions of the needle tip and insulating layer affect underwater discharge.The main conclusions of this study are as follows:
(1) Underwater pulsed discharge has a strong randomness under the experimental conditions.Under the same conditions,the discharge could be a typical pulsed spark discharge,a pulsed spark with streamer discharge,a typical pulsed corona discharge,or a pulsed corona discharge with a current bulge.
(2) If the needle electrode changes from protruding from the insulation material to recessing into the insulation material,the probability of occurrence of ultrashort pulsed spark discharge increases,but the intensity of spark discharge decreases.
(3) Based on the experiments,the optimum choice is that the pin electrode protrudes from the insulating material within the range of 0–1 mm and as close to 1 mm as possible when the goal is to achieve violent spark discharge.In this condition,the probability of occurrence of typical pulsed spark discharge is ~20%,and the effective energy utilization rate is ~76%.
(4) The relative positions of the tip of the needle electrode and the insulating material significantly affect the average speed of propagation of typical pulsed spark discharge.The propagation speed can reach 1.9 × 10⁴m s-1when the tip protrudes 2 mm from the insulating layer,whereas the speed decreases to 1.9 × 10³m s-1when the tip recesses 1 mm into the insulating layer.Further,the speed decreases to just a few hundred meters per second when the tip recesses 2 mm or more into the insulating layer.
Acknowledgments
This work is supported by the Science and Technology Research Project of the Hebei Higher Education Institutions of China:No.ZD2014031.
猜你喜欢
红蜻蜓(2021年9期)2021-09-22
宝藏(2021年7期)2021-08-28
阅读(低年级)(2021年3期)2021-06-02
美与时代·城市版(2019年11期)2019-03-18
阅读(低年级)(2018年6期)2018-05-14
郭沫若学刊(2017年4期)2017-12-21
福建中学数学(2016年8期)2016-12-03
高中生学习·高二版(2016年9期)2016-05-14
意林·少年版(2014年5期)2014-05-09
中学英语园地·教学指导版(2008年3期)2008-07-15
 Plasma Science and Technology2020年5期
- Plasma Science and Technology的其它文章
- Investigation on the streamer propagation in atmospheric pressure helium plasma jet by the capacitive probe
- Numerical accuracy and convergence with EMC3-EIRENE
- Effects of trapped electrons on the ion temperature gradient mode in tokamak plasmas with hollow density profiles
- Contribution of joint experiments on small tokamaks in the framework of IAEA coordinated research projects to mainstream fusion research
- Investigation of the performance of CF3I/c-C4F8/N2 and CF3I/c-C4F8/CO2 gas mixtures from electron transport parameters
- Effects of the transverse electric field on nanosecond pulsed dielectric barrier discharge in atmospheric airflow