Wheat Lodging Ratio Detection Based on UAS Imagery Coupled with Different Machine Learning and Deep Learning Algorithms
2021-01-17 23:20PauloFLORES,ZHANGZhao
智慧农业(中英文) 2021年2期
Paulo FLORES, ZHANG Zhao


Abstract: Wheat lodging is a negative factor affecting yield production. Obtaining timely and accurate wheat lodging information is critical. Using unmanned aerial. systems (UASs) images for wheat lodging detection is a relatively new approach, in which researchers usually apply a manual. method for dataset generation consisting of plot images. Considering the manual. method being inefficient, inaccurate, and subjective, this study developed a new image processing-based approach for automatically generating individual. field plot datasets. Images from wheat field trials at three flight heights (15, 46, and 91m) were collected and analyzed using machine learning (support vector machine,random forest, and K nearest neighbors) and deep learning (ResNet101, GoogLeNet, and VGG16) algorithms to test their performances on detecting levels of wheat lodging percentages: non-(0%), light(<50%), and severe (>50%) lodging. The results indicated that the images collected at 91 m (2.5 cm/pixel) flight height could yield a similar, even slightly higher, detection accuracy over the images collected at 46 m (1.2 cm/pixel) and 15 m (0.4 cm/pixel) UAS mission heights. Comparison of random forest and ResNet101 model results showed that ResNet101 resulted in more satisfactory performance (75% accuracy) with higher accuracy over random forest (71% accuracy). Thus,ResNet101 is a suitable model for wheat lodging ratio detection. This study recommends that UASs images collected at the height of about 91 m (2.5 cm/pixel resolution) coupled with ResNet101 model is a useful and efficient approach for wheat lodging ratio detection.
Key words: wheat lodging ratio; machine learning; deep learning; mission height; UAS; ResNet101
CLC number: TP751; S512.1Documents code: AArticle ID: 202104-SA003
Citation: FLORES Paulo, ZHANG Zhao. Wheat lodging ratio detection based on UAS imagery coupled with different machine learning and deep learning algorithms[J]. Smart Agriculture, 2021, 3(2): 23-34. (in English with Chinese abstract)
FLORES Paulo,張昭.基于无人机图像以及不同机器学习和深度学习模型的小麦倒伏率检测[J].智慧农业(中英文),2021, 3(2): 23-34.
Biography: Paulo FLORES (1979—), male, assistant professor, research interests is remote sensing technologies in agriculture. E-mail: paulo.flores@ndsu.edu.
*Corresponding author: ZHANG Zhao(1985—), male, Ph.D., research assistant professor, research interests is sensing and automation in agriculture. Tel: +1-701-231-8403. E-mail:zhao.zhang.1@ndsu.edu.
1Introduction
In addition to being as a major source of protein and energy[1], wheat (Triticum aestivum L.) provides a number of essential. elements for human health, such as iron, vitamin B, and fiber[2]. The global. wheat production has been increasing gradually, following the footsteps of technology development, and in 2020 a new historical. record was established with the production of 7.7×10kg[3]. However, wheat production still faces a myriad of challenges threatening crop yield, such as rust and tan spot diseases[4], pests[5], drought stress[6], and crop lodging[7], among which the wheat lodging issue ranking the top[8].
Wheat lodging, the permanent displacement of plant stems from the original. and natural. upright position, can be caused by inclement weather conditions (e.g., rain and wind), over-density planting population, and over application of fertilizer[9]. Lodging can lead to yield losses of up to 60%—80%,due to lowered photosynthesis rate of the wheat plants[10]. The lodging can deteriorate grain quality (e. g., less protein) and worsen grain losses during harvest, because the combine harvester has difficulties to pull the lodged crops into the header[11,12]. Lodging has been a topic of interest for researchers, agronomists, farmers, and even crop insurance companies for decades. Wheat plant breeders are interested in lodging information for the purpose of selecting lines/cultivars that are more resistant to lodging; plant science researchers and agronomists collect lodging information so that they can identify its causes; farmers can use lodging rates to choose the better variety fitted to environmental. conditions;crop insurance companies would take advantage of the information to calculate the insurance coverage for farmers[7].
In recent years, there has been an increase inadoption on newer technologies in agriculture, especially on specialty[13-18] and row[4,19] crops. However, when it comes to wheat lodging detection and its associated metrics, the mostly used approach still fully relies on individual. walking the field in-person and visually assessing lodging conditions[7,20,21]. There are many disadvantages associated with this approach. First, it is infeasible for one to reach parts of a lodged wheat field under certain conditions, such as immediately after heavy rain, when one might have to wait for a few days before the fields are accessible. Second, the evaluation process is inefficient, as the evaluator has to move across the field, which can take time. Third, the results from different individuals may vary greatly, as each one might have different standards (subjectively). In addition, the results for the same person on the same plot/field of multiple evaluations may be different[22]. Hence, there is a need for the development of an efficient, objective, and low-cost approach for wheat lodging detection.
Researchers explored a number of approaches for wheat lodging detection, starting with taking advantage of satellite images[23-25]. Though the performance of satellite images on crop lodging has been validated[8,26], its wide adoption as a universal. approach is challenging due to its low spatial. (finest as tens of centimeters) and coarse temporal. (multiple days) resolution. Since the satellite images cannot meet the practical. application requirements, researchers started to explore other potential. technologies. Most recently, researchers started to explore the potential. of using unmanned aerial. system (UAS) images for crop lodging detection given the recent development on UASs, sensors, and associated software for data processing, coupled with new and effective machine learning (ML) and deep learning (DL) algorithms[27]. Compared to the satellite images, the UASs images have several. advantages. First, the resolution of the collected UAS aerial. images is much finer than those by satellite, with some of them reaching millimeter level. In addition, UASs allow for a shorter revisit time of the same area (temporal. resolution) compared to satellite, given weather conditions are suitable for flights, allowing even for more than one flight a day over the same area of interest. During the past few years, there has been a sharply increase on research exploring the use of UASs for crop lodging—though it is at a nascent stage, study results have demonstrated the potential. on different crops, such as sugar beet, canola, and wheat[28,29]. So far, a majority of the studies treat crop lodging as a binary issue—lodging or non-lodging. From a plant breeder perspective, though the lodging and non-lodging information is crucial, it would be more meaningful to know the lodging as a percentage of each experimental. unit (plot), which can be a key piece of information when making breeding decisions. However, few studies have been conducted for this specific purpose.
Plot lodging ratio detection starts with the dataset (individual. plot images) generation. Currently, the main approach for dataset generation is manual—researchers crop the plot images one by one[7,30]. Though the manual. approach has been widely used, it has a number of shortcomings, such as inefficiency and inaccuracy. Since there is no free automatic approach for plot dataset generation, researchers have no other choices but to take advantage of the manual. method to collect data. Considering that breeders usually have field trials with hundreds or even thousands of plots for field trials, there is a need for an automatic approach for the dataset generation to replace the manual. process.
After generating the proper dataset, the next step is to extract features from individual. image, and then feed them into a classifier (model). The proper selection of features to extract is a crucial. step—if selected features cannot represent the image characteristics satisfactorily, it would generate a low model accuracy; only when the selected features represent the image characteristics well, it would obtain a good model accuracy. The selection of features mainly relies on domain knowledge, and researchers usually take advantage of accumulated experience for feature selection. Mardanisamaniet al.[30] and Chauhan et al.[26] demonstrated that textural. and color features have performed well on crop lodging detection. With the advent of DL, researchers start to use the DL models to address the classification issues. Very recently, there has been reports of a number of DL models with satisfactory performance on solving agriculture-related issues[31]. However, only few studies have compared the wheat lodging detection accuracies between DL and ML.
UAS mission height is a crucial. factor for the quality of the collected images and the data collection time. Considering the same area of interest, UASs flights carried out at higher altitude (e.g., 90 m above ground level) would result in shorter flight time and imagery with lower resolution, compared to flights carried out at a lower altitude (e.g., 15m above ground level). Compared to the low resolution images, processing high resolution ones requires much more time and more hard drive space for storage. Though the mission height is crucial. for crop lodging monitoring, the current method for determining the mission height is mainly empirically based. Therefore, there is a need to explore the effects of different UAS flight heights on crop lodging detection accuracy and to determine proper height to collect images for such evaluations.
This study addressed the main issues associated with the predominant approach to determine theoccurrence of lodging in wheat research trials. The objectives of this study were to: (1) develop an automatic approach for wheat lodging plot dataset generation from UAS imagery; (2) explore the mission height effects on wheat lodging ratio detection accuracy, and (3) compare the performance of ML and DL on wheat lodging ratio detection.
2Materials and methods
The procedures used in this study, including developing and testing an automatic wheat plot dataset generation method, using and comparing DL and ML models for lodging ratio detection, and quantifying the height effects on wheat lodging detection accuracy, are schematically outlined on Fig. 1.
After lodging occurrence, researchers used a UAS to capture images from the research area at different heights. Following the flights, the lodging occurrence in each plot was visually graded into one of the three categories: non-(0% crop lodged), light (<50% crop lodged), and severe lodging (>50% crop lodged). For each flight height, images were first processed to obtain an orthomosaic map for the area of interest, which was then fed into the newly develop plot image dataset generation method fordataset generation. Then, different ML and DL models were tested, and their performance was compared. All the procedures used in this study are described in details in the subsequent sections.
2.1Experimental. field and data collection
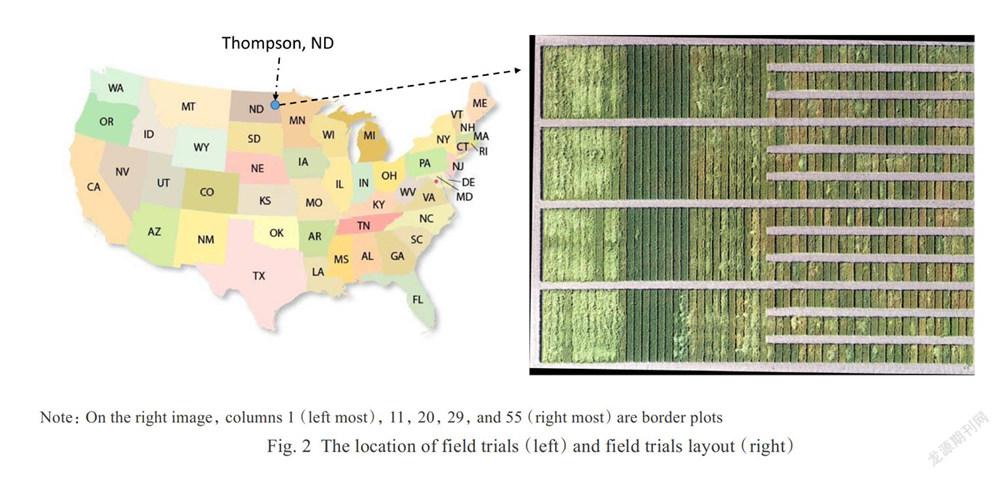
A field rented from a local. farmer near Thompson, ND, U.S. was used to plant the experimental. trials during the 2020 growing season (May-August, 2021). The location and experimental. fields are shown in Fig. 2. There are two size types with different sizes on this location: long plot with dimensions of 1.5m×14.6m (5 ft×48 ft) and short plot with dimensions of 1.5m×3.6m (5 ft×12 ft). A total. of 428 plots were planted with 116 long plots and 312 short plots, among which 28 plots were used as borders (columns 1, 11, 20, 29, and 55 in the right images of Fig. 2; columns 1 and 55 are the left- and right-most columns, respectively). While generating dataset consisting of individual. plot images, all these border plots need to be manually removed.
Approximately a week after the lodging occurred, UAS flights were conducted at three heights (15, 46, and 91 m) on July 23, 2020. The 91 m is the highest above ground level allowed for a UAV mission by the U. S. Department of Transportation;the 15 m is the empirically determined lowest above ground level for a UAV mission based on our multiple year experience; and the 46 m is roughly half height of the highest above ground level. An off-the-shelf DJI Phantom 4D RTK UAS (DJI-Innovations, Inc., Shenzhen, China) was used for data collection. The UAS is outfitted with a 20 megapixel (5472×3648 pixel) color (RGB) camera. The mission speed was set to 2.5m/s, and since the weather was sunny during the entire data collection time window, the balance mode was set as sunny.Additionally, both side and forward overlaps for image capture were set as 80%.
Immediately after all the three flights, two evaluators (trained by an experienced plant scientist) visited the field for visual. grading of the lodging conditions. For each plot, the evaluators graded the lodging level in one of the following three categories: non-lodging (lodging event does not occur), light lodging (<50% of the plot area lodged), and severe lodging (>50% of the plot area lodged). This study applied the value of 50% as the threshold to distinguish light and severe lodging, and different breeders may use other threshold values (e. g., 40%). Thus the performance of models on other threshold values may need further test. To avoid influence by each other, the two individuals worked independently. After collecting the ground truth data, the two evaluators and the person who trained them compared the individual. grades for each plot. If the two grades were the same, it remained as it was; if the two grades were different, the three individuals would vote using the orthomosaic imagery (refer to below section) and decided the final. grade for the plot. At the end of the process, there was only one grade for each plot.
2.2Data pre-processing and dataset generation
After each mission (three in total), all the collected images were processed with Pixel4D mapper by Pix4D (Pix4D V4.3.33, S. A., Prilly, Switzerland) to generate an orthomosaic of the area (Fig. 2 right image). To assure alignment of the orthomosaics across all three flights, eight ground control points (installed soon after the experiment was planted) were used during the image stitching process in Pix4Dmapper. Ground control points were surveyed with a Trimble Geo7X GPS unit, which was connected to a virtual. base network (VBN), providing a 2 cm level accuracy.
Fig. 3 shows the automatic dataset generation process. After the orthomosaics were created, they were processed to generate datasets consisting of individual. plot images. For each pixel, its excess green value (Equation 1) was calculated (Fig. 3(b)). Then, thresholding (0.1) was conducted on the excess green image to generate a binary image—black pixel equals to 0 and white pixel equals to 1 (Fig. 3(c)).
Excess Green = 2×Green(G)-Red(R)-Blue(B)(1)
The experimental. field mainly consists of four large blocks (Fig. 3(a)) in the vertical. direction, and since the four blocks are similar, the approach developed for one of the blocks can be used on the other three. The top block was selected to explain the developed methodology. For individual. plot, the key parameter in the vertical. direction is the top and bottom coordinates for both large and small plots.For the large plots, the top and bottom lines are RI and R6; for the small plots, the boundaries are RI and R2, or R3 and R4, or R5 and R6 (Fig. 3(c)). For the horizontal. direction, the key coordinates are the left most boundary (Cl) and right most boundary (C2) (Fig. 3(c)). With the Cl and C2 value, coupled with the known information of how many plots there are on the images, individual. plot's coordinates can be automatically created.
For the binary image (Fig. 3(c)), for each column, the sum of pixel values is calculated, which is actually the number of white pixels (white pixel is equal. to 1; black pixel is equal. to 0). The relation between the image x coordinates (horizontal. direction) and their corresponding sum of the individual. column is shown in Fig. 3(d). Due to a sudden change from 0 to a very high value, the Cl value could be obtained, and the C2 value is actually the right edge of the image. Similarly, the relationship between the row coordinate (vertical. direction) and each row's sum is presented in Fig. 3(e), with R1-6 values calculated automatically. After detecting each plots coordinates, these coordinates were used to crop the original. images automatically to generate the individual. plot dataset. Sample images automatically generated are shown in Fig. 3(e).
2.3 Machine learning algorithm
While applying ML models, it requires to first extract and then feed features into the model for training and testing. In this study, color and textural. features were extracted. A detailed description of those features is shown in Table 1. Since our group has published a paper with all features1 information (e.g., formula and specifical. meanings) used in this study explained, all the detailed information can be found in [19]. The color features were chosen as lodged crop plots would have soil and stems shown in the images, which may be less green than the normal. crop growing area. As for the texture features, lodged crops may be not as uniform as non-lodged crops. A number of classifiers have been used to address classification issues in agriculture, such as K nearest neighbors (KNN), random forest (RF), and support vector machine (SVM)[31,32], and since there is no clear information about which classifier couldlead to the highest detection accuracy, this study tested all the three commonly used methods (KNN, RF, and SVM) that have good performance validated in previous research. While applying KNN, a crucial. parameter affecting the performance of KNN is the selection of K value—small value would reduce the accuracy, while a large value would increase the computational. cost. Preliminary tests on different K values (5 to 50) were conducted, and K = 20 was selected. While taking advantage of SVM, the most performance affecting parameter is the kernel function. There are many kernel functions can be used, including sigmoid, polynomial, and radial. basis function (RBF). In this study, RBF was selected for its robust performance[7]. Regarding RF, out-of-bag error (OOBE) was used to evaluate the model's prediction accuracy. Preliminary results showed that OOBE decreased when the tree number was larger than 100. Thus, 100 trees were used in the RF model.
2.4Deep learning
Compared to the complex procedures of using ML model to address classification issues, DL models are recently used by researchers. Compared to the ML, there is no need to perform the manual. feature extraction and selection procedure for the DL,which is domain knowledge-based and challenging for some researchers. There are a number of DL models that have been used, such as GoogLeNet, VGG16, ResNet101, to address classification problems in agriculture[19,31,32]. In this study, since it is unknown which DL model has the most satisfactory performance, the commonly used and performance validated three models (i. e., ResNet101, VGG16, and GoogLeNet) were tested, following by comparing their performances. The VGG16 network stacks layers on top of each other to increase the layer number of the network, and “16”stands for the number of weight layers. To avoid the vanishing gradient and overfitting problems with the increased number of layers, a residual. module was added to the ResNet101 model, which makes it possible to train deep neural. networks. The innovation of GoogLeNet relies on the concept of inception module, which arranges the convolution and pooling layers in a parallel manner. Thus, features extracted by GoogLeNet are more comprehensive—including both general. and local. features[19].
While applying DL model, it is desirable to have more data for model training and testing. Thus, researchers always conduct dataset augmentation procedure before running DL models. Dataset augmentation is a procedure to manually increase the size of existing datasets. This study conducted geometric transformation for dataset augmentation, including shear, translation, rotation, scaling, and reflection. For individual. image, one of the five geometric transformation approaches was randomly selected and applied. For each height, the original. dataset consisted of 183, 144 and 73 images for non-,light-, and severe-lodging, respectively; after the image augmentation procedure, the dataset consisted of 549, 432 and 219 images for non-, light-, and severe-lodging, respectively.
All data processing was based on Matlab®2020b (The Mathworks, Inc., Natick, Mass., USA), including feature extraction and selection, and running ML and DL models. The desktop used for this study was configured with Windows 10 OS, Intel (R) Core(TM) i7-8700 CPU, 32 GB RAM, Intel(R) UHD Graphics 630, and 16 GB GPU memory. For all the modeling processes, 70% of the dataset was randomly selected to be used for training, and the other 30% for testing.
3Results and discussion
3.1Machine learning classification results
For the ML approach, the SVM, RF and KNN classifiers were used and the results of the three classifiers, performance on different heights are shown in Fig. 4. Each model was run for 10 times, with the averaged detection accuracy used to represent the model's performance. For all the three different heights, among the three models, RF consistently results in higher accuracy over the other two models. For the three different heights, the accuracy of RF is at least 4% higher than either of the other two models (SVM and KNN). Therefore, among the three models, RF should be selected to serve the purpose of lodging ratio detection due to its high accuracy.
Detailed information of the RF model performance is shown in Fig. 5. The accuracies of 15, 46 and 91 m altitude are 71.5%, 70.8% and 71.4%,which are not significantly different from each other (same letter in Fig. 5). The image pixel resolutions of the 15, 46, and 91 m were 0.4, 1.2 and 2.5 cm/pixel, respectively, indicating that images with2.5 cm/pixel resolution performing similarly to images with 1.2 and 0.4 cm/pixel. The reason for this observation is perhaps both the analysis region of interest and the plot scale (1.5 m×3.6 m and 1.5 m×14.6 m)are large. Since higher resolution images requires more time to be collected, more storage space, and more computer power to be processed than lower resolution ones, and based on the results found on this study, it recommends that future studies on wheat lodging detection could be carried out using imagery with 2.5 cm/pixel resolution.
3.2Deep learning results
Wheat lodging detection accuracies for three different ML models (ResNet101, GoogLeNet and VGG16) are shown in Fig. 6. Since the DL model ran many iterations, and it uses randomly selected data (70% training and the other 30% testing) in each iteration, there is no need to run the models multiple times. Among the three models, in each flight height, ResNet101 and VGG16 consistently result in the highest and lowest detection accuracy, respectively. The reason for the ResNet101 to leadto the highest accuracy is probably deep layers (more convolutional. layers). The more layers the model has, the finer features the model could extract. The finer features would represent the image's characters more accurately, and thus lead to higher accuracy. The GoogLeNet has an inception module, arranging the convolutional. and pooling layers in parallel to extract features using different size of filters (i.e., 1×1, 3×3, 5×5). By applying different size of filters, the inception model could extract both general. and local. features. Since VGG16 could only extract features using one size of filter, it explained the GoogLeNet generating a higher accuracy over VGG16. Considering the superior performance of ResNet101 over GoogLeNet and VGG16 on all three flight heights, ResNet101 is recommended to be used for wheat lodging ratio detection. For the ResNet101, the detection accuracies are 75.2%, 75.1%, and 75.3% for the three flight heights of 15 m (image resolution 0.4 cm/pixel), 46 m (image resolution 1.2 cm/pixel) and 91 m (image resolution 2.5 cm/pixel), respectively. Generally, similar to RF,the UAV flight height does not affect the detection accuracy significantly by using the ResNe101.
3.3Comparison of ML and DL
The detection accuracies comparison between ML (RF) and DL (ResNet101) models are shown in Table 2. For all the three mission heights, ResNet101 has a higher accuracy over RF consistently. A potential. reason is that the manually extracted features are limited, and there are some other meaningful features that could represent the image properties are missed, or have not been identi- fied/incorporated by researchers. The miss of these meaningful features lowers the model accuracy. However, the ResNet101 model takes advantage of convolutional. neural. networks to extract deep features, which could extract very fine deep features. Thus, since the deep features could represent the imaged fine characteristics, it would represent the images more properly and comprehensively over the manually extracted features.
After comparing the performance of RF and ResNet101, the ResNet101 is recommended to be used for wheat lodging detection. Since different flight heights do not affect the detection accuracy, it is recommended to use the 91 m (300 ft.) images over the 15 m (50 ft.) images for wheat lodging detection due to the high data collection speed andsmall size of dataset.
4Conclusion
This study has tested the performance of the machine learning models (SVM, RF and KNN) and deep learning model (ResNet101, GoogLeNet, and VGG16) on wheat lodging ratio detection at three different heights. A majority of studies related to image classification have used a manual. approach to generate individual. plot images from field trials, which is time-consuming, inefficient, and inaccurate. A new approach for automatic field plot dataset generation, which based on image pre-processing using excess green index was developed. This new and automatic dataset generation approach was applied and validated, and could be applied to a similar workflow by other researchers. For both RF and ResNet101, the detection accuracies were not significantly different for the three flight altitudes (15, 46 and 91 m) tested, which had image resolutions of 0.4, 1.2 and 2.5 cm/pixel, respectively. Since flying at high altitude did not affect the models1 accuracy and increase efficiencies related to data collection and processing, it is recommended to use 2.5 cm/pixel resolution, instead of the 0.4 or 1.2 cm/pixel resolutions, for wheat lodging ratio detection. Regarding the SVM and ResNet101, the ResNet101 is recommended for wheat lodging ratio detection because of its higher accuracy and simple application procedure (free of manual. feature selection). This study has demonstrated that using low-resolution images(2.5 cm/pixel) coupled with ResNet101 is an efficient approach for wheat lodging ratio detection, with an accuracy of 75%.
There are a number of parameters that can be used to compare the performance of models, such as model size, computation cost, and accuracy. Since this study was insensitive to model size and computation cost, and researchers were more concerned on the detection accuracy, authors chose the accuracy metric to compare the model performance. Further research can be conducted to provide a comprehensive comparison between different models.
References:
[1] BALFOURIER F, BOUCHET S, ROBERT S, et al. Worldwide phylogeography and history of wheat genetic diversity [J]. Science Advances, 2019, 5(5): ID 0536.
[2] SHEWRY P R, HEY S J. The contribution of wheat to human diet and health[J]. Food Energy Security, 2015, 4(3): 178-202.
[3] STATISTA. Global. wheat production from 2011/2012 to 2020/2021 [EB/OL]. (2021-03-05) [2021-03-30]. https://www.statista.com/statistics/267268/production- of-wheat-worldwide-since-1990/.
[4]JAHAN N, FLORES P, LIU Z, et al. Detecting and distinguishing wheat diseases using image processing and machine learning algorithms[C]// 2020 ASABE Annual. International. Virtual. Meeting. St. Joseph, MI: ASABE,U.S., 2020.
[5] MONDAL. S, RUTKOSKI J E, VELU G, et al. Harnessing diversity in wheat to enhance grain yield, climate resilience, disease and insect pest resistance and nutrition through conventional. and modern breeding approaches[J]. Frontiers in Plant Science, 2016, 7: ID 991.
[6] WEBBER H, EWERT F, OLESEN J E, et al. Diverging importance of drought stress for maize and winter wheat in Europe [J]. Nature Communications, 2018, 9 (1): 1-10.
[7] ZHANG Z, FLORES P, IGATHINATHANE C, et al. Wheat lodging detection from UAS imagery using machine learning algorithms[J]. Remote Sensing, 2020, 12 (11): ID 1838.
[8] CHAUHAN S, DARVISHZADEH R, BOSCHETTI M, et al. Remote sensing-based crop lodging assessment: Current status and perspectives[J]. ISPRS Journal. of Photogrammetry and Remote Sensing, 2019, 151: 124-140.
[9] WU W, MA B L. A new method for assessing plant lodging and the impact of management options on lodging in canola crop production[J]. Scientific Reports, 2016, 6(1): 1-17.
[10] SETTER T L, LAURELES E V, MAZAREDO A M. Lodging reduces yield of rice by self-shading and reductions in canopy photosynthesis [J]. Field Crops Research, 1997, 49: 95-106.
[11] PINTHUS M J. Lodging in wheat, barley, and oats: the phenomenon, its causes, and preventive measures[J]. Advanced Agronomy, 1974,25: 209-263.
[12] ISLAM M S, PENG S, VISPERAS R M, et al. Lodging-related morphological. traits of hybrid rice in a tropical. irrigated ecosystem[J]. Field Crops Research, 2007, 101(2):240-248.
[13] ZHANG Z, HEINEMANN P H, LIU J, et al. The development of mechanical. apple harvesting technology: A review [J]. Transactions of the ASABE, 2016, 59(5): 1165-1180.
[14] ZHANG Z, POTHULA A, LU R. Improvements and evaluation of an infield bin filler for apple bruising and distributions[J]. Transactions of the ASABE, 2019, 62 (2): 271-280.
[15] ZHANG Z, IGATHINATHANE C, LI J, et al. Technology progress in mechanical. harvest of fresh market apples[J]. Computers and Electronics in Agriculture, 2020, 175: ID 105606.
[16] LU R, POTHULA A, MIZUSHIMA A, et al. System for sorting fruit: 9919345[P]. 2018-03-20.
[17] ZHANG Z, LU Y, LU R. Development and evaluation of an apple infield grading and sorting system[J]. Postharvest Biology and Technology, 2021, 180: ID 111588.
[18] YAO L, HU D, ZHAO C, et al. Wireless positioning and path tracking for a mobile platform in green- house[J]. International. Journal. of Agricultural. and Biological. Engineering, 2021, 14(1): 216-223.
[19] FLORES P, ZHANG Z, IGATHINATHANE C. et al. Distinguishing seedling volunteer comfrom soybean through greenhouse color, color-infrared, and fused images using machine and deep learning[J]. Industrial. Crops and Products, 2021, 161: ID 113223.
[20] FISCHER R A, STAPPER M. Lodging effects on high- yielding crops of irrigated semidwarf wheat [J]. Field Crops Research, 1987, 17: 245-258.
[21] PINERA-CHAVEZ F J, BERRY P M, FOULKES M J,et al. Avoiding lodging in irrigated spring wheat. I.Stem and root structural. requirements[J]. Field Crops Research, 2016, 196: 325-336.
[22] YANG M D, HUANG K S, KUO Y H, et al. Spatial. and spectral. hybrid image classification for rice lodging assessment through UAV imagery[J]. Remote Sensing, 2017, 9(6): ID 583.
[23] YANG H, CHEN E, LI Z, et al. Wheat lodging monitoring using polarimetric index from RADARSAT-2 data[J]. International. Journal. of Applied Earth Observation and Geoinformation, 2015, 34: 157-166.
[24] ZHAO L, YANG J, LI P, et al. Characterizing lodging damage in wheat and canola using Radarsat-2 polarimetric SAR data[J]. Remote Sensing Letter, 2017, 8 (7): 667-675.
[25] VARGAS J Q, KHOT L R, PETERS R T, et al. Low orbiting satellite and small UAS-based high-resolution imagery data to quantify crop lodging: A case study in irrigated spearmint[J]. IEEE Geoscience and Remote Sensing Letters, 2019, 17(5): 755-759.
[26] CHAUHAN S, DARVISHZADEH R, LU Y, et al. Understanding wheat lodging using multi-temporal. Sentinel-1 and Sentinel-2 data[J]. Remote Sensing of Environment, 2020,243:ID 111804.
[27] CHU T, STAREK M J, BREWER M J, et al. Assessing lodging severity over an experimental. maize (Zea maysL.) field using UAS images[J]. Remote Sensing, 2017, 9(9): ID 923.
[28] RAJAPAKSA S, ERAMIAN M, DUDDU H, et al. Classification of crop lodging with gray level co-occurrence matrix[C]//2018 IEEE Winter Conference on Applications of Computer Vision. Piscataway, New York, USA: IEEE, 2018: 251-258.
[29] LI X, LI X, LIU W, et al. A UAV-based framework for crop lodging assessment[J]. European Journal. of Agronomy, 2021, 123: ID 126201.
[30] MARDANISAMANI S, MALEKI F, HOSSEINZA- DEH K, et al. Crop lodging prediction from UAV-acquired images of wheat and canola using a DCNN augmented with handcrafted texture features[C]// 2019 IEEE/CVF Conference on Computer Vision and Pattern Recognition Workshops. Piscataway, New York, USA: IEEE, 2019.
[31] ABALLA A, CEN H, WAN L, et al. Nutrient status diagnosis of infield oilseed rape via deep learning-enabled dynamic model[J]. IEEE Transactions on Industrial. Informatics, 2020, 17(6): 4379-4389.
[32] FLORES P, ZHANG Z, JITHIN M, et al. Distinguishing volunteer com from soybean at seedling stage using images and machine learning[J]. Smart Agriculture, 2020. 2(3): 61-74.
猜你喜欢
环球时报(2022-07-13)2022-07-13
环球时报(2022-03-14)2022-03-14
电脑知识与技术·经验技巧(2020年5期)2020-06-22
农民致富之友(2019年32期)2019-11-23
清明(2019年6期)2019-11-21
校园英语·上旬(2017年14期)2017-12-21
小学生作文选刊·中高年级版(2017年10期)2017-11-07
新农村(2017年17期)2017-08-23
儿童故事画报·智力大王(2015年10期)2016-01-27
江南诗(2014年4期)2014-08-26