
Profiling of hepatocellular carcinoma neoantigens reveals immune microenvironment and clonal evolution related patterns
2021-07-30 08:53ZhenliLiGengChenZhixiongCaiXiuqingDongLeiHeLimanQiuYongyiZengXiaolongLiuJingfengLiu
Zhenli Li,Geng Chen,Zhixiong Cai,Xiuqing Dong,Lei He,Liman Qiu,Yongyi Zeng,3,Xiaolong Liu,Jingfeng Liu,3
1The United Innovation of Mengchao Hepatobiliary Technology Key Laboratory of Fujian Province,Mengchao Hepatobiliary Hospital of Fujian Medical University,Fuzhou 350025,China;2Mengchao Med-X Center,Fuzhou University,Fuzhou 350116,China;3Liver Disease Center,the First Affiliated Hospital of Fujian Medical University,Fuzhou 350005,China
Abstract Objective:Neoantigens derived from tumor-specific genomic alterations have demonstrated great potential for immunotherapeutic interventions in cancers.However,the comprehensive profile of hepatocellular carcinoma(HCC) neoantigens and their complex interplay with immune microenvironment and tumor evolution have not been fully addressed.Methods:Here we integrated whole exome sequencing data,transcriptome sequencing data and clinical information of 72 primary HCC patients to characterize the HCC neoantigen profile,and systematically explored its interactions with tumor clonal evolution,driver mutations and immune microenvironments.Results:We observed that higher somatic mutation/neoantigen load was associated with better clinical outcomes and HCC patients could be further divided into two subgroups with distinct prognosis based on their neoantigen expression patterns.HCC subgroup with neoantigen expression probability high (NEP-H) showed more aggressive pathologic features including increased incidence of tumor thrombus (P=0.038),higher recurrence rate (P=0.029),more inclined to lack tumor capsule (P=0.026) and with more microsatellite instability sites (P=0.006).In addition,NEP-H subgroup was also characterized by higher chance to be involved in tumor clonal evolution [odds ratio(OR)=46.7,P<0.001].Gene set enrichment analysis revealed that upregulation of MYC and its targets could suppress immune responses,leading to elevated neoantigen expression proportion in tumor cells.Furthermore,we discovered an immune escape mechanism that tumors could become more inconspicuous by evolving subclones with less immunogenicity.We observed that smaller clonal mutation clusters with higher immunogenicity in tumor were more likely to involve in clonal evolution.Based on identified neoantigen profiles,we also discovered series of neoantigenic hotspot genes,which could serve as potential actionable targets in future.Conclusions:Our results revealed the landscape of HCC neoantigens and discovered two clinically relevant subgroups with distinct neoantigen expression patterns,suggesting the neoantigen expression should be fully considered in future immunotherapeutic interventions.
Keywords:Immune microenvironment;immune escape;MYC regulation;neoantigen;tumor clonal evolution
Introduction
Hepatocellular carcinoma (HCC),the most common primary liver malignancy in China,ranks the third among causes of cancer mortality (1).As an organ with distinct anatomical structure,liver is constantly exposed to exogenous antigens (2). Consequently,liver microenvironment used to exhibit immune tolerance features,which benefit the immune escape of tumor cells (3).Recent developed cancer immunotherapies,aiming to deal with cancers by boosting human body’s own immune responses,are promising strategies for HCC treatment.Immune checkpoint inhibitors such as anti-PD-1 antibody could improve the overall survival (OS) of unresectable HCC patients compared to the first line sorafenib treatment,and have shown great potential for HCC clinical treatment of(4).However,a large proportion of HCC patients did not respond to checkpoint blockade treatment [with an objective response rate of approximate 20% (5)],which is mainly due to the inefficiency of their T cells to effectively recognize tumor cells. Neoantigens,tumor specific antigens generated from tumor genomic alterations,are key players in T cells’ recognition of tumor cells.Neoantigen-based cancer immunotherapies have shown excellent capability to trigger tumor-specific immune responses in solid tumors such as melanoma,colorectal cancer and cholangiocarcinoma,demonstrating great potential for clinical applications (6,7). Thus,the identification and systematic profiling of neoantigens in HCC will greatly benefit future immunotherapies.
Tumors are dynamically evolving under the pressure of its surrounding microenvironment,and interaction between tumor neoantigens and the immune system also plays crucial parts in tumor evolution.Recent studies have emphasized the importance of immunoselection of neoantigens in cancer evolution and presented complicated dynamics contributed by both tumor antigenicity and immune cells (8-10).On one hand,tumor’s antigenicity contributes to the attraction of tumor-infiltrating lymphocytes (9),while immune cells also in turn sculpt the antigenicity of tumors via immunoediting (10).However,there is still a lack of studies fully clarifying the clinical relevance of HCC neoantigens and their interactions with clonal evolution as well as immune microenvironment.In this study,we integrated clinical data along with whole exome and transcriptome sequencing data from 72 primary HCC patients to perform a comprehensive profiling of HCC neoantigens,revealed distinct expression patterns with clinical relevance,and further explored their interactions with tumor clonal evolution,driver mutations as well as immune microenvironments.
Materials and methods
Sample collection
Primary tumor tissues and paired peritumoral tissues from 72 patients diagnosed with primary HCC and received surgical operation in Mengchao Hepatobiliary Hospital of Fujian Medical University were collected during surgery operation from December 2014 to September 2018.The diagnosis of primary HCC was confirmed by at least two experienced pathologists and none of the patients received other treatments before surgical resection. Written informed consent was obtained from each participant before sample collection.All study protocols were approved by the Institution Review Board of Mengchao Hepatobiliary Hospital of Fujian Medical University and conducted following the principles of the Declaration of Helsinki.
Next-generation sequencing and mapping
DNA and RNA extracted from HCC tumor and paired peritumoral tissues were subjected to whole exome sequencing (WES) and whole transcriptome sequencing on Illumina HiSeq X10 platform (paired end,150 bp) by Annoroad Gene Tech.(Beijing) Co.,Ltd.Qualified WES sequencing reads were aligned to hg19 human genome assembly (GRCh37) using BWA (11).Duplicates of all mapped reads were then marked and discarded using Picard(12).As for transcriptome data,all reads with high quality were aligned to GRCh37 with GENCODE gene annotation using STAR (13).The expression of all genes was quantified using transcripts per kilobase per million mapped reads (TPM).
Human leukocyte antigen (HLA) genotyping
Four-digit genotype of classical HLA class I genes (HLAA,HLA-B and HLA-C) for all included patients were assessed by OptiType (14) based on RNA-seq data,while HLA class II alleles (HLA-DRB1) were assessed by Seq2HLA (15) using default parameters.
Somatic mutation,RNA-editing identification and neoantigens prediction
Somatic mutations of HCC tumor were identified with Mutect2 in GATK using paired peritumoral tissue samples as control (16).Somatic mutations fufuilling following criteria were retained for downstream analysis:≥20× depth in both tumor and peritumoral samples;variant allele frequencies (VAF) ≥5% in tumor samples;VAF≤1% in peritumoral samples.
RNA editing sites were identified by RNAEditor (17).Acquired RNA editing sites were further filtered by depth and allele frequency using bam2R algorithm from R package DeepSNV (18) with following criteria:≥20× depth in tumor tissues,VAF≥5% in tumor tissues,VAF≤1% in peritumoral tissues.
All qualified somatic mutations and RNA editing sites were then annotated by variant effect predictor (VEP) (19).Immunogenicity of all mutations was evaluated using pVAC-Seq pipeline (20) with NetMHCpan binding affinity predictor.In brief,for each missense mutation,binding affinity of 8-and 9-mer peptides containing mutated amino acids to patient’ s HLA class I alleles was predicted by NetMHCpan (21),and binding affinity of corresponding 15-mer peptides to HLA class II alleles was predicted by NetMHCpanII (22).Mutations that produce mutant peptides with IC50<500 nanomolar (nM) to either HLA class I or HLA class II alleles were considered as candidate neoantigens.All the somatic mutation-derived neoantigens were further validated at RNA level by bam2R algorithm from R package DeepSNV (18),and neoantigens with ≥20×depth and VAF≥0.05 in tumor RNA-seq data were defined as expressed neoantigens.
Microsatellite instability (MSI) evaluation
MSI was evaluated by MSIsensor (23) using WES sequencing data of tumor and paired peritumoral tissues.Both numbers of somatic MSI sites and MSI scores inferred by MSIsensor were used to evaluate the MSI degree.
Lymphocyte analysis
T cell receptor (TCR) and immunoglobulin RNA repertoires were extracted from RNA-seq data and processed via MiXCR (V3.0.12) (24).The Clonality index of the lymphocytes was defined as 1-Pielou’s evenness,and the richness of lymphocyte was defined as the number of unique clones identified by MiXCR.
Driver gene annotation
HCC-related driver genes were obtained from the DriverDBv2 database (25).In total,674 driver genes identified by at least two computational algorithms with The Cancer Genome Atlas (TCGA) HCC dataset were included.In addition,driver genes were also predicted by MutSigCV (26) using WES data of the enrolled 72 HCC patients,genes with P<0.05 were further considered as driver genes.
Immune cell infiltration
Single sample Gene Set Enrichment analysis (ssGSEA)(27) was performed to assess the relative level of immune cell infiltration.The signature genes of 28 immune cell types were acquired from Charoentonget al.(28) and the enrichment score of each immune cell type calculated by ssGSEA was used to represent the relative level of infiltrations.
Differential pathway enrichment analysis
All the hallmark gene sets representing well-defined biological states/processes were obtained from the Molecular Signatures Database (MSigDB) (29),and enrichment of these gene sets were evaluated by ssGSEA (27).Student’st-test was performed to evaluate the differentially enriched pathways between different groups of patients,and the significantly differentially expressed pathways were selected (P<0.05).
Clonal evolution assessment
To reconstruct the clonal structure of included HCC samples,mutation clustering was performed with Sclust(30) and somatic mutations identified by Mutect2 with adequate depth (≥20) in both tumor and peritumor tissues were subjected to clonal evolution analysis.In brief,tumor somatic mutations were clustered using their copy-numberadjusted cancer cell fractions,which were calculated based on read counts.The identified mutation clusters were classified into three categories (31):clonal mutation clusters were mutation clusters with the highest cancer cell fraction in each sample,containing somatic mutations shared among all tumor cells;subclonal mutation clusters were mutation clusters with medium cancer cell fraction,which represented mutations specifically occur in tumor subclones;background mutation clusters had the lowest cancer cell fraction (mostly <0.1),which represented randomly accumulated mutations scattered in tumor cells.
dN/dS analysis
The dN/dS ratio was calculated for each patient using R package dndscv (V0.0.1.0) (32).In short,all identified somatic mutations for all patients were integrated and used as input for dndscv.Then dndscv deployed trinucleotide context-dependent substitution models to evaluate the observed-over-expected ratio of missense and nonsense mutations.
Statistical analysis
Patients were divided into two groups using the 25th percentile of each mutation feature.Survival analysis of different groups was conducted using Kaplan-Meier analysis,and log-rank test was performed to examine the significance.Univariate and multivariate Cox regression analysis were performed to identify the independent prognosis factors.Chi-square test or Fisher’s exact test for categorical variables and independentt-test for continuous variables were applied to examine the differences between two groups.All statistical analyses were conducted using R software (Version 3.4.3;R Foundation for Statistical Computing,Vienna,Austria),and P values of less than 0.05 were considered as statistically significant.
Results
Landscape of neoantigens in HCC
To obtain a comprehensive profile of HCC neoantigens,72 HCC patients receiving surgical operation in Mengchao Hepatobiliary Hospital of Fujian Medical University were enrolled and the corresponding tumor/peritumor tissues were collected for WES and transcriptome sequencing.Clinicopathological characteristics and predicted neoantigen loads for all the 72 patients are demonstrated inFigure 1A.
Despite well-known somatic mutation induced neoantigens,recent reports also indicated that RNA editing could serve as another major source of neoantigens (33).For a majority of HCC patients in our analysis,somatic mutations,rather than RNA editing sites,were the dominant source of tumor neoantigens (Figure 1A).In total,a median of 298 somatic mutations and 138 somatic mutation-derived neoantigens were identified in each patient (Figure 1B),while a large proportion of them showed relatively low VAF with only a median of 140 somatic mutations and 70 somatic neoantigens showing VAF greater than 10% (Supplementary Figure S1).Not surprisingly,the load of somatic mutation-derived neoantigens was strongly correlated with the load of somatic mutations (R2=0.973,P<0.001,Figure 1C).As for RNA editing,we only observed limited quantity of RNA editing-derived neoantigens (median=10,Figure 1D)despite the relatively high RNA editing load (median=506).This is majorly due to that these RNA editing sites are mostly located in the transcripts’ UTRs,with only~3% of them could lead to missense protein alterations(Supplementary Figure S2).However,a significant correlation between the RNA editing load and the RNA editing-derived neoantigens (Figure 1E) was still observed.
Associations between HCC neoantigen and patients’clinical characteristics
With previous reports showing the prognostic relevance of neoantigen/mutation load (9),we also investigated their significance in HCC prognosis.Kaplan-Meier analysis showed that the overall neoantigen load (combining neoantigens derived from both somatic mutations and RNA editing sites) rather than overall mutation load(combining somatic mutations and RNA editing sites) was a significant HCC prognosis predictor (Figure 2A,B),with higher overall neoantigen load indicating significantly better OS (P=0.004) and slightly better recurrence-free survival (RFS) (P=0.062).
Further stratification analysis revealed that the somatic mutation load was the major component significantly associated with HCC prognosis (Figure 2C),while RNA editing load showed no such significant association(Supplementary Figure S3A,B).Accordantly,HCC patients with more somatic mutation-derived neoantigens had significant better OS and RFS (both P<0.05,respectively,Figure 2D),while RNA editing-derived neoantigens again showed no such association (Supplementary Figure S3C,D).These results suggested that somatic mutations and their corresponding neoantigens significantly contributed to patients’ prognosis,while the effect of RNA editing was somehow limited.Considering this,our following analysis only focused on somatic mutation-derived neoantigens.
Next,clinicopathological analysis was performed to compare HCC patients with higher and lower somatic mutation/neoantigen load.Age is significantly related to patients’ mutation/neoantigen load (both P<0.05,respectively),consistent with the fact that mutations accumulated with aging.Additionally,higher neoantigen load group also showed better clinical outcomes,with significantly less incidence of tumor microsatellite lesion(P=0.009),recurrence (P=0.039) and tumor thrombi(P=0.063).Moreover,patients with higher neoantigen load were more likely to have alcohol drinking history (P=0.059)(Figure 2E).It is not surprising since the defective DNA replication caused by alcohol has been reported to cause somatic mutation accumulation (34).However,both neoantigen load and mutation load showed no association with gender,TNM stages,Barcelona Clinic Liver Cancer(BCLC) stages or tumor envelop in our study(Supplementary Figure S4).

Figure 1 Landscape of neoantigens in HCC.(A) Neoantigens derived from somatic mutations/RNA editing sites (top) and clinical characteristics (bottom) of each patient;(B) Density plot of somatic mutation load (red) and corresponding neoantigen load (green);(C)Scatterplot showing correlation between somatic mutation load and corresponding neoantigen load (R2=0.973,P<0.001);(D) Density plot of RNA editing load (red) and corresponding neoantigen load (green);(E) Scatterplot showing correlation between RNA editing load and corresponding neoantigen load (R2=0.814,P<0.001).HCC,hepatocellular carcinoma;BCLC,Barcelona Clinic Liver Cancer.
Two subgroups of HCC patients with distinct neoantigen expression patterns
Besides mutation load and neoantigen load mentioned above,neoantigen expression is another important indicator for tumor immunogenicity.We further extracted neoantigens that can be steadily detected at transcriptome level (VAF>0.05 in transcriptome sequencing data) and defined them as expressed neoantigens.In total,a median of 22 expressed neoantigens were identified in each patient(Supplementary Figure S5),and the number of expressed neoantigens significantly correlated with neoantigen load(R2=0.506,P<0.001,Figure 3A). Judging from the distribution of correlation plot (Figure 3B),we discovered two clusters of patients following distinct neoantigen expression patterns.Intriguingly,the number of expressed neoantigens and neoantigen load showed excellent correlation within each cluster (cluster 1:R2=0.901,P<0.001;cluster 2:R2=0.885,P<0.001).Survival analysis further revealed that cluster 1 had significantly worse OS and RFS than cluster 2 (P=0.006 for OS and P=0.004 for RFS).Meanwhile,the proportion of expressed neoantigens(the ratio of expressed neoantigens to all somatic neoantigens) was significantly lower in cluster 2 (P<0.001)(Supplementary Figure S6).Thus,we defined cluster 1 as neoantigen expression probability high (NEP-H) subgroup and cluster 2 as neoantigen expression probability low(NEP-L) subgroup. Consistently,the proportion of expressed neoantigens in all included patients also showed significant association with prognosis,while expressed neoantigen load itself did not possess such correlation(Figure 3D,E).

Figure 2 Associations between loads of HCC somatic mutation/neoantigen and patients’ clinical characteristics.(A-D) Kaplan-Meier curves of OS and RFS for patients stratified by overall mutation load (A),overall neoantigen load (B),somatic mutation load (C),somatic mutation-derived neoantigen load (D);(E) Column plot showing the ORs and 95% confidence intervals of the clinical parameters between patients with higher or lower somatic mutation/neoantigen load.The ORs and P values were calculated by χ2 test.HCC,hepatocellular carcinoma;OS,overall survival;RFS,recurrence-free survival;OR,odds ratio.
Clinical characteristic analysis revealed that NEP-H group was associated with more aggressive pathologic features including tumor absence of capsule,increased incidence of tumor thrombus and higher recurrence rate(all P<0.05,Figure 3F).These results indicated that higher proportion of steadily expressed neoantigens might be associated with neoantigen-expressing tumor cells that somehow escaped immune surveillance,which contribute to more advanced tumor progression.Univariate Cox regression analysis further confirmed that NEP-H subgroup had significant better OS and RFS (P=0.010 and P=0.005,respectively,Supplementary Table S1,2).However,multivariate Cox regression suggested that only tumor thrombus was an independent survival prognostic factor in both OS and RFS analysis.This might be explained by the significant association between NEP-H subgroup and incidence of tumor thrombus (Figure 3F).

Table S1 Univariate and multivariate Cox regression analysis of variables associated with overall survival

Table S2 Univariate and multivariate Cox regression analysis of variables associated with recurrence-free survival
Furthermore,we built a classifier to identify patients from each group and defined it as “neoantigen-expresspossibility-score”.The formula was estimated according to the dividing line between the two subgroups (Figure 3B),which is shown as follows.Patients with neoantigenexpress-possibility-score >0 were then classified as NEP-H and vice versa.

Association between neoantigen expression and MYC regulation
We performed differential pathway enrichment analysis to evaluate the differences of known biological states/processes in different subgroups,using all the hallmark gene sets from MSigDB (29).The results showed that gene sets related to MYC target genes were the most significantly differentially expressed.Meanwhile,MYCgene itself was also significantly overexpressed in NEP-H subgroup (P=0.006,Figure 3G).Gene set enrichment analysis (GSEA) of two MYC target gene sets (35,36)further confirmed the upregulation of MYC targets in NEP-H subgroup (Figure 3H).MYC activation is a molecular hallmark of cancer and is one of the necessary events for tumorigenesis initiation (37).Increased MYC activity is often related with aggressive tumor phenotypes in many cancers (38),which could explain the worse clinical outcomes of NEP-H subgroup.Additionally,recent studies have also emphasized the importance of MYC on directly dampening the antitumor responses,which contribute to tumor immune escape (39).Consistently,we observed significant correlation between MYC and PD-1 expression in HCC tumor and peritumor tissues (Supplementary Figure S7),indicating the MYC-regulated immune suppression.
Interestingly,as predicted by MSIsensor (23),NEP-H subgroup had significantly more MSI sites and higher MSI score (P=0.006 and P=0.001,Figure 3I).Relatively high MSI degree has been reported to be related with more aggressive tumor features in HCC (40) and recent studies have revealed the connection between MSI phenotype and highly-expressed DNA repair genes in cancer (41),which is consistent with our observation of simultaneously upregulation of DNA repair pathways in NEP-H subgroup.This is possibly due to that MSI-high tumors lacked the ability to repair DNA base-pairing mismatches,and DNA repair pathways were activated alternatively.All these results consistently suggested that the more aggressive phenotypes of NEP-H subgroup were induced by both immune suppression and DNA damage response.
Neoantigen and tumor clonal evolution
Tumor clonal evolution,which reflects the complicated interactions between tumor cells and microenvironment,has become an important concept in tumor progression,while neoantigens have been reported to be one major player involved in clonal evolution in some types of cancers(8).We reconstructed the tumor clonal structure for each tumor sample using Sclust algorithm (30).Based on identified mutation clusters,patients were divided into groups with/without clonal evolution,and mutations within different clusters were categorized into clonal,subclonal and background mutations (Supplementary Figure S8).Then,we defined the immunogenicity of mutation cluster as the proportion of corresponding mutant peptides with predicted binding potential to patients’ own HLA alleles.Interestingly,the immunogenicity of subclonal mutation cluster was significantly lower than both matched clonal and background mutation clusters (both P<0.001) (Figure 4A).Considering that tumor cells evolved under the pressure of immune microenvironment,lower immunogenicity of subclonal mutations might explain the competitive advantages of the emerging tumor subclones.

Figure 3 Two subgroups of HCC patients with distinct neoantigen expression patterns.(A) Scatterplot showing correlation between neoantigen load and expressed neoantigen load (R2=0.506,P<0.001);(B) Scatterplot showing two subgroups (marked by green and red,respectively) with distinct neoantigen expression patterns (Cluster1:R2=0.901,P<0.001;Cluster2:R2=0.885,P<0.001);(C-E) Kaplan-Meier curves of OS and RFS for patients from different subgroups (C) or stratified by proportion of expressed neoantigens (D) and load of expressed neoantigens (E);(F) ORs and 95% confidence intervals of the clinical parameters between patients from different subgroups.ORs and P values were calculated by χ2 test (*) and Fisher’s exact test (#);(G) Heatmap showing the top hallmark gene sets differentially enriched in the two subgroups (left),and violin plot comparing MYC expression level (TPM) between the two subgroups (right);(H) GSEA plot illustrating two MYC target gene sets significantly enriched in NEP-H subgroup compared with NEP-L subgroup;(I) Differences of microsatellite instability sites and MSI scores between the two subgroups.HCC,hepatocellular carcinoma;OS,overall survival;RFS,recurrence-free survival;OR,odds ratio;BCLC,Barcelona Clinic Liver Cancer;NEP-H,neoantigen expression probability high;NEP-L,neoantigen expression probability low;NES,normalized enrichment score;MSI,microsatellite instability.
Moreover,both higher clonal mutation/neoantigen load and background mutation/neoantigen load were associated with better OS and RFS (all P<0.05,Figure 4B,C,Supplementary Figure S8),while no association was observed for subclonal mutations/neoantigen load (Figure 4D,Supplementary Figure S9).Considering that the clonal mutation clusters represented mutation accumulation before tumorigenesis and background mutation clusters represented mutation accumulation along tumor progression,it is reasonable that these mutation clusters c o u l d r e f l e c t d i f f e r e n t a s p e c t s o f i m m u n e microenvironment status.Surprisingly,higher subclonal neoantigen load were correlated with better RFS in our study (P=0.038,Supplementary Figure S9F).
The association between neoantigens and clonal evolution further revealed that tumors with clonal evolution harbored significantly lower clonal mutation/neoantigen load (both P<0.001,Figure 4E),while their clonal mutation clusters showed significantly higher immunogenicity (P<0.001,Figure 4F).This result indicated that tumors with less mutation accumulation but higher immunogenicity in ancestry clones were under more pressure of immune surveillance,and thus promoted the emergence of tumor subclones.

Figure 4 Neoantigens and tumor clonal evolution.(A) Differences of immunogenicity between clonal mutation clusters,matched subclonal mutation clusters and matched background mutation clusters;(B-D) Kaplan-Meier curves of OS stratified by clonal neoantigen load (B),background neoantigen load (C) and subclonal neoantigen load (D);(E) Differences of clonal mutation load and clonal neoantigen load between tumors with different clonal evolution states;(F) Difference of immunogenicity of clonal mutation clusters between tumors with different clonal evolution states;(G) Patient-level proportion of expressed neoantigens,and matched subgroup information as well as clonal evolution state were also shown (left).ORs and 95% confidence intervals for the probability of clonal evolution between tumors within NEP-H and NEP-L subgroup (right).OS,overall survival;NEP-H,neoantigen expression probability high;NEP-L,neoantigen expression probability low.
Meanwhile,tumors with clonal evolution carried an average of two-fold higher proportion of expressed neoantigens and significant higher neoantigen-expresspossibility-score (both P<0.001,Figure 4G,Supplementary Figure S10).Notably,NEP-H subgroup showed extremely higher probability to involve in clonal evolution with an odds ratio (OR) of 46.7 [95% confidence interval (95% CI):9.2-236.0,P<0.001].Recent study has shown that immune responses strongly restricted intratumor genomic diversity and favored clonal dominance (42),and thus the clonal evolution indicated a weaker immune system that might contribute to the immune escape of neoantigens.Furthermore,evaluation of dN/dS acting on the entire exome in each patient revealed that the dN/dS ratio varied significantly between the two identified groups,with all patients in NEP-L subgroup showed dN/dS smaller than 1,while~41% of the patients in NEP-H subgroup showed dN/dS lager than 1 (P<0.001,Figure 4G).This result suggested that tumors in NEP-L group were more commonly under selective pressure presented by more activate tumor microenvironment.This is also consistent with their evolutionary patterns since the selective pressure could restrict tumor clonal evolution.
Immune cell infiltration and neoantigens
Since immune cells involved in the process of antigen presentation,we further use gene signatures of 28 immune cell types to evaluate the association between neoantigens and these immune cell types based on RNA-seq data (28).Clustering according to these immune cell signatures identified two clusters with distinct immune cell infiltration patterns,revealing a small immunologically hot subset(Figure 5A).Lymphocyte richness and clonality were significantly increased in these immunologically hot tumors(P=0.020 and P=0.002,Figure 5B).Surprisingly,patients with immunologically hot tumors have significantly worse OS (P=0.010) and slightly worse RFS (P=0.124) (Figure 5C).Furthermore,the hot tumors possessed slightly lower somatic mutation/neoantigen load (P=0.054 and P=0.120,Figure 5D). Differences were largely owing to the significantly lower background mutation/neoantigen load in these immunologically hot tumors (Supplementary Figure S11).It is a common belief that infiltration of immune cells into tumor tissues was associated with reduction of tumor burden and improved clinical prognosis. However,increasing studies have also suggested that the aberrantly more infiltration of immune cells into tumor could induce focal capsule disruptions and thus facilitate cancer invasion/metastasis (43,44). Reduction of background mutations and neoantigens in those hot tumors might indicate stronger immune activity of their immune system,while over-activated immune system might also disrupt the tumor capsule.Consistently,immunologically hot tumors were more likely to have no capsule with an OR of 10.4(95% CI: 2.18-49.8; P<0.001). Additionally,those immunologically hot tumors were also characterized by more advanced tumor stages and more possibility to have microsatellite lesions (all P<0.05,Figure 5E),indicating the impact of aberrant tumor-infiltrating immune cells on tumor progression.Furthermore,we also found infiltrating levels of several immune cell types correlated to proportion of expressed neoantigen proportions,suggesting they might affect neoantigen expression (Figure 5F).
Neoantigens and driver mutations
Immunotherapies targeting neoantigens have achieved excellent therapeutic effects in multiple cancer types (6,7),and neoantigens derived from recurrently mutated genes rather than rarely mutated genes are considered as better candidates for clinical utilization.We identified a list of neoantigenic hotspot genes for HCC patients,with the top 5 of them (TTN,TP53,OBSCN,MUC16andCTNNB1)covering 69.4% of the HCC patients (Figure 6A).Noteworthily,neoantigenic hotspot genes are mainly overlapped with known HCC driver genes,such asTP53andCTNB1.Annotation of driver genes by both DriverDB database and MutsigCV algorithm revealed that mutations from driver genes were more likely to produce neoantigens(both P<0.001,Figure 6B).Meanwhile,neoantigens located on driver genes were more likely to be clonal mutations(P<0.001,Figure 6C),supporting that driver mutations occurred in the early stage of tumor formation (both P<0.001,Figure 6B).Interestingly,relatively low coverage of neoantigens at hotspot genes were observed for NEP-H subgroup,and all six HCC tumors with no neoantigens in the top thirty hotspot genes belonged to NEP-H subgroup(Figure 6A). Further analysis revealed that NEP-L subgroup had~2 fold more driver mutation-derived neoantigens (both P<0.001,Figure 6D),indicating that the accumulation of driver gene mutations could greatly affect the interactions between tumor and immune microenvironment.

Figure 5 Neoantigens and immune cell infiltration.(A) Heatmap showing HCC sample clustering based on estimated infiltration of 28 immune cell types;(B) Differences of T cell clonality and T cell richness between immunologically cold and immunologically hot tumors;(C) Kaplan-Meier curves of OS (left) and RFS (right) comparing patients with immunologically cold or immunologically hot tumors;(D)Differences of somatic mutation load (left) and somatic neoantigen load (right) between immunologically hot and immunologically cold tumors;(E) ORs and 95% confidence intervals comparing the clinical parameters between immunologically hot tumors and immunologically cold tumors;(F) Scatterplots showing correlation between proportion of expressed neoantigens and the level of estimated infiltration of different immune cells,only immune cell types with significant correlation were shown.HCC,hepatocellular carcinoma;OS,overall survival;RFS,recurrence-free survival;OR,odds ratio;BCLC,Barcelona Clinic Liver Cancer.
Interestingly,we also found that neoantigens in a subset of hotspot genes (DNAH9,NBPF12,ANKRD20A4,NBPF10andZNF292) preferentially occurred in NEP-L subgroup and favored tumors without clonal evolution (Figure 6E).Furthermore,neoantigens in three of these genes (DNAH9,NBPF12andANKRD20A4) could only be observed in NEPL subgroup,covering 82.6% of tumors from NEP-L subgroup.Meanwhile,neoantigenic mutations onDNAH9andNBPF12were also specially observed in tumors without clonal evolution.Possible explanation for this intriguing phenomenon might be that neoantigen from these genes could affected tumor’s response to immune system,which resulted in suppression of neoantigen expression,and then the more active immune microenvironment restricted the tumor cell evolution.The above results demonstrated a strong correlation between neoantigenic hotspot genes and neoantigen expression patterns,which further influenced tumor evolution.

Figure S1 Frequency distribution of somatic mutations and neoantigens.Density plot of mutant variant allele frequency of somatic mutations (A) and neoantigens derived from somatic mutations (B).The red dash lines represent the median of the frequencies.

Figure S2 Classification of identified RNA editing sites.(A) Pie chart showing the proportion of identified RNA editing sites classified as 3-UTR variants,5-UTR variants,missense variants and synonymous variants.
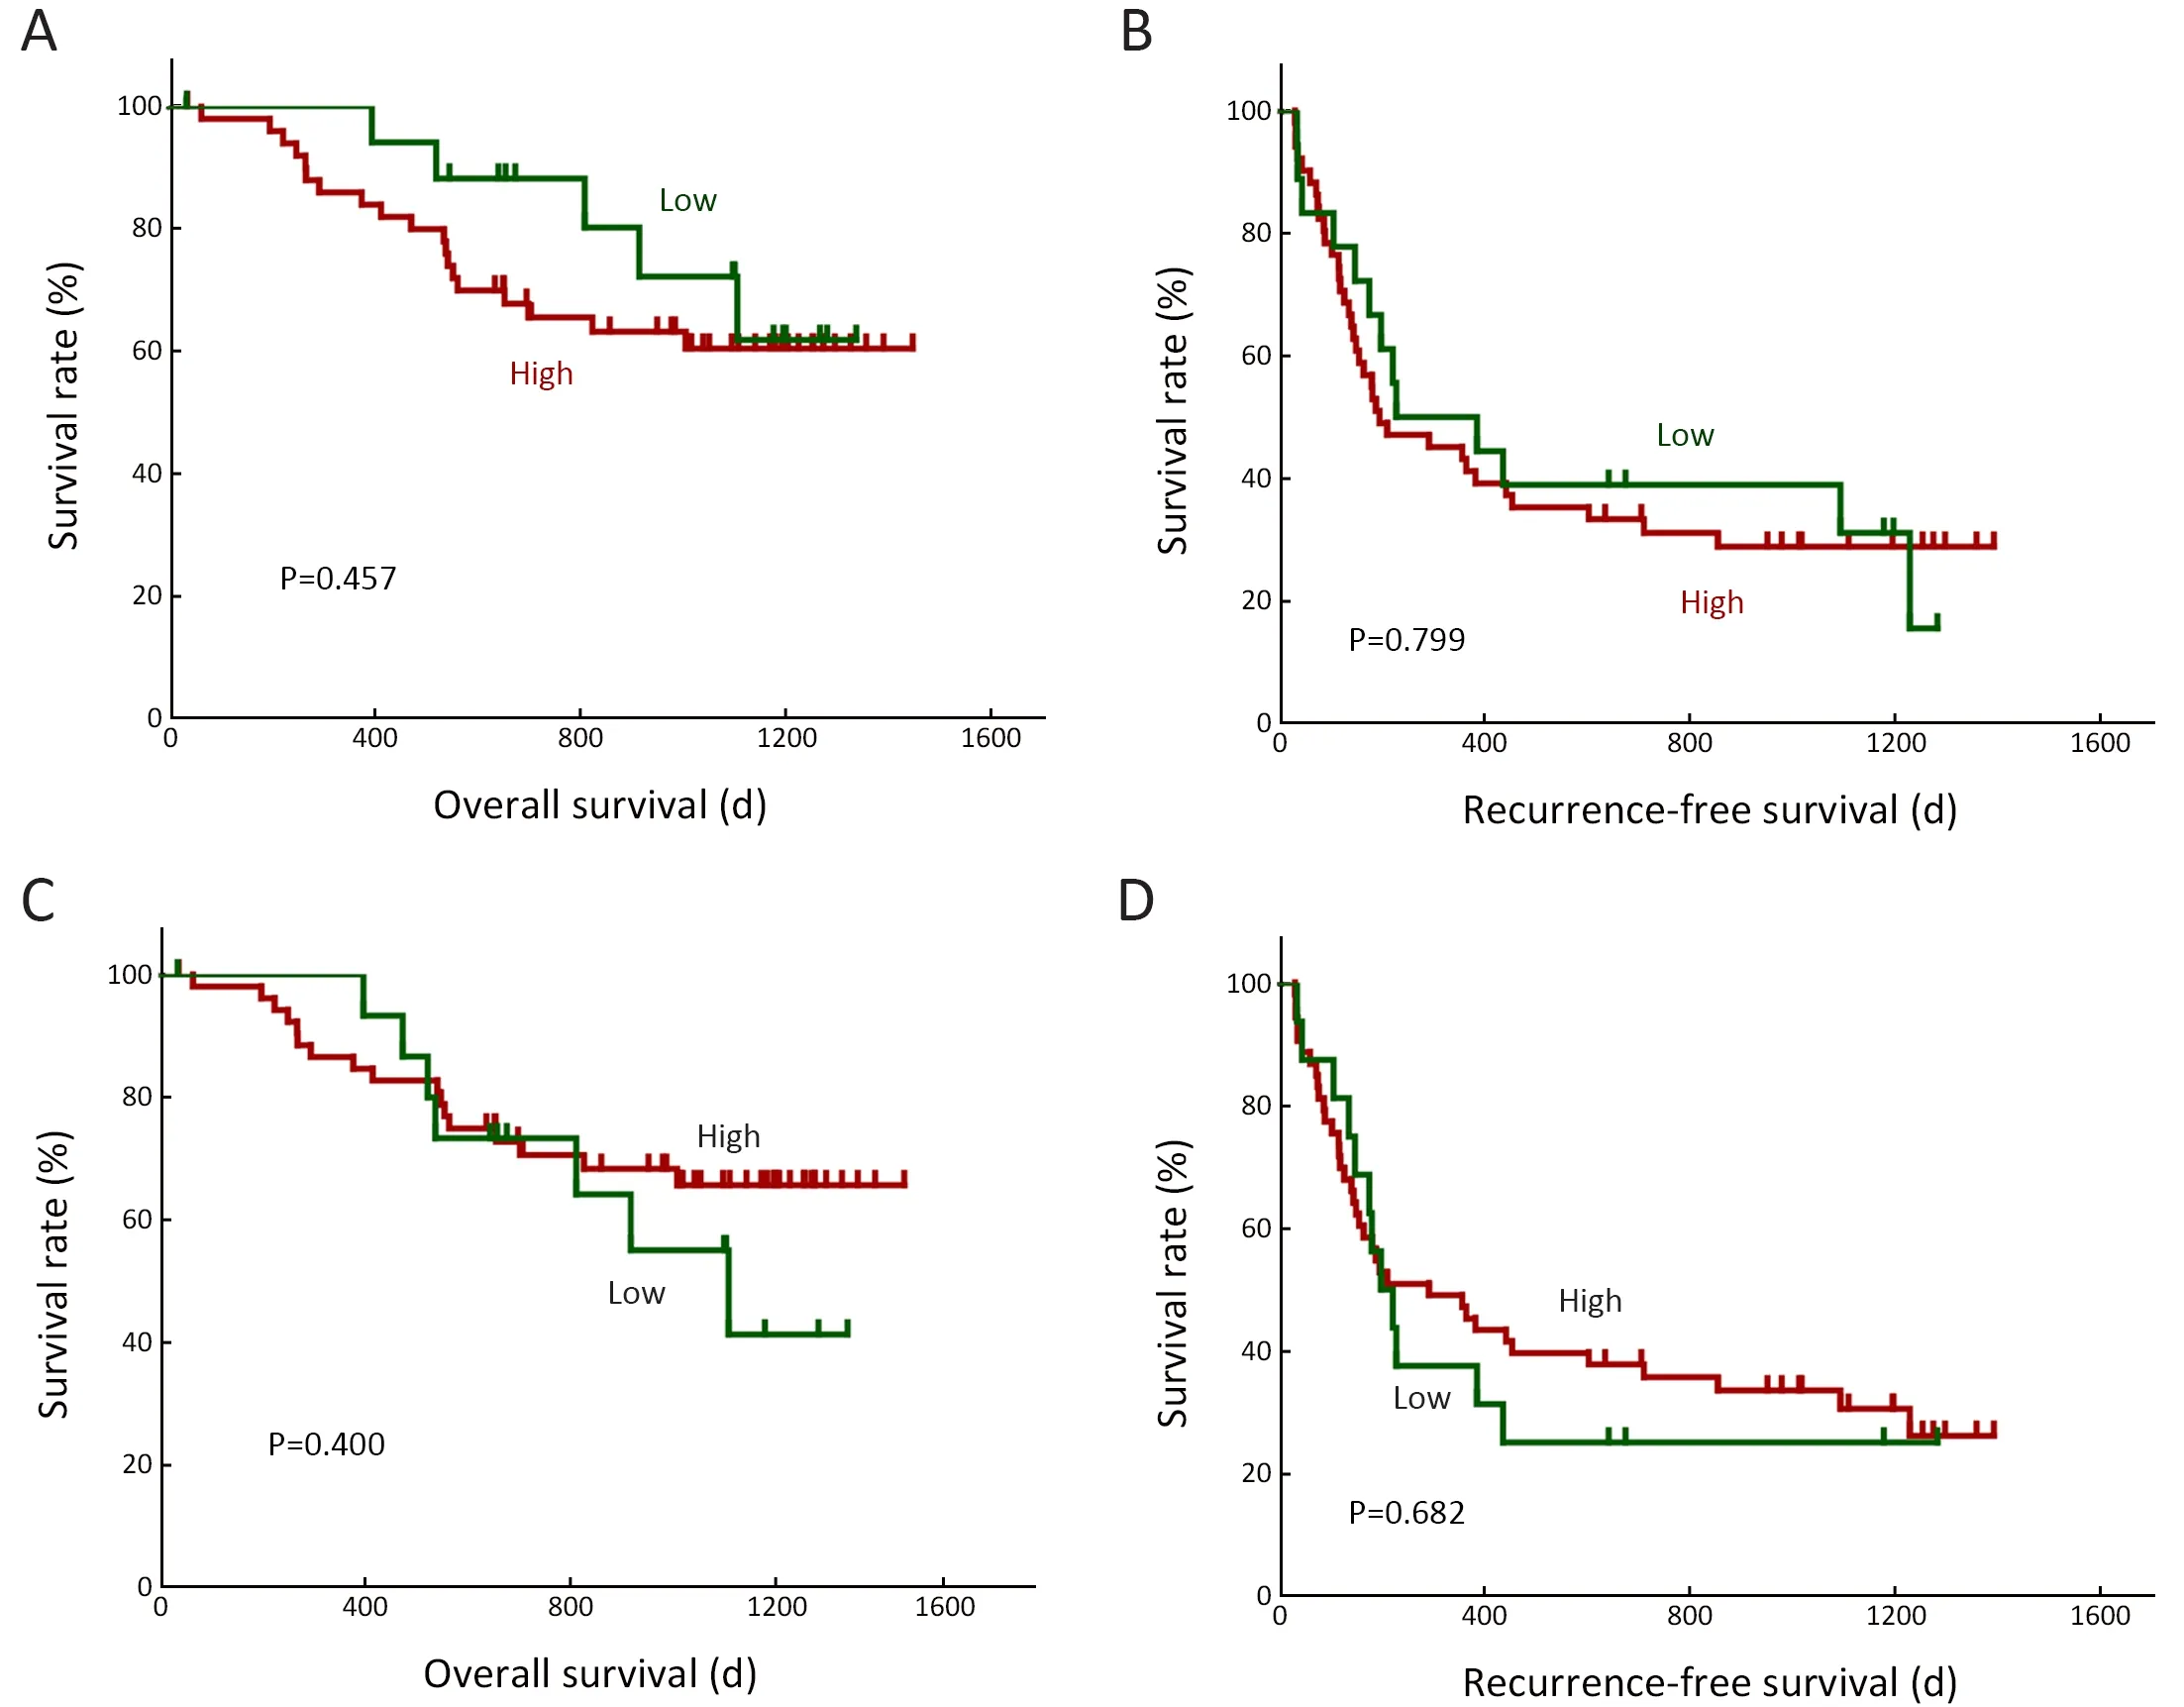
Figure S3 Associations between HCC RNA editing and HCC prognosis.Kaplan-Meier curves of OS and RFS for patients stratified by HCC RNA editing sites (A,B) and corresponding neoantigens (C,D).HCC,hepatocellular carcinoma;OS,overall survival;RFS,recurrence-free survival.

Figure S4 Associations between loads of HCC somatic mutation/neoantigen and patients’ clinical characteristics.HCC,hepatocellular carcinoma;BCLC,Barcelona Clinic Liver Cancer.

Figure S5 Density plot of expressed neoantigens.The red dash line represents the median of the expressed neoantigens.

Figure S6 Difference of expressed neoantigen proportion between subgroup NEP-H and NEP-L (P<0.001). NEP,neoantigen expression probability.

Figure 6 Neoantigens and driver mutations.(A) Waterfall plot summarizing the distribution of the top 30 neoantigenic hotspot genes in HCC patients.Driver genes identified by DriverDB/MutsigCV were marked with “+”;(B,C) ORs and 95% confidence intervals of driver mutations to be categorized as clonal mutations (B) and to be neoantigens (C);(D) Differences of neoantigens derived from driver genes between NEP-H and NEP-L subgroup;(E) Neoantigenic hotspot genes preferentially occurred in tumors with clonal evolution as well as NEP-L subgroup.HCC,hepatocellular carcinoma;OS,overall survival;NEP-H,neoantigen expression probability high;NEP-L,neoantigen expression probability low.

Figure S7 Correlation between MYC and PD-1 expression.Scatterplot showing correlation between MYC expression level and PD-1 expression level in both HCC tumor (R2=0.312,P=0.008) (A) and peritumor (R2=0.387,P<0.001) (B) tissue based on RNA-seq data.

Figure S8 Tumor with and without clonal evolution.Classification of tumor without clonal evolution (A) and tumor with clonal evolution(B) according to the mutation clusters.

Figure S9 Association between somatic mutations/neoantigens from different mutation clusters with HCC prognosis.(A,B) Kaplan-Meier curves of OS (P<0.001) (A) and RFS (P=0.018) (B) for patients stratified by clonal mutation load;(C) Kaplan-Meier curves of RFS for patients stratified by clonal neoantigen load (P=0.052);(D,E) Kaplan-Meier curves of OS (P=0.222) (D) and RFS (P=0.466) (E) for patients stratified by subclonal mutation load;(F) Kaplan-Meier curves of RFS for patients stratified by subclonal neoantigen load (P=0.038);(G,H)Kaplan-Meier curves of OS (P=0.012) (G) and RFS (P=0.047) (H) for patients stratified by background mutation load;(I) Kaplan-Meier curves of RFS for patients stratified by background neoantigen load (P=0.004).HCC,hepatocellular carcinoma;OS,overall survival;RFS,recurrence-free survival.

Figure S10 Association between clonal evolution and proportion of expressed neoantigens.Difference of expressed neoantigen proportion(P<0.001) (A) and neoantigen-expressing probability score (P<0.001) (B) between tumors with and without clonal evolution.

Figure S11 Association between background mutations/neoantigens and immune cell infiltration.The differences of somatic background mutation load (P<0.001) (A) and background neoantigen load (P<0.001) (B) between immunologically hot and immunologically cold tumors.
Discussion
Based on our identified neoantigen profiles,we discovered two clinically relevant subgroups with distinct neoantigen expression patterns.Previous studies have demonstrated that the abundance of neoantigens could greatly influence tumor phenotypes and prognosis,while we further explored the different factors underlying neoantigen expression,showing that the neoantigen expression pattern could represent an integrated status sculpted by tumor neoantigen,immune environment and tumor clonal evolution.Mutation accumulation during early stage of tumor development could largely determine the initial pattern of interaction between tumor and immune microenvironment,while this interaction continuously change along with tumor clonal evolution.Different biological pathways such as MYC activation and DNA damage repair could contribute to the intricate dynamics,resulting in different tumor phenotypes and prognosis.Thus,the neoantigen expression pattern could provide a different view than the abundance of neoantigens,which could be utilized in future clinical applications.
It is known that tumor could evolve to encounter attack of immune system.In our analysis,we discover an immune escape mechanism that tumors could become more inconspicuous by evolving subclones with less immunogenicity.Consistently,an evaluated level of immunoediting in subclone mutations compared with clonal mutations was also suggested by a recent study of lung cancer (8).Furthermore,we also observed that ancestral clones with lower number of mutation accumulation,but higher immunogenicity were more likely to involve in clonal evolution,indicating that tumors with less competitive ancestral clones might be more likely to evolve more competitive subclones under immune pressure.
Considering the success of neoantigen-based treatment in some cancers (6,7) and recent demonstration of immunogenicity of the frequent driver mutations (45),a series of neoantigenic hotspot genes observed by our study could be potential actionable targets for HCC in future.Meanwhile,we also discovered that driver gene neoantigen distribution is closely related to tumor clonal evolution and neoantigen expression patterns,which suggested that driver gene mutation accumulation could also play key roles in the interaction between tumor cells and microenvironment.
From a clinical perspective,the differentially characterized neoantigen expression subgroups could greatly help future immunotherapeutic interventions in HCC,for patients in each group have shown distinct clinical outcomes and immune microenvironment.Considering its immune suppression phenotype and evaluated proportion of expressed neoantigens,NEP-H subgroup might be more fitting to receive immune checkpoint blockade treatment,which can relieve immunosuppression and then facilitate neoantigeninvolved antitumor response.NEP-L subgroup,with higher driver gene neoantigen burden and better prognosis after surgery,might better benefit from surgery accompanied by neoantigen vaccines based on customized driver mutation panels.Furthermore,with the classification system reflecting an integrated status of HCC tumor contributed by driver mutation accumulation,immune environment and clonal evolution,how such status might change during patients’ clinical course is also worth further investigation,for it might shed light on the development of novel strategies that could better benefit patients’prognosis.
Conclusions
Our results demonstrated that neoantigen-directed tumor evolution indeed took place in HCC,which resulted in two clinically relevant subgroups with distinct neoantigen expression patterns.Different mechanisms contributing to the generation of these two subgroups suggested that the neoantigen expression patterns should be fully evaluated in future immunotherapeutic interventions.
Acknowledgements
This study was supported by the National Science and Technology Major Project of China (No. 2018ZX 10302205),the Scientific Foundation of Fujian Province(No. 2018J01145,No. 2020J011171),the Scientific Foundation of Fujian Health and family planning Department (No.2019-ZQN-87),and the Joint Funds for the Innovation of Science and Technology of Fujian Province (No.2018Y9121).
Footnote
Conflicts of Interest:The authors have no conflicts of interest to declare.
 Chinese Journal of Cancer Research2021年3期
- Chinese Journal of Cancer Research的其它文章
- Chinese Society of Clinical Oncology (CSCO) diagnosis and treatment guidelines for malignant lymphoma 2021 (English version)
- Mitochondrial malic enzyme 2 promotes breast cancer metastasis via stabilizing HIF-1α under hypoxia
- Psychosomatic symptoms affect radiotherapy setup errors in early breast cancer patients
- Reappraise role of lymph node status in patterns of recurrence following curative resection of gastric adenocarcinoma
- Pain threshold,anxiety and other factors affect intensity of postoperative pain in gastric cancer patients:A prospective cohort study
- A male-ABCD algorithm for hepatocellular carcinoma risk prediction in HBsAg carriers