
Prognostic value of a modified Immunoscore in patients with stage I-III resectable colon cancer
2021-07-30 08:53KeZhaoXiaomeiWuZhenhuiLiYingyiWangZeyanXuYajunLiLinWuSuYaoYanqiHuangChanghongLiangZaiyiLiu
Ke Zhao,Xiaomei Wu,Zhenhui Li,Yingyi Wang,Zeyan Xu,Yajun Li,Lin Wu,Su Yao,Yanqi Huang,8,Changhong Liang,Zaiyi Liu
1Department of Radiology,Guangdong Provincial People’s Hospital,Guangdong Academy of Medical Sciences,Guangzhou 510080,China;2School of Medicine,South China University of Technology,Guangzhou 510006,China;3Department of Radiology,the Sixth Affiliated Hospital of Sun Yat-sen University,Guangzhou 510655,China;4 Department of Radiology,the Third Affiliated Hospital of Kunming Medical University,Yunnan Cancer Hospital,Yunnan Cancer Center,Kunming 650118,China;5Department of Radiology,Zhuhai People’s Hospital,Zhuhai Hospital Affiliated with Jinan University,Zhuhai 519000,China;6Department of Pathology,the Third Affiliated Hospital of Kunming Medical University,Yunnan Cancer Hospital,Yunnan Cancer Center,Kunming 650118,China;7Department of Pathology,Guangdong Provincial People’s Hospital,Guangdong Academy of Medical Sciences,Guangzhou 510080,China;8 the Second School of Clinical Medicine,Southern Medical University,Guangzhou 510080,China
Abstract Objective:The Immunoscore method has proved fruitful for predicting prognosis in patients with colon cancer.However,there is still room for improvement in this scoring method to achieve further advances in its clinical translation.This study aimed to develop and validate a modified Immunoscore (IS-mod) system for predicting overall survival (OS) in patients with stage I-III colon cancer.Methods:The IS-mod was proposed by counting CD3+and CD8+immune cells in regions of the tumor core and its invasive margin by drawing two lines of interest.A discovery cohort (N=212) and validation cohort (N=103)from two centers were used to evaluate the prognostic value of the IS-mod.Results:In the discovery cohort,5-year survival rates were 88.6% in the high IS-mod group and 60.7% in the low IS-mod group.Multivariate analysis confirmed that the IS-mod was an independent prognostic factor for OS[adjusted hazard ratio (HR)=0.36,95% confidence interval (95% CI):0.20-0.63].With less annotation and computation cost,the IS-mod achieved performance comparable to that of the Immunoscore-like (IS-like) system(C-index,0.676 vs.0.661,P=0.231).The 2-category IS-mod using 47.5% as the threshold had a better prognostic value than that using a fixed threshold of 25% (C-index,0.653 vs.0.573,P=0.004).Similar results were confirmed in the validation cohort.Conclusions:Our method simplifies the annotation and accelerates the calculation of Immunoscore method,thus making it easier for clinical implementation.The IS-mod achieved comparable prognostic performance when compared to the IS-like system in both cohorts.Besides,we further found that even with a small reference set (N≥120),the IS-mod still demonstrated a stable prognostic value.This finding may inspire other institutions to develop a local reference set of an IS-mod system for more accurate risk stratification of colon cancer.
Keywords:Immunoscore;colon cancer;whole-slide image;overall survival;digital pathology
Introduction
Colon cancer is one of the leading causes of death in many countries (1).Although the tumor-node-metastasis (TNM)classification of the Union for International Cancer Control has set the foundation for the prognosis of patients with resectable colon cancer (2),the clinical prognosis can vary substantially across patients within the same stage.The recent demonstration of the prognostic performance of Immunoscore,a composite scoring system summarizing the density of CD3+and CD8+T-cell infiltration within the core of tumor (CT) and its invasive margin (IM),favours its implementation as a new component to the TNM staging to achieve better patient stratification (3-5).
However,before translating the Immunoscore system into routine clinical practice,a few issues remain to be addressed.Firstly,the Immunoscore calculation process requires pathologists to delimitate the entire tumor region on whole-slide images (WSIs),which is time-consuming.Moreover,given the very high resolution of WSIs (6,7),calculating the immune cell density for the entire tumor region is a computationally intensive task.Finally,the fixed thresholds (25% and 70%) of the Immunoscore used for patient stratification were determined on a study population of patients with certain heterogeneity (8-10).As the colon cancer incidence varies across countries,owing to variations in Human Development Index scores (1),the absolute thresholds for Immunoscore categorization may not be applicable to other populations.Therefore,there is still considerable room for the fine-tuning of the Immunoscore regarding its generation and categorization to achieve further advances in its clinical translation.
Therefore,we performed this study to propose a modified Immunoscore (IS-mod) system to facilitate rapid annotation and generation and determine whether the ISmod system could achieve accurate survival prediction in patients with resectable colon cancer.We further investigated how many samples would be needed as a reference set to establish an effective IS-mod system.
Materials and methods
Patients
Two cohorts of patients with stage I-III colon cancer were enrolled (Figure 1A).Patients in the discovery cohort were enrolled from Guangdong Provincial People’s Hospital(GDPH,Mar 2009 to Dec 2014).Patients from Yunnan Cancer Hospital (YCH,Jan 2009 to Dec 2014) served as the validation cohort.Exclusion criteria were neoadjuvant therapy (radiotherapy,chemotherapy) and death within 30 d of surgery.This retrospective study was approved by the Institutional Review Board at both institutions.Clinicopathological information,including age at diagnosis,sex,TNM classification,and anatomic site,was obtained from the medical records archives.The primary endpoint was overall survival (OS),which was defined as the date of the surgery until death.Patients who were still alive at the last followed date were labelled as censored data.
Immunohistochemical staining
The most invasive part of the primary tumor was chosen from the Paraffin tissue block from each patient by a pathologist who was blinded to patient clinical information and outcome (8,11,12).Two 4-μm sections,containing both tumor region and invasive margin,were cut from the block for immunohistochemistry.Several steps were taken:deparaffinage,antigen retrieval solution (using 10×concentrate solution,Novocastra,Leica) and primary[human anti-CD3 (Gene Tech,Cat# GT200229) and anti-CD8 (Cat# GT211229) rabbit monoclonal antibodies] and secondary (rabbit-anti-mouse IgG,Bond Refine Detection Kit,Leica) antibodies,according to the manufacturer’s recommendations in a Ventana BenchMark automated staining system. Finally,sections were subsequently incubated with 3,3-Diaminobenzidine,counterstained with hematoxylin,and mounted with special glue.Internal positive control was used for quality assurance.The stained tissue sections were imaged using a digital Whole Slide Scanning system (Leica,Aperio-AT2,USA) at 40×magnification.
IS-mod generation
We established the IS-mod system based on the method previously described (8),with a certain fine-tuning steps as hereby.The ImageScope software (Version 12.4.3;Leica Biosystems,Wetzlar,Germany) was used for image annotation.The annotation procedure was blinded to patient clinical information and outcome.On each CD3-stained WSI,one line was drawn at the tumor invasive margin (LineIM),and another line with a similar length was drawn at the core of tumor (LineCT).Subsequently,two regions of interest (ROIs) were automatically generated by expanding 2,400 pixels (at 40× magnification) outwards with both lines as the center line in each case (Figure 1B).Next,in both ROIs,a self-developed software (based on MATLAB R2018a,MathWorks,USA) was used to count the CD3-positive cells (Figure 1C).Next,the mean densities of positive cells in the CT and IM regions were calculated.The same procedure was performed for each CD8 image.
The distribution of immune cell density in the reference set (the discovery cohort) and the quantile of each patient were calculated (Figure 1D).Hence,four quantiles (CD3IM,CD3CT,CD8IM,and CD8CT) were obtained,and the average of these four quantiles was calculated to obtain the IS-mod (percentile).According to the IS-mod (percentile)distribution in the reference set,patients were divided into three categories (high/intermediate/low) to obtain a 3-category IS-mod.Similarly,a 2-category IS-mod(high/low) was obtained according to a two-level threshold.These thresholds were determined in the reference set to balance the proportion of patients in each category (1:1:1 for high/intermediate/low,and 1:1 for high/low).
Immune cell counting and annotation consistency assessment
We randomly selected 100 image blocks from 20 WSIs in the discovery cohort to assess immune cells counting accuracy.These images were annotated by a pathologist(S.Y.) using ImageJ software (Version 1.51;NIH,USA) to get the ground truth.The interclass correlation coefficient(ICC) was calculated for the purpose of evaluating the consistency of the positive cell count (13).The Bland-Altman method was used to measure the agreement between the software and pathologist annotation (14).
As she drank she murmured: Oh! heaven, what am I to do? and the three drops of blood replied: If your mother only knew, Her heart would surely break in two
Also,we evaluated the consistency between different annotators.Thirty cases (60 WSIs) were randomly selected from the discovery cohort.Annotator 1 (S.Y.) and Annotator 2 (L.W.) independently annotated these images’CT and IM regions.The ICC was also used to evaluate the agreement between different annotators,and an ICC>0.85 was considered to indicate a high level of agreement.
Compared with the calculation process associated with the Immunoscore,we selected only a band-shaped ROI(Figure 1B) in the tumor region to calculate the immune cell density.To investigate whether the ROIs reflected the immune status of the tumor region,we randomly selected 100 patients from the discovery cohort.The whole tumor region was segmented for CD3-and CD8-stained WSIs.The density of positive cells in the entire tumor region was calculated using the same cell-counting software.A correlation analysis [Pearson correlation coefficient (r)] was performed to obtain the immune cell densities in the bandshaped ROI and the whole tumor region.
Prognostic value of IS-mod
For the 3-and 2-category IS-mod,the Kaplan-Meier method was used to analyze the survival curves.Log-rank statistics were used to test the differences in survival distributions.The Cox model was used to compute hazard ratio (HR) of IS-mod and other clinicopathological factors(age,sex,TNM stage,and tumor site) for OS in the two cohorts.A reference model was constructed based on independent clinicopathological factors in multivariate survival analyses.A full model was developed by combining IS-mod with independent clinicopathological factors to investigate the IS-mod’s incremental value for outcome prediction.
The performance of the IS-mod and the reference/full models was assessed using Harrell’s C-index,the timedependent area under the receiver operating characteristic curve (tAUC),and the integrated area under the receiver operating characteristic curve (iAUC) (15-17).The twotailed Student’sttest for dependent samples was used to compare the two C-indices (and two tAUCs),and the iAUCs were compared using a Wilcoxon rank-sum test for dependent samples (18).
Comparison of IS-mod system and Immunoscore-like (ISlike) system
As we used a modified annotation process,especially for the CT region,it was worth exploring whether the prognostic value of the IS-mod system is comparable to that of the Immunoscore system.After calculating the CD3+and CD8+cells densities in the segmented whole tumor region(the invasive margin densities were already calculated),an IS-like system was established that was very similar to the Immunoscore calculation process (8). Performance evaluation indexes,such as C-index and iAUC,were calculated for the IS-like system.
Sample size of reference set
To address how many samples of the reference set were needed to constitute an effective IS-mod system,we arranged patients in the discovery cohort according to time(date of surgery).Next,a series of reference sets were established by extracting patients at 10-patient intervals from the discovery cohort.These sets serve as references for immune cell density distributions.The IS-mod of each case in the two cohorts was calculated according to the reference set.C-indexes were calculated to reflect the trend in IS-mod prediction performance changes with the increase in sample size.
Statistical analysis
All statistical analyses were performed with R software(Version 3.6.1;R Foundation for Statistical Computing,Vienna,Austria) using the following packages:BlandAltmanLeh,irr,MASS,prodlim,rms,survcomp,survival,survminer,and timeROC.A P-value of <0.05 was considered statistically significant.
Results
Patients

Table 1 Distributions of demographic and clinicopathologic characteristics of colon cancer patients in two cohorts
Calculation and assessment of IS-mod
Compared with the previous Immunoscore annotationprocess (8),we used a faster annotation method.Instead of outlining the entire tumor region,we delineated two similar-length lines at the IM and CT regions on the WSIs.After counting the immune cells in the above two areas,we obtained mean density distributions of CD3IM,CD3CT,CD8IMand CD8CT.The 3-category IS-mod was calculated using 38.5% and 60.8% as thresholds.In the same way,the 2-category IS-mod was established based on a cutoff value of 47.5%.
Figure 2Ashows examples of the software-based segmentation and pathologist’s manual annotation results.Perfect concordance of the immune cell counting was observed between the software segmentation and the pathologist annotation [ICC=0.985,95% confidence interval (95% CI):0.973-0.991 for CD3;ICC=0.932,95%CI:0.884-0.961 for CD8;Figure 2B].Bland-Altman plots show good agreements between the software and the pathologist’s annotation (Figure 2C,D).After performing a consistency analysis for different annotators,we found that the interrater reliability indexes to be high (ICCs,0.864-0.951;Figure 3A).
We also performed a correlation analysis to investigate whether a band-shaped subset region could reflect the whole tumor region’s immune status.For CD3,a strong correlation was observed (r=0.81,P<0.001;Figure 3B).A similar result was also found for the CD8-stained WSIs(r=0.89,P<0.001;Figure 3C).
Prognostic value of IS-mod
Patients with a higher IS-mod had much longer survival.The 5-year survival rates for the low,intermediate,and high IS-mod groups were 58.3%,77.5%,and 88.4%,respectively (the unadjusted HR for highvs.low=0.28,95%CI:0.15-0.54,P<0.001;Figure 4A).For the 2-category ISmod,107 (50.5%) patients had a low IS-mod,and 105(49.5%) patients had a high IS-mod.The 5-year survival rates for the low and high IS-mod groups were 60.7% and 88.6%,respectively (the unadjusted HR for highvs.low=0.28,95% CI:0.16-0.49,P<0.001;Figure 5A).
Similar results were confirmed in the validation cohort.Survival rates at five years were recorded for 70.6% of patients with a low IS-mod,81.5% of patients with an intermediate IS-mod,and 96.0% of patients with the high IS-mod (the unadjusted HR for highvs.low=0.09,95% CI:0.01-0.70,P=0.021;Figure 4B).For the IS-mod with 2-level,62 patients (60.2%) were classified as the low IS-mod and 41 (39.8%) as the high IS-mod.The 5-year survival rates for the low and high IS-mod groups were 69.4% and 95.1%,respectively (the unadjusted HR for highvs.low=0.11,95% CI:0.02-0.46,P=0.003;Figure 5B).

Figure 2 Immune cell counting consistency analyses.(A) Examples of IHC (CD3 and CD8) image block (1,024×1,024 pixel2 at 40×magnification),pathologist annotation,and segmentation result;(B) Concordance of immune cells counting between automatic segmentation and pathologist annotation (CD3:ICC=0.985,95% CI,0.973-0.991;CD8:ICC=0.932,95% CI,0.884-0.961);(C) Bland-Altman plot for CD3+cells counting estimation;(D) Bland-Altman plot for CD8+cell counting estimation.The solid horizontal line is mean,the dashed line is zero,and the shaded regions are 95% CIs;IHC,immunohistochemical;ICC,interclass correlation coefficient;95% CI,95% confidence interval.

Figure 3 Consistency and correlation analyses.(A) CT and IM annotation consistency analysis (CD3CT:ICC=0.951,95% CI,0.899-0.976;CD3IM:ICC=0.898,95% CI,0.798-0.950;CD8CT:ICC=0.908,95% CI,0.815-0.955;CD8IM:ICC=0.864,95% CI,0.735-0.933);(B,C)Correlation analyses for immune cells CD3 (r=0.81,P<0.001) (B) and CD8 (r=0.89,P<0.001) (C) density in the whole tumor region and the band-shaped region.CT,core of the tumor;IM,invasive margin;ICC,interclass correlation coefficient;95% CI,95% confidence interval.

Figure 4 Kaplan-Meier curves analysis for 3-category IS-mod.(A) The discovery cohort (HR for high vs.low=0.28,95% CI,0.15-0.54,P<0.001);(B) The validation cohort (HR for high vs. low=0.09,95% CI,0.01-0.70,P=0.021).IS-mod,modified Immunoscore;HR,hazard ratio;95% CI,95% confidence interval.
Performance comparison of IS-mod and IS-like
Table 2lists performance of IS-mod and IS-like for predicting OS in the two cohorts.To avoid the influence of the cutoff setting,the continuous IS-mod and IS-like were used to compare performance.The C-indexes,AUCs at 5-year,and iAUCs were calculated.For both cohorts,the ISmod performed slightly better than the IS-like (0.676vs.0.661 in the discovery cohort;0.671vs.0.657 in the validation cohort),but the differences were not statistically significant (all P>0.05).Table 2also summarizes the predictive performance of the IS-mod,using different cutoff values.Compared with the IS-mod based on 25%and 70% as thresholds recommended in the previous study(8),the IS-mod based on the threshold determined by the reference set had better prognostic performance,especially for the 2-category IS-mod (P<0.05,Supplementary Table S1).
Incremental value of IS-mod
The IS-mod is an independent prognostic factor that can provide incremental value for predicting OS in patients with stage I-III colon cancer.After univariate and multivariate analyses (2-category IS-mod used only),we identified IS-mod,age,and TNM stage as independent predictors for OS (the adjusted HR=0.36,95% CI:0.20-0.63 in the discovery cohort;the adjusted HR=0.15,95% CI:0.03-0.67 in the validation cohort;Table 3).A reference model (TNM stage plus age) and a full model(reference model plus IS-mod) were developed.The full model showed better discrimination performance than the reference model (iAUC,0.775vs.0.746 in the discovery cohort; 0.788vs. 0.767 in the validation cohort;Supplementary Table S2;Figure 5C,D).

Table 2 Prediction performance of IS-mod (percentile),IS-like (percentile),3-category,and 2-category IS-mod in two cohorts
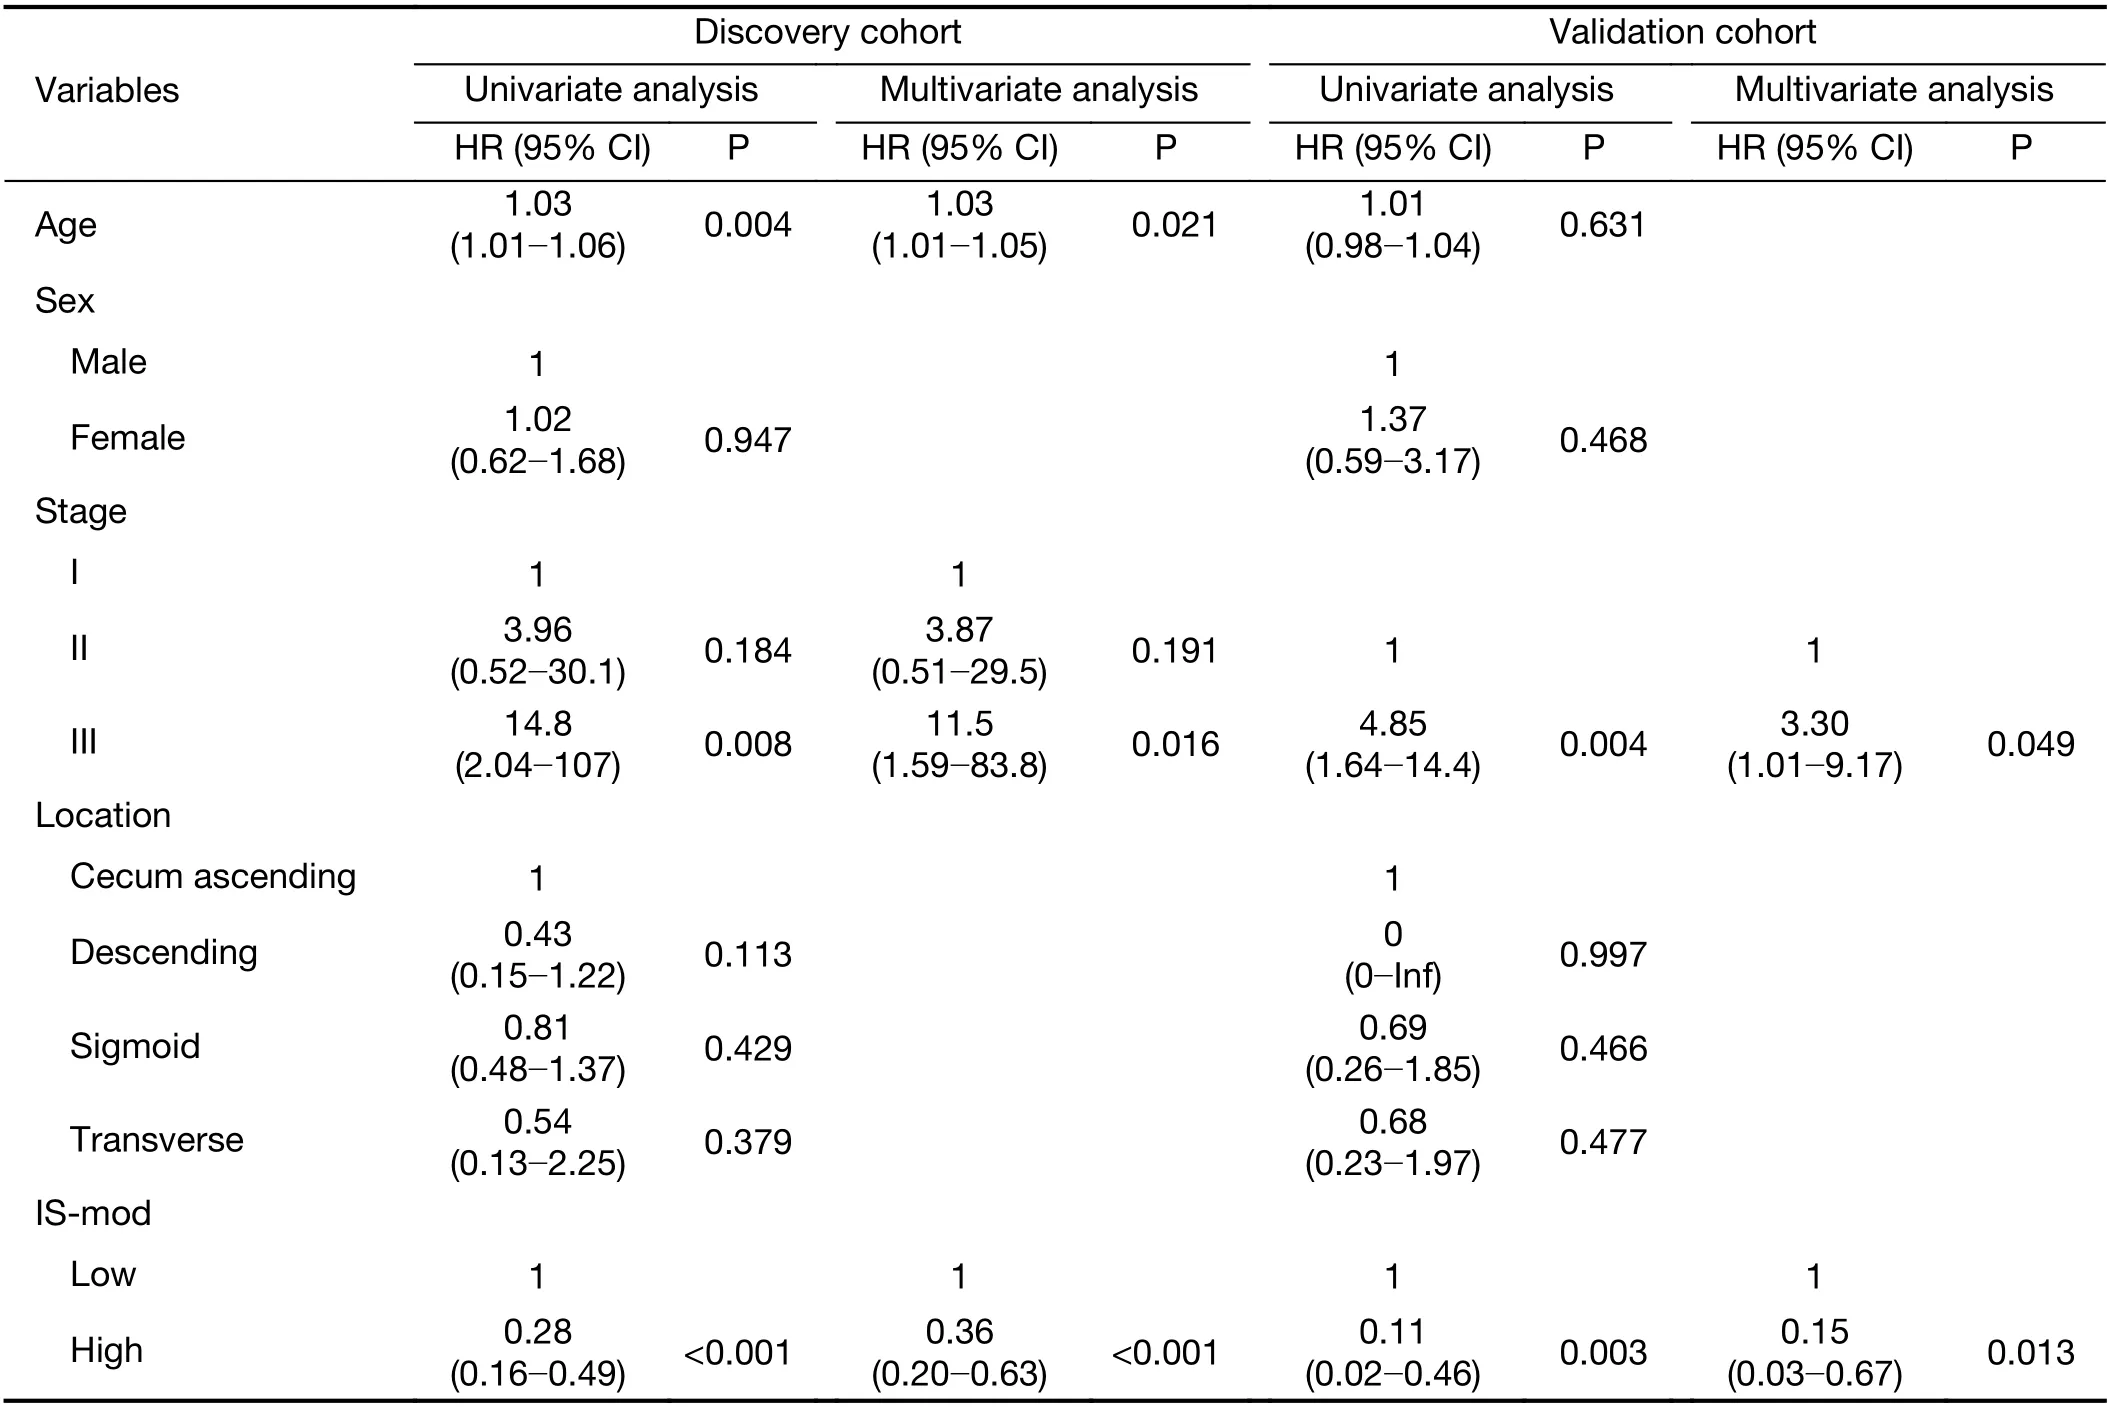
Table 3 Univariate and multivariate analyses in two cohorts
Sample size of reference set
The procedure for constructing the reference sets is shown inFigure 6A.We found that when the reference set’s sample size was small (N<70),the IS-mod’s predictiveperformance was unstable.However,with a sample size of more than 70 cases,the performance improved steadily in both cohorts.However,when the sample size increased to more than 120 cases,the performance tended to be stable(Figure 6B).

Figure 5 Kaplan-Meier curves analysis and performance of models.(A,B) Kaplan-Meier survival curves of overall survival of high vs.low IS-mod [(A) HR=0.28,95% CI,0.16-0.49;P<0.001;C-index=0.653,95% CI,0.597-0.710;(B) HR=0.11,95% CI,0.02-0.46;P=0.003;Cindex=0.666,95% CI,0.580-0.752];(C,D) Time-dependent AUC was measured from one month to five years at 1-month intervals,reflecting the performance of predicting overall survival at different timepoints.A reference model was developed with only TNM stage and age,and a full model (reference model+IS-mod) is shown compared with the reference model.Left panel:discovery cohort;Right panel:validation cohort.AUC,area under the receiver operating characteristic curve;TNM,tumor-node-metastasis;IS-mod,modified Immunoscore.

Figure 6 Sample size of reference set.(A) Patients in discovery cohort were arranged by time,and a series of reference sets were established by extracting patients at 10-patient intervals.The reference set serves as the immune cell density distributions reference.Patients in discovery cohort and validation cohort used the reference set to get the modified Immunoscore;(B) C-index values change with the increase of reference set sample size.Ref set,reference set.
Discussion
In this study,to pave the way for the clinical translation of the Immunoscore,we proposed an IS-mod system that could facilitate rapid annotation and calculation.The ISmod achieved comparable prognostic performance as the IS-like system in both cohorts.The scoring threshold we identified,based on the distribution of immune cell density in the discovery cohort,provided improved patient stratification for stage I-III colon cancer compared to the fixed,previously recommended threshold.We further demonstrated the validity of the IS-mod as an independent prognostic factor for patients with colon cancer from two centers.
With an improved understanding of the tumor-immune system interaction,ongoing studies are responsible for revolution in the field of oncology by revealing advanced immunological biomarkers that have proved fruitful for prognostication (3,19-21).A potential prognostic marker,the “Immunoscore”,has been established to quantify thein situimmune infiltrate by quantifying CD3-and CD8-positive T cells at both the CT and IM regions.Regarding the prognostic and predictive power,the Immunoscore has shown complementary and superior performance to the gold-standard TNM classification for the prediction of survival outcomes in colon cancer.Despite these encouraging results,additional work is required before the clinical implementation of the Immunoscore.Firstly,the 48% of discordance found when comparing the Immunoscore to hematoxylin and eosin-based optical tumor-infiltrating lymphocytes evaluation calls for automated evaluation to ensure reproducibility.Compared with the Immunoscore that previous research mentioned(8,22),the IS-mod we proposed could enhance such biomarker’s robustness and reproducibility.Firstly,instead of including the whole tumor region in WSIs,our annotation method merely requires the delimitation of two lines with a similar length.This method was expected to ensure a more balanced density estimation in the two regions (CT and IM),with a high consistency between pathologists observed in our ICC analysis.In this way,our method simplified the annotation process and accelerated the calculation time,paving the way to enhancing clinical implementation.Secondly,we conducted consistency analysis on immune cells counting between that estimated by the automatic segmentation and that manually annotated by the pathologist,which was necessary but omitted in previous studies (3,8,19,22-24).The interclass consistency analysis and Bland-Altman plots demonstrated good consistency in the immune cell counting between the automatic segmentation and pathologist’s annotation.
It is noteworthy that we used a simpler way of annotation,especially for the CT regions,where we drew a LineCTto calculate the immune cell density,rather than taking the entire tumor region into account,as with the Immunoscore.According to consistency analysis,the bandshaped ROI can strongly reflect the tumor’s overall immune status.Also,we compared the prognostic performance of the IS-mod and IS-like.We found that the IS-mod achieved comparable prognostic performance as the IS-like in both the discovery and validation cohorts.Simultaneously,our method only used a part of the whole tumor region to compute the immune cells density,thus speeding up the possibility of clinical implementation.
The IS-mod was established based on the distribution of immune cell density in this study’s discovery cohort.Different thresholds were used to obtain a 3-category(37.8% and 61.8%) and 2-category (47.5%) IS-mod.When stratified into three categories using the 25% and 70% as thresholds reported in a previous study (8),the IS-mod yielded a barely satisfactory OS prediction (Table 2,Supplementary Table S1).When considered as a 2-category biomarker,the IS-mod showed better prognostic value using the 47.5% threshold compared with using the reported 25% threshold (C-index,0.653vs.0.573,P=0.004).
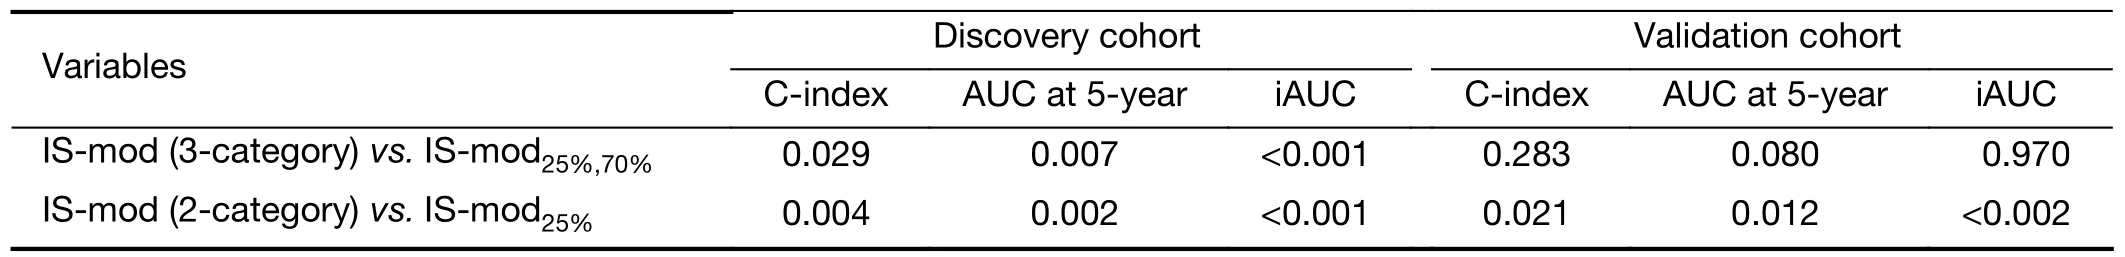
Table S1 P values for comparison of IS-mod (3-and 2-category) and IS-mod using 25% and 70% as thresholds
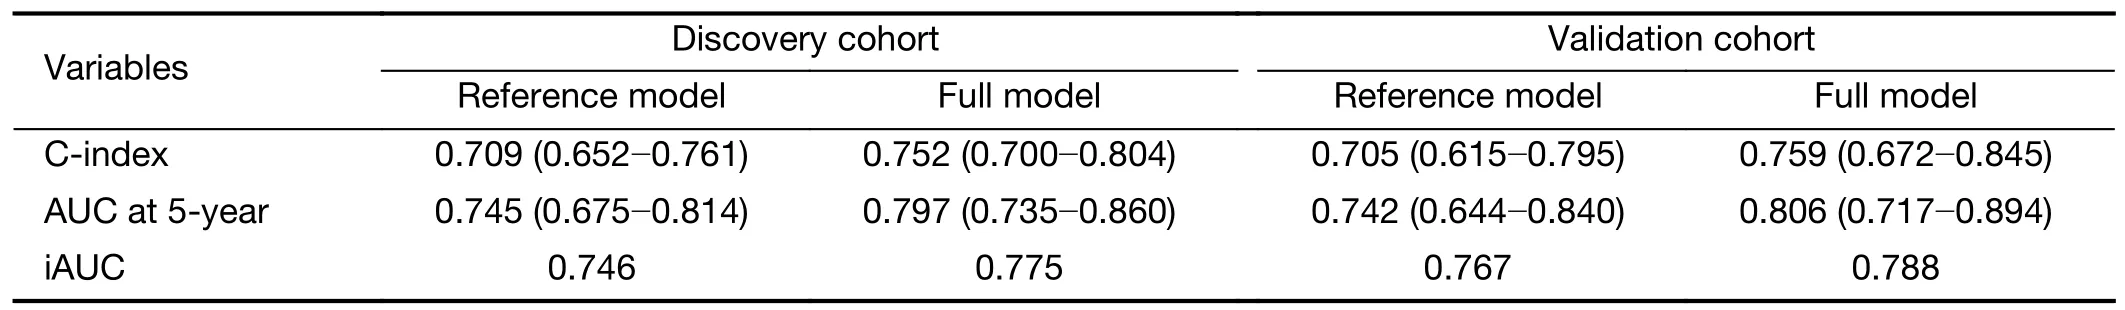
Table S2 Discrimination ability of the reference and full (reference model+IS-mod) models in two cohorts
Interestingly,our results also showed that the reference set of an IS-mod system might not require thousands of samples.Using a small data set (N≥120) as the reference set,as shown in our results,the IS-mod was demonstrated to be useful in predicting survival.The result suggests that an IS-mod system could be established based on comparably limited reference data sets in each institute,ensuring its feasibility in real clinical practice.
This study’s limitations included the relatively small sample size in both cohorts and the retrospective nature of the data collection.Besides,to validate our proposed approach,a publicly available CD3-and CD8-stained WSI data set for colon cancer are currently lacking.Moreover,it is necessary to develop deep learning-based automated analysis software,reducing pathologists’ workload one step further.
Conclusions
We supplied evidence of a scoring system’s prognostic potential that relies on quantifying lymphocyte populations to guide patient stratification in colon cancer. We established a modified Immunoscore system that will enhance reproducibility and eased it in clinical practice through rapid annotation and calculation.Given the prognostic validity demonstrated by the proposed IS-mod,observation of our study also suggests that the reference set of a prognostic IS-mod system may not require thousands of samples.Our findings may encourage more tailored investigation using a reference dataset of patients from a more homogeneous population regarding ethnic background.
Acknowledgements
This work was supported by the National Key Research and Development Program of China (No.2017YFC 1309102),National Natural Science Foundation of China(No.81771912,No.82001986,No.82071892),National Science Fund for Distinguished Young Scholars (No.81925023),and High-level Hospital Construction Project(No.DFJH201805 and No.DFJH201914).
Footnote
Conflicts of Interest:The authors have no conflicts of interest to declare.
 Chinese Journal of Cancer Research2021年3期
- Chinese Journal of Cancer Research的其它文章
- Chinese Society of Clinical Oncology (CSCO) diagnosis and treatment guidelines for malignant lymphoma 2021 (English version)
- Mitochondrial malic enzyme 2 promotes breast cancer metastasis via stabilizing HIF-1α under hypoxia
- Psychosomatic symptoms affect radiotherapy setup errors in early breast cancer patients
- Reappraise role of lymph node status in patterns of recurrence following curative resection of gastric adenocarcinoma
- Pain threshold,anxiety and other factors affect intensity of postoperative pain in gastric cancer patients:A prospective cohort study
- A male-ABCD algorithm for hepatocellular carcinoma risk prediction in HBsAg carriers