
Synthesis, Electrical and Dielectric Properties of Ca-doped SrTiO3 Ceramics
2021-09-10 07:22AliMaterMassoudKahlaouiAbdewahebInoubliChaabaneChefi
Ali Mater Massoud Kahlaoui Abdewaheb Inoubli Chaabane Chefi
Abstract
CaxSr1-xTiO3 (CxST; x=0.2 and 0.4) powders were elaborated by conventional solid state reaction. Structural and electrical properties were influenced by the Ca2+ doping content. Structural and microstructures properties of the obtained powders were conducted by X-ray diffraction and scanning electron microscopy. The powder were pressed to eight tons into cylindrical pellets and sintered at 1300°C for 3h. The electrical and dielectric properties were measured by two-probe method using HP 4192 Analyzer. The refinement of results showed that the samples were crystallized in the tetragonal with I4/mcm space group. The highest conductivity was shown for C0.2ST sample which equal to 1.21 x 10⁻⁴ S.cm-1 at 600 °C. The electrical and dielectric parameters were plotted and discussed as a function of temperature and frequency. These Ca doped perovskite ceramics materials can be used as possible candidate for a wide range of applications in various devices.
Keywords: Ca-doped SrTiO3; Solid state reaction; Perovskite; Conductivity; Permittivity
1. Introduction
Solid oxide fuel cells (SOFC) as one of the most fuel cells technologies has attracted much attention due to their advantages over conventional power generation systems, low pollution, high energy conversion efficiency (80%) and fuel adaptability [1]. But the main drawback for SOFC is the degradation of their components (electrolyte-electrode) as well as their high cost caused by its high operating temperature. To resolve these problems, some researcher lowering the operating temperature of SOFC without decreasing the performance of the cell. Therefore, it is necessary to replace the conventional anode materials by another with adequate performance. Perovskite with the general formula ABO3, exhibit an interesting electrochemical properties as a materials for anode in SOFC. Among the currently used ABO3 peroveskite, the strontium titanate SrTiO3 have attractive much attention as anode materials for SOFC. It can be seen in previous works that the doping by aliovalent substitutions in the A sites of SrTiO3 was effective in improving the catalytic activity, the electrical conductivity and optimize the thermal compatibility [2, 3].
This work aimed to prepare calcium strontium titanate perovskite as an SOFC anode material candidate.The structure of the perovskite and its electrical properties were investigated to reveal the influence behavior of the calcium amount on the structure and the electrical properties. In addition, the temperature dependence of the dielectric properties of the synthesized perovskites was studied.
2. Experiment
The CaxSr1-xTiO3 (x=0.2 and 0.4) powders were prepared by the conventional solid state reaction method following the process described in our previous work [4]. High pure chemicals precursors such as calcium carbonate (CaCO3, 99.95 %), strontium carbonate (SrCO3, 99.9 %) and titania (TiO2/anatase, 99.97 %) from Sigma Aldrich were mixed and ground with ethanol in agate mortar, after that the ground powders were calcined at 1,500 °C for 3 h to obtain the phase. The identification of phases was carried out using a Bruker D-8 advance x-ray diffractometer (CuKα =1.540 ?). The diffraction patterns were collected by step scanning for 2θ=20°–90° with a step size of 0.05°. The crystalline phase and cell parameters were measured by the PANalyticalXPert High Score Plus program usig method of Rietveld.
The morphology of the cylindrical pellets sintered at 1300°C for 3h were characterized by scanning electron microscope (SEM), JEOL.JSM-5400.
Complex impedances spectroscopy were measured by two electrode in a frequency range between 5 Hz and 13MHz with a signal amplitude of 0.5V. All measurements were carried out at equilibrium potential at temperatures from 250 ?C to 800 °C. The obtained impedance spectra were then analyzed by the Zview software.
3. Results and Discussion
3.1. Structural and microstructural characterization
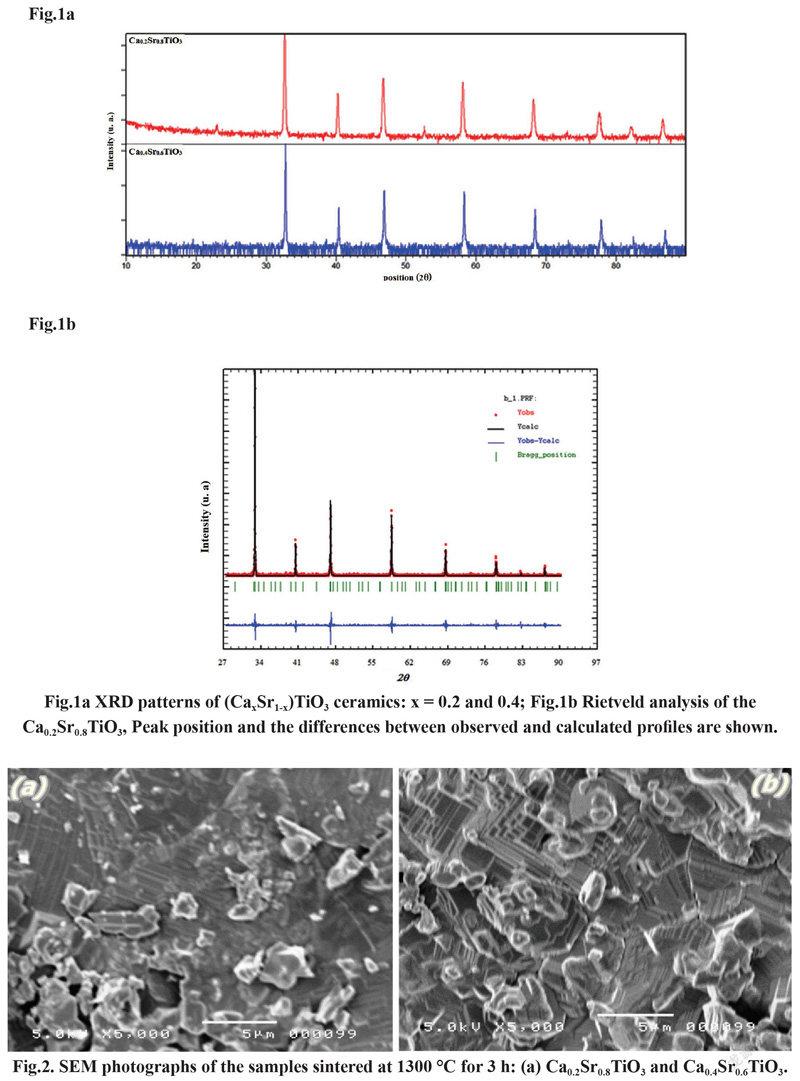
Fig.1a display the XRD patterns of the CaxSr1-xTiO3 (x=0.2 and 0.4) (CxST) solid solutions which were prepared via the solid state reaction method. It can be clearly seen that the Ca0.2Sr0.8TiO3(x=0.2) powder is single-phased with a tetragonal system and I4/mcm space group (ICSD powder diffraction file No. 23076). And no impurity or secondary phases were detected in all samples. The lattice parameters were found to be a = b = 5.4967 ? and c = 7.7843 ?. It can also be seen that the Ca0.4Sr0.6TiO3(x=0.2) powder is single-phased with an tetragonal system and (I4/mcm) space group. The calculated lattice parameters are a = 5.4763, b = 5.4763 ? and c = 7.722 ?. These results are in good agreement with the work of Qun Hui et al.[5]. The fitting of the XRD pattern of the C0.2ST is shown in Fig.1b. Final R-goodness factors were Rp= 1.366, Rwp= 1.840, and χ (chi2) = 0.349.
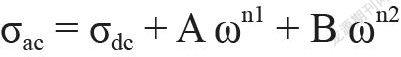
The morphology of the CxST (x=0.2 and 0.4) pellets sintered at 1300 °C for 3h is shown in Fig.2. It can be seen from the Fig.2 a porous (Ca0.2Sr0.8)TiO3 and (Ca0.4Sr0.6)TiO3 pellets with a continuous and open pores. The average size of the grains was found to be less than 2.5 microns.
3.2. Electrical and dielectric characterization in air
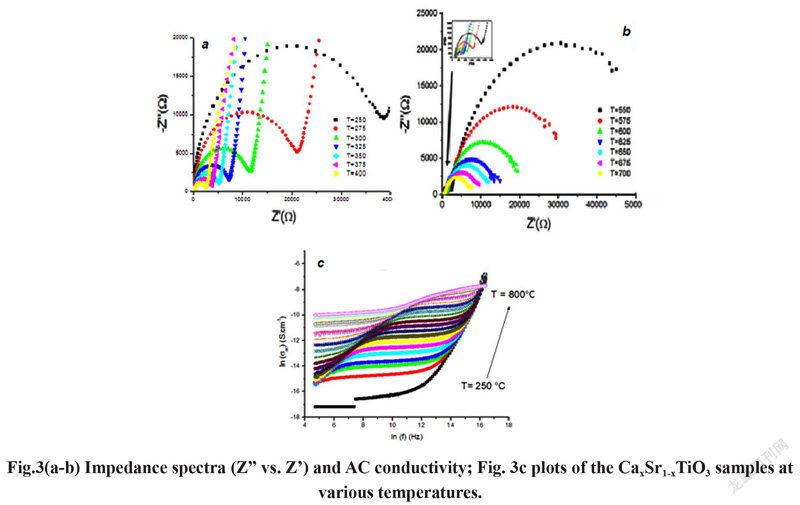
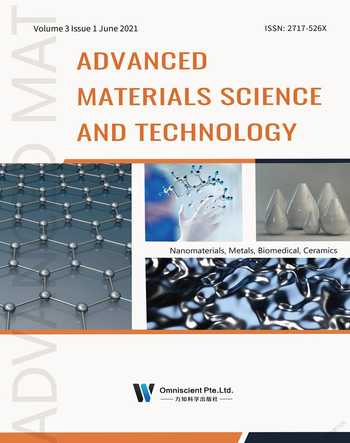
Fig.3(a-b) shows an example of an Nyquist Plot of C0.4ST measured at a range temperatures from 250°C to 800°C. The Nyquist Plot at temperatures between 250°C and 400°C is characterized by the appearance of a small oblique line at low frequency attributed to the response of the electrode followed by semicircular arcs related to the response of the grain in the high frequency domain. At high frequencies the semi-circle is characterized by a parallel combination of a resistor R and a volume capacity C, while at low frequencies the straight line represents a capacitive effect on the interface electrode-electrolyte. This effect is referred to as double layer capacitance (Cdl) [6, 7]. The variation of impedance spectrum as function of temperature showed that only one depressed arc clearly observed at the temperature range from 250 to 400°C which indicate the presence of single electrical relaxation phenomena due to the statistical distribution of relaxation times [8, 9]. As shown in Fig.3b the complex impedance spectrum of CST was measured at temperatures from 550°C to 700°C and comprises two semicircular arcs attributed to grain and grain boundary contributions. The contribution of high and intermediate frequencies arcs are superposed. These semicircles can be represented by an equivalent circuit with two parallel RC elements arranged in series. Fig. 3c shows the variation of the ac conductivity (σac) versus frequency at different temperatures. From these figures, it can be concluded that the variation of conductivity versus frequency shows four distinct regimes within the measured frequency window limit:i) two plateaus and ii) two asymptotic regimes[10, 11]. In order to fitting the dispersion region of the ac conductivity the Jonschers law [12] was used the following equation:
where A and B are temperature-dependent constants, both n1(T) and n2(T) are two almost temperature-independent parameters and are close to unity, and σdc is the static conductivity. The conductivity in the plateau region (“stationary regimes”) (low frequency region f < 1000 Hz and in the intermediate frequency region) is virtually constant and independent of frequency. This region corresponds to the static conductivity which increases with temperature and is due to the disorder of cations between neighboring sites [13]. In the (103Hz < f < 104 Hz) frequency region (“asymptotic regimes”), the variation of conductivity us function of frequency is due to the polarization effects between electrode- electrolyte interfaces [13].It is observed that the high frequency region (“asymptotic regimes”) is closer to the relaxation times and the mobility of the charge carriers is high, therefore, the conductivity increases with frequency [13, 14].
Activation energies (Ea) for the conduction process were extracted to the conductivity data of the Arrhenius relation using the equation below [15,16]:
where T, σ, A0, K and Ea are the absolute temperature, conductivity, pre-exponential factor, Boltzmann constant and activation energy, respectively. Fig. 4 display the variation of log σT vs 1000/T for the total conductivity, the grain interior and the grain boundary conductivities of the Ca0.2Sr0.8TiO3 and Ca0.4Sr0.6TiO3 samples sintered at 1300°C. At 475°C, the calculated total conductivity of the strontium calcium titanate sample is 1.21 x 10⁻⁴ S.cm-1 for x=0.2 and 1.26 x 10⁻⁴ S.cm-1 for x=0.4 at 600°C. The activation energy is calculated from the slope of the log σT vs 1000/T plot and it is found to be 1.03 and 0.79 eV for x=0.2 and 0.4 respectively for the total conductivity. It is clear that the value of the activation energy decreases with an increase in Ca content. The low activation energy value may be due to the ionized oxygen vacancies. However, the decrease in activation energy at higher temperatures is due to the attractive interaction between the dopant cations and oxygen vacancies. The σdc values for the compounds at each temperature can be directly obtained from the conductivity data shown in Fig.3c, as the conductivity value in the low frequency plateau (dc plateau) and the static conductivity, σdc, increase with the variation of temperature, and this indicates the thermally activated process of electrical conduction in the material. The activation energy value estimated from the Arrhenius plot of σdcwith respect to 103/T is 1.23eV and 0.63 eV for Ca0.2Sr0.8TiO3 and Ca0.4Sr0.6TiO3,respectivelyatseveral temperatures between 648 and 923K (Fig. 4d).
Fig. 5a and d show the real part of the dielectric permittivity vs log ω for the compositions of the CST at several temperatures between 250°C and 800°C. These were calculated from the measured impedance data, Z & Z”, and the pellet dimensions. The variation of the ? as a function of angular frequency in the 250°C – 500°C temperature range (Fig. 5a) has been observed to decrease with increasing frequency and attains a constant value at high frequencies. At high frequencies, ? remains constant; this is due to a rapid polarization processes with no ionic motion contribution. At lower frequencies the variation of the dielectric constant ? indicates a dispersive behavior due to the contribution of polarization arising from the charge accumulation at the interface and leads to the polarization of the ionic materialwhich results in the formation of a space charge region at the electrode-electrolyte interface [17, 18]. The value of the dielectric constant ε increases with increasing temperature. For intermediate frequencies it has been observed that the plateau region (Fig. 5b) is shifted towards higher frequencies with increasing temperature. The loss tangent (δ) varies with angular frequency at selected temperatures between 250°C and 675°C, as shown in Fig.5c. Loss peaks are observed to move towards higher frequencies when increasing the temperature. These peaks suggest a dielectric relaxation phenomenon in the material. Generally, the dielectric losses can be provoked by charge defects. At lower frequencies these peaks can be attributed to the contribution of all the grain boundaries. In Fig.5d two peaks are observed and shift towards higher frequencies with temperature. This can be attributed to the gradual decrease inresistance with increasing frequency. At lower frequencies these peaks can be attributed to the contribution of all the grain boundaries, but at high frequencies these peaks are attributed to the contribution of the grains [19, 20].
4. Conclusion
Calcium strontium titanates CaxSr1-xTiO3 (x=0.2 and 0.4) were synthesized via the solid state method. The samples obtained show a perovskite structure that changes from quadratic to orthorhombic. Increasing the temperature the contributions attributed to the bulk and grain boundary response were observed, as well as temperature-dependent relaxation. At 475°C for x=0.2 and 600°C for x=0.4, the best conductivities for the CST pellet are1.21 x 10-4 S.cm-1 and 1.26 x 10⁻⁴ S.cm-1 respectively. The CST conduction activation energy is calculated to be 0.79 eV for x =0.4 and 1.03 eV for x=0.2 in the 500––700°C temperature range. In view of the above, CST can be considered as a anode material for SOFCs, but its conductivity needs to be improved.
Acknowledgements
This work was supported by the Ministry of Higher Education and Scientific Research of Tunisia. The author would also like to thank the language expert Nayua Abdelkefi for proofreading the manuscript.
Conflict of Interest
The authors declare that they have no conflict of interest.
References
[1]M.Q. Nguyen J. Am. Ceram.Soc.76 (3) (1993) 563.
[2]D.P. Fagg, V.V. Kharton, J. R. Frade, A. A. L. Ferreira, Stability and mixedionic electronic conductivity of (Sr,La)(Ti,Fe)O3_d perovskites, Solid StateIonics156(2003)45–57.
[3]F. Gao, H. L. Zhao, X. Li, et al., Preparation and electrical properties of yttrium doped strontium titanate with B-site deficiency, Journal of Power Sources185(2008)26–31.
[4]QunHui, J. Phys: Condens. Matter 19 (11pp) (2007) 335214.
[5]M. Kahlaoui, A. Inoubli , S. Chefi, A. Madani ,C. Chefi, Ionics 20 (2014) 1729–1735
[6]H. X. Zhang, C. H. Kam, Y. Zhou, X. Q. Han, S. Buddhudu, Q. Xiang, Y. L. Lam, Y. C. Chan, Appl. Phys. Lett. 77 (2000) 609.
[7]A. Gedanken, R. Reisfeld, L. Sominski, Z. Zhong, Y. Koltypin, G. Panczer, M. Gaft, H. Minti, Appl. Phys. Lett. 77, (2000) 945.
[8]R.J. Grant, M.D. Ingram, L.D.S. Turner, C.A. Vincent, J. Phys.Chem. 82 (1978) 2838.
[9]J.R. Macdonald, Impedance Spectroscopy, Wiley, New York, 1987.
[10]X. Li, H. Zhao, W. Shen, F. Gao, X. Huang, Y. Li, Z. Zhu, J. Power Sources 166 (2007) 47–52.
[11]A. Shukla, R.N.P.Choudhary, Physica B 406 (2011) 2492–2500.
[12]A.K. Joncher: a) Nature, 256 (1977) 673, b) J.Mater.Sci., 16 (1981) 2037.
[13]J. Kawamura, S. Rikito, M. Shinya, M. Shimoji, Solid State Ionics 25 (1987) 155.
[14]M.C.R. Sastry, K.J. Rao, Solid State Ionics 44 (1991) 187.
[15]Y. Li, J.H. Gong, Z.L. Tang, Y.S. Xie, Temperature-independent activation energy for ionic conduction of zirconia based solid electrolytes, ActaPhysico-ChimicaSinica 17 (2001) 792–796.
[16]J.A. Kilner, B.C.H. Steele, in: O.T. Sorensen (Ed.), Nonstoichiometric Oxides, Academic Press, New York, p. 233 1981.
[17]G.C. Psarras, E. Manolakaki, G.M. Tsangaris, Composites A 34 (2003) 1187.
[18]K.P. Chandra, R.N. Gupta, Int. J. Mod. Phys. B 22 (2008) 2321.
[19]Li M, Feteira A and Sinclair D C J. Appl. Phys, 105 (2009). 114109.
[20]Wang C-C, Zhang M-N, Xu K-B and Wang G-J J. Appl. Phys.112(2012) 034109
 Advanced Materials Science and Technology2021年6期
- Advanced Materials Science and Technology的其它文章
- Nano-structured Ni-based Active Species Supported on Metallic Substrates as the Efficient Catalysts
- A Journey into the Determination of Polyaniline Molecular Weight
- Design and Selection of Material for Plastic Gears
- Machine Learning for Next-generation Printed Technologies