
Simulation of Shallow Gas Invasion Process During Deepwater Drilling and Its Control Measures
2022-06-14 04:20LEIYaniSUNJinandWANGGuangjian
LEI Yani, SUN Jin, and WANG Guangjian
Simulation of Shallow Gas Invasion Process During Deepwater Drilling and Its Control Measures
LEI Yani1), SUN Jin2), 3), *, and WANG Guangjian1)
1),,266525,2),,,572000,3),519080,
Shallow gas is considered one of the most serious geological hazards in deepwater drilling because it has the characteristics of suddenness and is difficult to deal with. To perform a quantitative evaluation of shallow gas risk during deepwater drilling, a numerical model for calculating gas invasion volume is established based on gas-water two-phase flow theory. The model considers the effect of the dynamic drilling process, and the influencing factors which affect the gas invasion volume are analyzed. Results indicate that the gas invasion rate and accumulated gas invasion volume increase with increasing bottom-hole pressure difference. A linear relationship exists between gas invasion volume and bottom-hole pressure difference. The duration of gas invasion increases as the shallow gas zone thickness increases, and the accumulated gas invasion volume grows as shallow gas zone thickness increases. The increase in formation permeability, water depth, and rate of penetration will enhance the gas invasion rate. However, these three factors can hardly affect the accumulated gas invasion volume. The gas flow rate increases significantly with increasing burial depth of shallow gas. On the basis of influencing factor analysis, a series of methods that consider different risk levels is proposed to control shallow gas, which can provide a reference for the prevention of shallow gas disasters during deepwater drilling.
shallow gas; deepwater drilling; dynamic drilling process; gas invasion; gas invasion rate
1 Introduction
Shallow gas generally refers to the small gas reservoir formed by gas accumulation in the shallow formation of 1000m below the sea floor (Zhang., 2016; Wu., 2018). Shallow gas is generally concentrated in sedimentary layers such as sands, silts, or clays. Geochemical ana- lyses show that shallow gas can be divided into biogas and thermogenic gas (Floodgate and Judd, 1992; Sun., 2012). The biogas is generated by the decomposition of a large amount of organic matter in the shallow formation. Its main component is methane (heavy hydrocarbon is rare) (Lin., 2004). Thermogenic gas is formed by the accumulation of hydrocarbon gases transported from deep formations (usually below 1000m of the mud line) throughcertain channels. Shallow gas is always blocked by the up- per tight layer, so it often has a high-pressure nature. Generally, shallow gas may cause great damage and is a dangerous marine geological hazard (Zulkipli., 2018).
Shallow gas is widely distributed in the South China Sea (Li., 2010).At present, a large amount of shallow gas has been found in offshore oil and gas fields in the north- thern South China Sea (such as Zhangzhou, Wenchang, Ledong, Yacheng, Penglai, Panyu, Huizhou, Xijiang, Lu- feng). In recent years, with the continuous increase in deep- water oil and gas exploration in the northern South China Sea, shallow gas has also been found in deepwater areas, such as the Pearl River Mouth Basin and the Qiongdongnan Basin, whose accumulation is related to the shallow biogas hydrocarbon source rocks that developed in deepwater basin and gas transportation channels (He., 2015). The existence of this shallow gas may trigger overflow or even blowout and could greatly threaten the safety of deep- water drilling operations (Mayer and Sachsenhofer, 2013). Therefore, studying the quantitative assessment of shallow gas hazards and their prevention and control measures is important.
Extensive research has been conducted on gas kick pro- blems in the drilling process (Avelar., 2009; Mazzetti., 2014; Galdino., 2019; Sule., 2019; Sun., 2019). Most of this research focused on the development of gas cut and overflow in the wellbore and annulus by conducting numerical simulations, indoor experi- ments, or field monitoringand little is known about the flow characteristic of shallow gas from the formation into the wellbore during drilling.
For the gas spilling problem in the formation, Nermoen. (2010) conducted experiments that simulated the pro- cess of shallow gas spilling in the sands. They found that gas pressure is the most critical factor to control the onset of upward gas spilling in the formation and derived the critical pressure required for the onset of fluidization. In addition, some researchers studied the shallow gas flow in the formation by numerical simulation. Cheng. (2018)used a discrete particle simulation method to simulate the process of gas spilling in the formation and obtained the change in pressure and gas flow velocity during overpressure gas release in the formation. Marken. (2000) used a modified gas kick simulator to provide a tool for controlling shallow gas kick before and during drilling operations. Simulations showed the threshold levels for uncontrolled blowouts as a function of gas zone permeability andgas pressure. In addition, some researchers studied the shal-low gas flow in the formation through experiments and numerical simulation. Rath and Podio (2000) used simulators (KICK1 and COMBOF) to simulate high gas flow from overpressured high-permeability formations. The well- bore is coupled to an overpressured highly permeable zonethrough the use of an influence function, which is an exter- nally generated linear system whereby a change in pseudo- pressure yields a change in cumulative gas in flux.
In conclusion, the shallow gas flow process in the formation around the well is not understood well. The control of shallow gas requires an in-depth understanding of the flow characteristic of shallow gas from the formation into the wellbore during drilling. Further study on the gas invasion process during drilling is needed. To determine the amount of gas invasion and its influencing factors whendrilling shallow gas zones,a finite element model that considers the dynamic drilling process was established to si- mulate the process of shallow gas invasion during drilling based on the gas-water two-phase flow theory. The influence of different influencing factors on the amount of gas invasion was analyzed. The results can provide some guidance for the control of shallow gas during deepwater drilling.
2 Hazards and Their Triggering Mechanism When Drilling Shallow Gas Zone
For the offshore oil and gas industry, shallow gas is a main geological hazard that can pose a great threat to drilling (Orange., 2005). Fig.1 shows the hazards en- countered when drilling the shallow gas zone. When the shallow gas zone is drilled, the gas will flow into the borehole driven by pressure difference. It will then cause a large amount of gas to flow into the borehole and may develop an uncontrolled flow of gas to the surface (Zhang., 2018). The gas outflow also reduces pore pressure in the shallow gas reservoir, which will cause a decrease in effective stress and deformation of the formation. Sometimes, it may even damage the formation around the well, resulting in the collapse of the wellbore and the enlargement of the borehole diameter. In addition, it may also cause the subsidence of formation and instability of the subsea wellhead and sometimes even destroy the platform and threaten the safety of workers. Generally, the gas cut is considered the main disaster of drilling shallow gas. After the gas cut, the performance of the drilling fluid is changed,which will influence the drilling quality. It can also change the performance of cement slurry (Tiraputra., 2004; Bybee, 2005), resulting in poor quality of cement annulus in the shallow gas zone and formation of hydrates in the wellbore (Upchurch., 2017).When the degree of gas intrusion is serious, it may also cause a blowout. If the blowout preventer has not been installed when drilling the surface section of a well (Costeno., 2012), then the blowout may cause fire or platform overturn.Shallow gas is considered one of the most serious geological hazards in marine drilling operations because it has the characte- ristics of suddenness and is difficult to deal with. Therefore, a detailed shallow gas engineering geological survey and hazard assessment need to be conducted before deepwater drilling.

Fig.1 Schematic of geo-hazards in the shallow gas zone.
3 Formulation of Mathematical Models of Shallow Gas Invasion
When the shallow gas zone is being drilled, the gas in the formation will flow into the borehole, especially when the bottom-hole pressure is much less than the pore pressure of the formation. A gas invasion calculation model that considers the dynamic drilling process is established. On the basis of this model, the main factors that affect the amount of gas invasion are analyzed.
3.1 Model Assumptions
The following assumptions are required for developing a mathematical model to calculate the amount of gas invasion when drilling a shallow gas zone:
1) The shallow gas zone is a kind of porous media that contains only water and gas in its pores.
2) The gas in the pore is composed of methane.
3) The solid grains in the shallow gas zone are incompressible.
4) The shallow gas zone is homogeneous and isotropic.
5) The generation of hydrates and the dissolution of gas in water are not considered.
6) Pore water is assumed to be incompressible, and the flow of gas and water in the formation obeys Darcy’s law.
7) The flow of solid particles is not considered in this model, which indicates that the model is not applicable to unconsolidated sand formation.
3.2 Gas-Water Two-Phase Flow Equations
Gas invasion can be considered a gas-water two-phase flow problem (Zhu., 2021). The continuity equation can be written as


whereandare the gas and water density, respectively;is the porosity;SandSare the gas and water saturation, respectively;vand vare the velocity vectors of gas and water, respectively;qandqare the source terms of gas and water, respectively.
Substituting Darcy’s law into Eqs. (1) and (2), we obtain


whereis the fluid flow velocity vector;is the absolute permeability; kandkare the relative permeability of gas and water, respectively;is the pore fluid pressure; andis the gravity acceleration.
According to the equation of gas state, the gas density is (Obuba., 2013)
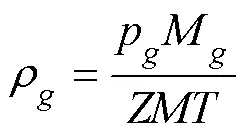
whereis the gas temperature,is the gas volume,is the universal gas constant, andis the gas compressibili- ty factor.
Substituting Eq. (5) into Eq. (3), we have

Eqs. (4) and (6) are the gas-water two-phase flow models. Four unknowns (p,p,SandS) are present in the mo- del. Thus, two auxiliary equations are also needed, namely, the saturation relationship and the capillary pressure relations. They can be written as


wherepis the capillary pressure between the gas and water phase.
3.3 Relative Permeability and Capillary Pressure Between the Gas and Water Phase
The relative permeability of the gas and water phase can be obtained by the Brooks-Corey model (Sun and Mohanty, 2006), where the relative permeability of the water phase is
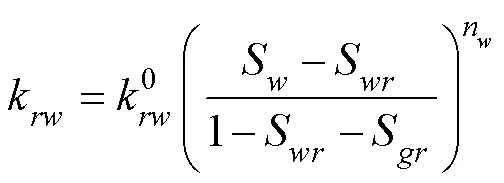
where0is the relative permeability of the water phase when the water saturation is 1−S,SandSare the re- sidual saturation of the gas and water phase, respectively; andnis a constant that reflects pore structure.
The relative permeability of the gas phase is

where0is the relative permeability of the gas phase whenthe gas saturation is 1−S, andnis a dimensionless constant that reflects the pore structure.
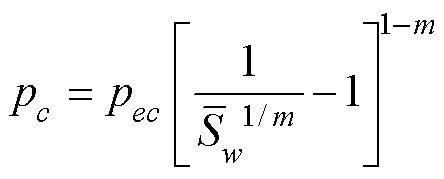
The capillary pressure depends on interfacial tension, surface wettability, and pore radius. Here we assume that the capillary pressure obeys van Genuchten’s model (van Genuchten, 1980)
4 Analysis of Influencing Factors of Shallow Gas Invasion Volume
4.1 FEM Model and Calculation Parameters
Shallow gas occurs in four forms: layered, lumps, high- pressure airbags, and air diapir. This paper establishes a layered shallow gas model to simulate the gas invasion behavior when drilling into shallow gas. For isotropic for- mations, the gas-water two-phase flow around the wellbore can be considered an axisymmetric problem. Fig.2a is a schematic of the geometric model in the-plane. The borehole diameter is 0.66m. The whole formation is 90m thick and 150m wide. The radius of the shallow gas zone is 50m, and its thickness ranges from 10m to 30m. The formation around the shallow gas reservoirs is a low-per- meability sedimentary layer. The upper and lower layers of the low-permeability layers are normally compacted sedi- mentary layers. Fig.2(b) shows the axisymmetric FEM geo- metric model.
The initial pore pressure of the formation outside the shallow gas zone is equal to the hydrostatic pressure. To simulate the overpressure in the shallow gas zone, different initial pore pressures in the zone are specified. The top and bottom boundaries of the model are impermeable, while the right boundary is the pressure boundary condition.
To simulate the dynamic drilling process, the deactivation/reactivation method is used and is illustrated as follows (Sun., 2018):

Fig.2Geometric model. (a), schematic of the geometric model in theplane; (b), axisymmetric FEM geometric model.
1) The elements inside the wellbore are subdivided into multiple thin elements. The thickness of each subdomain is set to ∆.At the initial state, the properties of the elements inside the wellbore are identical to those of the formation.

Seawater is used for shallow drilling. The density of seawater is 1.035gcm−3, and the dynamic viscosity is 1 mPa.s. We assume that the gas is composed of methane. Therefore, the molar mass of gas is 16gmol−3. The dynamic viscosity of methane is 1.13×10⁻²mPa.s. The permeability of the upper and lower layers is set to 0.1D, and the porosity is 0.20. The porosity of the shallow gas zone is 0.30. The initial gas saturation is 0.60. The residual gas and water saturation are 0.05 and 0.15, respectively. The gas compression factoris 0.8. In van Genuchten’s model,P=0.1MPa,=0.45. In the relative permeability model,0=0.3,0=0.6,n=0.4,n=4. The thickness of the low-permeability layer around the shallow gas zone is 2m. The porosity of the low-permeability layer is 0.02, and its permeability is 0.01mD. Without special instructions, the water depth is set to 1500m, and the shallow burial depth of the center of the shallow gas zone is 500 m. Its permeability is 500mD. The thickness of the shallow gas zone D is 25m. The ROP is set to 30mh−1. The bottom-hole pressure difference is 1.0MPa.
The relation between the seawater temperature and water depth is (Hu., 2011)

whereis the water depth, andTis the seawater temperature.
4.2 Influencing Factors of Gas Invasion Volume
The influence of bottom-hole pressure difference, gas layer thickness, gas layer permeability, ROP, water depth, and burial depth on gas invasion volume is studied. The gas volume is greatly affected by pressure and temperature.Thus, the gas invasion volume under formation conditionsis converted into volume under 20℃ and 1 standard atmo- spheric pressure to compare the gas invasion volume under different conditions (unit: sm3h−1).
4.2.1 Influence of bottom-hole pressure difference on gas invasion volume
Fig.3 shows the change in gas flow rate with time under different bottom-hole pressure differences (0.5, 1, 1.5, 2.0, and 2.5MPa). Fig.4 shows the evolution of shallow gas zone pressure at its outer edge.
Fig.3 indicates that during the process of drilling the shallow gas zone, the gas flow rate increases rapidly and has the characteristic of rapid release. This condition occurs because the shallow gas zone pressure is suddenly decreased. After that, the gas flows into the wellbore under the drive of the bottom-hole pressure difference. After 0.7h, the shallow gas zone is completely drilled through. At this time, the gas flow rate reaches the highest value. A great bottom-hole pressure difference corresponds to a great gas invasion rate. For example,when the bottom- hole pressure difference is 0.5MPa, the maximum gas flowrate is 14.19×10⁴sm3h−1, and when the bottom-hole pressure difference increases to 2.5MPa, the maximum gas flow rate increases to 70.09×10⁴sm3h−1. The pressure dif- ference has a great influence on the gas flow rate. After the shallow gas zone is drilled through, the gas flow rate decreases rapidly because the thickness of the shallow gas layer that contributes to the flow will no longer increase, and the dissipation of the pore pressure causes a rapid decrease in gas flow rate (Fig.4).
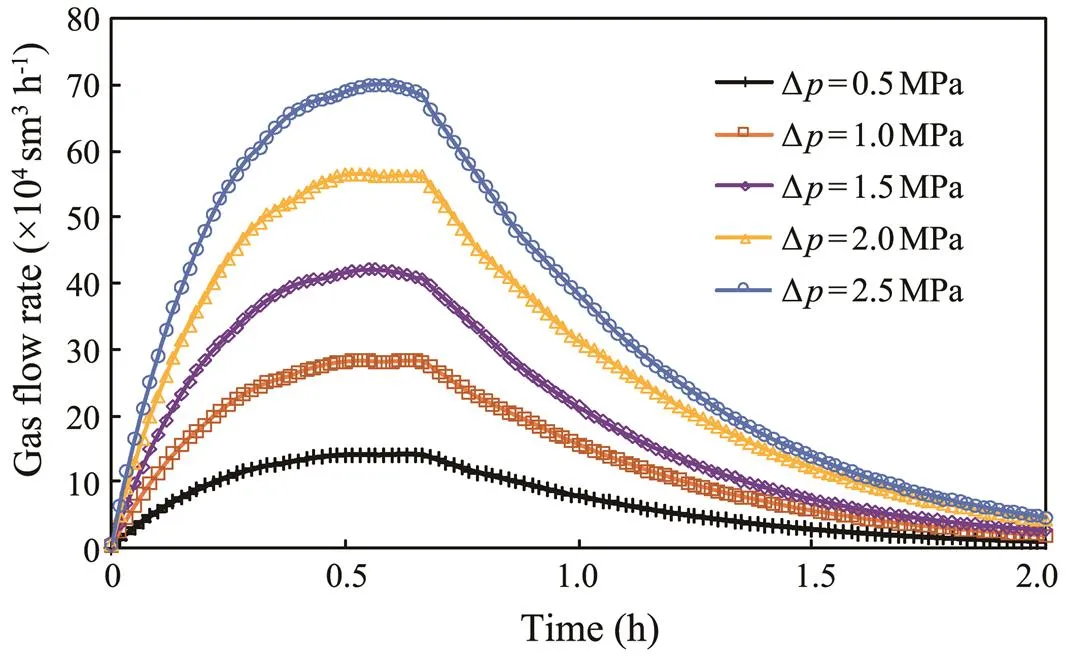
Fig.3 Variation of gas flow rate with time under different bottom-hole pressure differences.
To obtain the relationship between the maximum gas flow rate and bottom-hole pressure difference, the maximum gas flow rate is plotted directly against the bottom- hole pressure difference as in Fig.5. As shown in the figure, the maximum gas flow rate increases nearly linearly with the bottom-hole pressure difference.Their relationships can be obtained by linear fitting
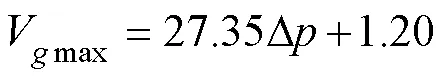
whereVmaxis the maximum gas flow rate, 104sm3h−1; and∆is the bottom-hole pressure difference, MPa.
The accumulated gas invasion volume (Fig.6) can be obtained according to the gas flow rate near the well. The accumulated gas invasion volume increases rapidly at the beginning, and then the gas flow rate gradually decreases with the dissipation of the pore pressure of the formation. The gas flow rate gradually approaches 0, and the accumulated gas invasion volume curve tends to bend and flatten out. In addition, a high bottom-hole pressure difference corresponds to a great accumulated gas invasion volume. The relationship between them is approximately linear (Fig.7)

where Vgis the accumulated gas invasion volume.

Fig.6 Variation of accumulated gas invasion volume with time under different bottom-hole pressure differences.

Fig.7 Variation of accumulated gas invasion volume with the bottom-hole pressure difference.
4.2.2 Influence of shallow gas zone thickness on gas invasion volume
Figs.8 and 9 show the change in gas flow rate and accumulated gas invasion volume with time for different shallow gas zone thicknesses (10, 15, 20, 25, and 30m).
When the shallow gas zone thickness is 10, 15, 20, 25, and 30m, the maximum gas flow rates are 24.92×10⁴, 27.63×10⁴, 28.31×10⁴, 29.60×10⁴, and 29.72×10⁴sm3h−1, respectively. The maximum gas flow rate increases as the formation thickness increases. However, the increase is no longer obvious when the shallow gas zone increases to 25m because drilling does not happen instantaneously. When the ROP remains constant, only part of the gas in the shallow gas zone flows into the wellbore within a certain period of time, which is why the maximum gas flow rate will not increase when the thickness of the formation reaches a certain value.
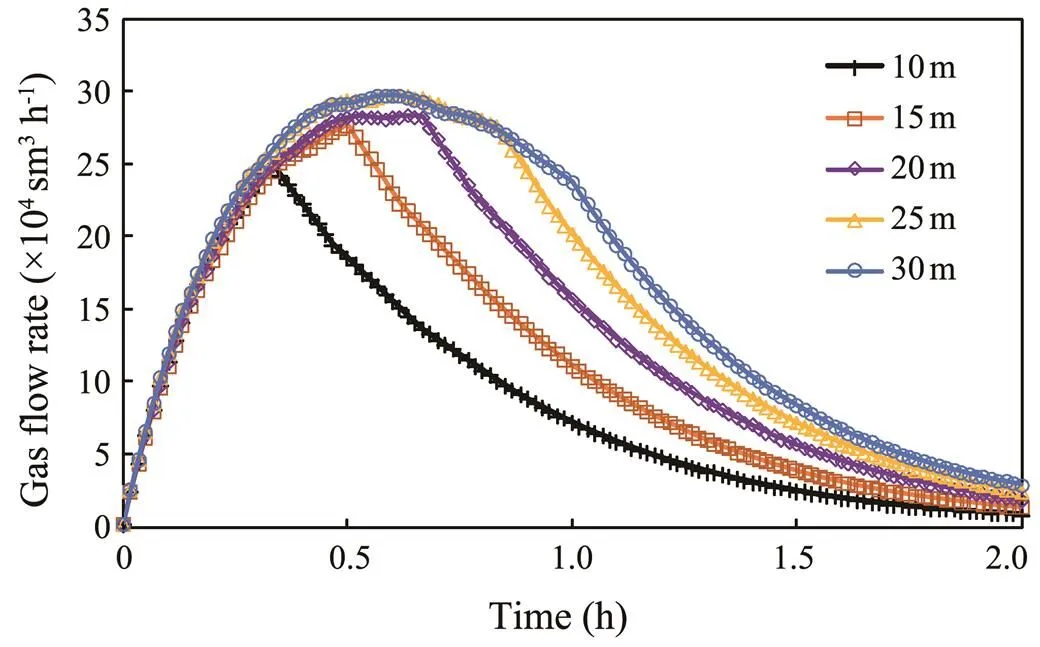
Fig.8 Variation of gas flow rate with time for different shal- low gas zone thicknesses.

Fig.9 Variation of accumulated gas invasion volume with time for different shallow gas zone thicknesses.
It thus follows that the influence of shallow gas zone thickness on gas flow rate is negligible when the thicknessis sufficiently large. This thickness of the shallow gas zone can be defined as the critical thickness. Its value is related to bottom-hole pressure, ROP, and formation permeability, as shown in Fig.10. The critical thickness decreases as the bottom-hole pressure difference ∆and formation perme- ability increase because the pore pressure dissipation becomes faster when ∆and formation permeability increase. The contribution of the upper drilled shallow gas zone decreases due to the dissipation of pore pressure as time goes. An approximately linear relation exists betweencritical thickness and ROP. Therefore, decreasing ROP can help mitigate shallow gas inflow.
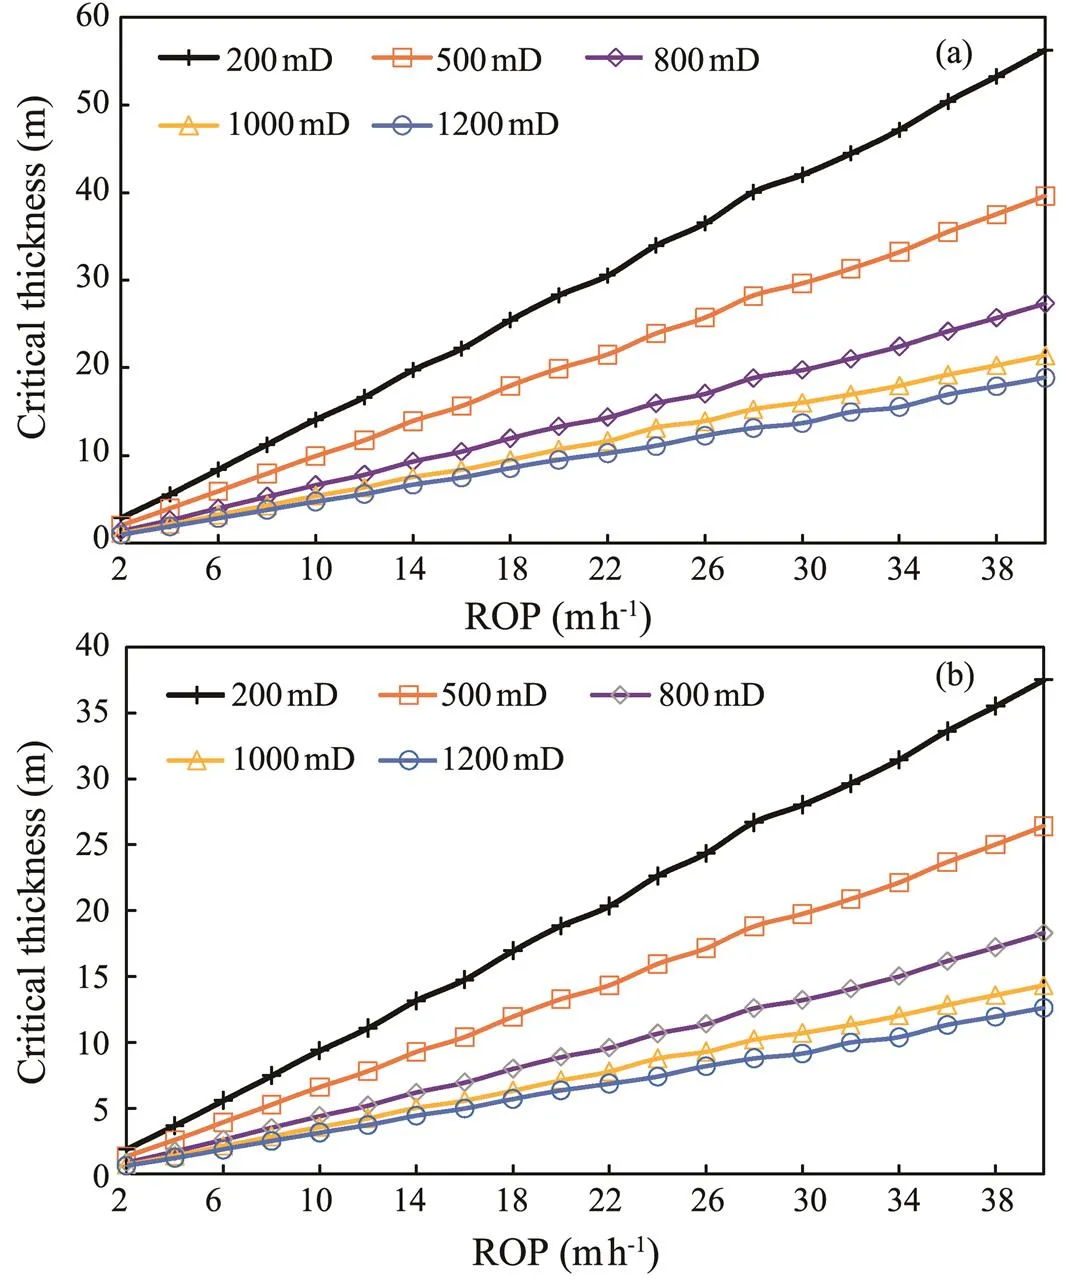
Fig.10 Variation in critical thickness with ROP and permeability for different bottom-hole pressure differences. (a), ∆p=1.0MPa; (b), ∆p=1.5MPa.
However, the accumulated gas invasion volume will increase as the shallow gas zone thickness increases. Fig.8 shows that the peak point of the gas flow rate lags increasingly as the shallow gas zone thickness increases. Accord- ingly, the duration of the gas invasion lengthens, and the gas flow rate decreases more slowly, which makes the accumulated gas invasion volume increase from 17.83×10⁴sm3to 33.97×10⁴sm3when the formation thickness increases from 10m to 30m.
4.2.3 Influence of permeability on gas invasion volume
Figs.11 and 12 show the change in gas flow rate and accumulated gas invasion volume with time for different shallow gas zone permeability (200, 500, 800, 1000, and 1200mD).
As the shallow gas zone permeability increases, the maxi- mum gas flow rate increases constantly. When the shallow gas zone permeability is 200mD, the maximum gas flow rate is 21.90×10⁴sm3h−1. When the permeability in- creases to 1200mD, the maximum gas intrusion rate will increase to 33.46×10⁴sm3h−1.This finding shows that a high permeability of the gas layer corresponds to an increased shallow gas hazard. The dissipation of pore pressure speeds up as the permeability of the formation increases, which is why the peak point of the gas intrusion rate appears earlier as the permeability increases. The duration of the gas invasion shortens, and the gas flow rate decreases faster. After about 1h, the gas flow rate of gas formation with higher permeability is less than that of gas formation with lower permeability. Fig.12 shows that a higher shallow gas zone permeability corresponds to a larger accumulated gas invasion volume at the beginning. However, the permeability has little effect on the final ac- cumulated gas invasion volume.

Fig.11 Variation of gas flow rate with time for different shal- low gas zone permeability.
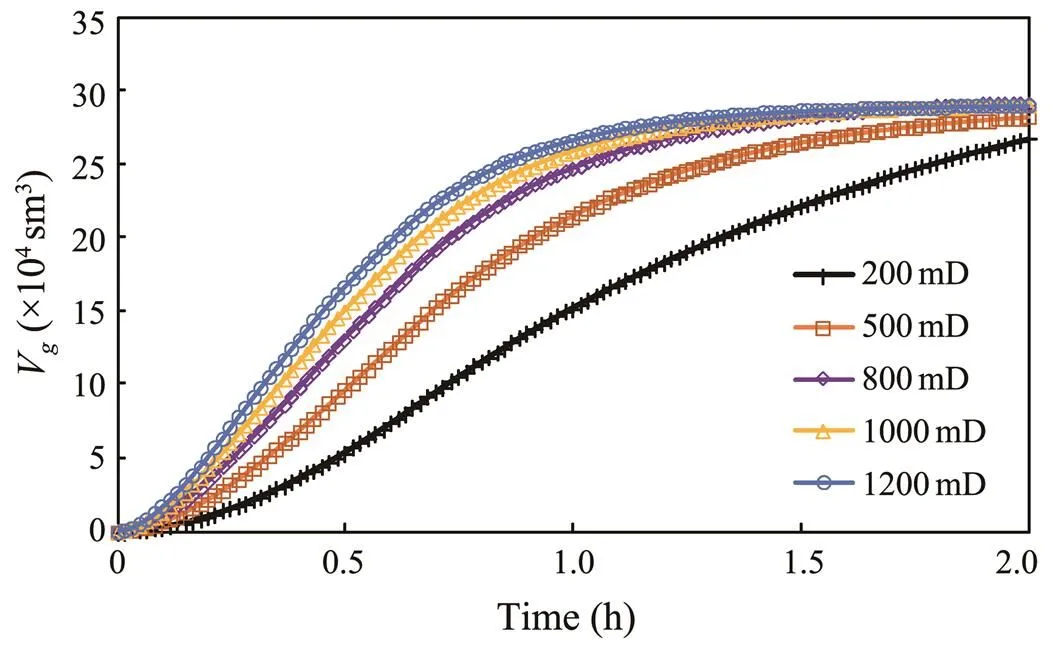
Fig.12 Variation of accumulated gas invasion volume with time for different shallow gas zone permeability.
4.2.4 Influence of ROP on gas invasion volume
To study the effect of different ROP on shallow gas in- vasion, three different rates of penetration (20, 30, and 40mh−1) were set. Figs.13 and 14 show the change in gas flow rate and accumulated invasion volume with time un- der different ROP.
The ROP has little effect on the final accumulated gas invasion volume. However, the maximum gas flow rate increases significantly as the ROP increases, and the peak point of the gas invasion rate appears earlier because the accelerated ROP increases the thickness of the exposed gasformation per unit time. As a result, more gas from the shal- low gas zone will contribute to fluid flow into the wellbore per unit time for higher ROP. After the rapid release of gas at the initial time, the gas flow rate decreases quickly. ROP affects the gas invasion rate greatly, which is why a relationship between ROP and maximum gas flow rate needs to be established. Fig.15 shows the maximum gas flow rate under different ROPs.
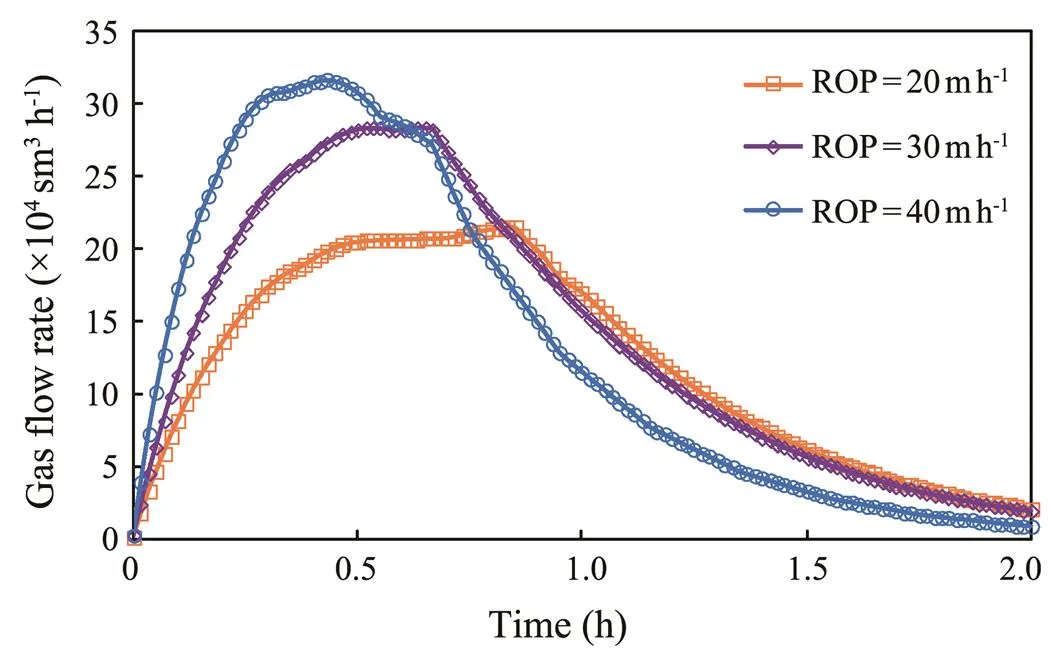
Fig.13 Variation of gas flow rate with time under different ROP.

Fig.14 Variation of accumulated gas invasion volume with time under different ROP.

Fig.15 Maximum gas flow rate under different ROP.

The relation between ROP and maximum gas flow rate is closely related to formation thickness and permeability. Fig.16 shows that the maximum gas flow rate increases with increasing thickness and permeability of shallow gas zone under the same ROP. This condition arises from the fact that more gas will flow into the wellbore because more formation is exposed for a thicker shallow gas zone. For a given permeability, the maximum gas flow rate increases more significantly for larger thickness.
In summary, using a high ROP when drilling a shallow gas zone is not recommended because the gas flow rate increases with ROP, especially for the thick shallow gas zone with high permeability.
4.2.5 Influence of water depth and burial depth on gas invasion volume
Figs.17 and 18 show the change in gas flow rate and accumulated gas invasion volume with time under different water depths (500, 1000, 1500, 2000, and 2500m).

Fig.17 Variation of gas flow rate with time under different water depths.
The change in water depth will cause the change in pore pressure in the formation. According to the equation of gas state, the gas volume is greatly affected by pressure. A high pressure corresponds to great compression. Therefore, more gas will be trapped in the pores of formation under higher pore pressure when the water depth increases. After the conversion of gas volume from formation condition to standard condition, the maximum gas flow rate increases as the water depth increases, as shown in Fig.17. The peak point of the gas flow rate appears earlier as the water depth increases. However, because the pore pressure decreases more rapidly, the gas flow rate decreases rapidly for a large water depth. As a result, the duration of gas invasion shortens, which makes the gas flow rate decrease faster. The accumulated gas invasion volume will decrease slightly.

Fig.18 Variation of accumulated gas invasion volume with time under different water depths.
The burial depth of shallow gas will also affect the gas invasion for some similar reasons. Fig.19 shows the variation of gas flow rate with time under different burial depths when the water depth is 1500m. The burial depthaffects gas flow rate more significantly than water depth because both the pressure and temperature will be affected by the change in burial depth of shallow gas. As burial depth increases, the pressure and temperature in the formation will also increase. According to the equation of gas state, more gas is trapped in the pores of formation under higher pore pressure and temperature when the burial depth increases. Therefore, the gas flow rate increases significantly with the increasing burial depth. The results indicate that shallow gas invasion is more serious for deep buried shallow gas and should be given great attention.

Fig.19 Variation of gas flow rate with time under different burial depths.
On the basis of the above analysis, the shallow gas formation pressure has a significant effect on the shallow gas invasion during deepwater drilling. The accumulated gas invasion volume increases linearly as the bottom-hole pres- sure increases. When the shallow gas zone thickness is small, the maximum gas flow rate and accumulated gas in-vasion increase as the formation thickness increases. How- ever, the shallow gas zone thickness has a negligible influence on the gas flow rate when the thickness exceeds a certain value. Although the permeability and the ROP have little effect on the final accumulated gas invasion volume, they can increase the maximum gas flow rate. The maximum gas flow rate increases as water depth increases. Therefore, shallow gas should be given much more attention during deepwater drilling.
4.3 Discussion on How to Control Shallow Gas During Drilling
The above sensitivity analysis of gas invasion volume can help us formulate some measures to control shallow gas. For example, decreasing the pressure difference can help mitigate the shallow gas invasion. Therefore, a shallow gas zone with low pressure can be drilled without special attention. For shallow gas zone with high pressure, we can use the dynamic kill method for well control. The gas flow rate increases as the ROP increases, which is why using a low ROP when drilling a shallow gas zone is re- commended.
According to the amount of gas invasion volume, the shallow gas can be divided into four levels: light flow (slight gas invasion), bubble flow (early well kick), slug flow (well kick), and annular flow (blowout).
1) Level 1: Slight flow (slight gas intrusion)–The gas starts to invade the bottom of the well. Mud overflow of less than 0.1m3occurs at the wellhead, and detecting the gas influx at the wellhead is difficult.
2) Level 2: Bubble flow (early well kick)–Moderate gas invasion. About 0.1–1m3of mud overflow occurs at the wellhead, and the gas invasion rate ranges from 10 sm3s−1to 100sm3s−1at the bottom of the well.
3) Level 3: Slug flow (well kick)–A large amount of gas invades the wellbore.
4) Level 4: Annular flow (blowout)–The mud in the wellbore is completely invaded by gas.
The flow patterns of Levels 1–4 are shown in Fig.20.
According to the above classification of shallow gas risks, adopting different methods to control shallow gas is recommended, which are shown in Table 1.
4.3.1 Identification of shallow gas
Shallow gas is characterized by gas chimneys, enhanced reflections, pipes, acoustic blanking, and bright spots in 3D seismic profiles. A gas chimney is a vertical acoustic anomaly where gas flows upward intensively. Enhanced reflection is a partial amplitude enhancement on seismic profiles. A gas chimney is caused by the differenceof acoustic impedance between gas-bearing sediments and overlying non-gas-bearing sedimentary sequences. A pipe is formed by gas movement along faults from underlying sediments into overlying sands layers. Acoustic blanking is shown by abrupt weakening and disappearance of internal reflections. The occurrence of acoustic blanking is associated with the disruption of gas migration to sedi- ments and seismic wave energy absorption of gas-bearing sediments, which mainly occur in underlying enhanced reflections. A bright spot represents the surface of the gas cap. It shows a high amplitude and partial enhancement of reflections with anti-phase on seismic profiles. It is caused by the difference of wave impedance between shallow gas and overlying sequence.
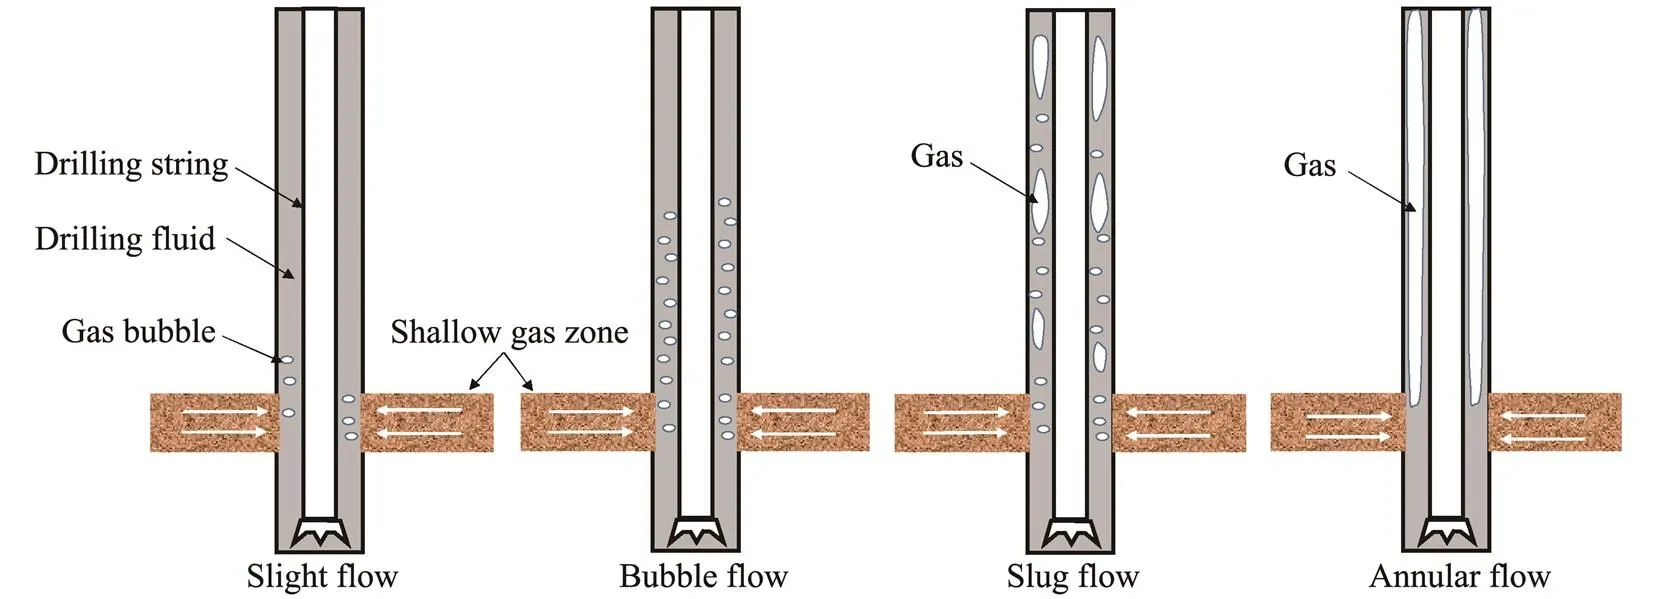
Fig.20 Flow patterns in the wellbore.

Table 1 Control measures of shallow gas
Shallow gas occurs widely in the Baiyun Sag in the nor- thern South China Sea, as shown in Fig.21. Gas chimney mainly occurs in the south and northeast of the Baiyun Sag. Enhanced reflections occur across the entire study area. Pipes develop in the west and northeast of the sag and are commonly related to large faults in the west and small faults in the northeast. Acoustic blanking mainly occurs in the north of the sag. A bright spot is observed in the west and north of the sag, and it is always associated with faults.

Fig.21 Distribution of shallow gas in Baiyun Sag.
4.3.2 Decreasing ROP and detecting early gas kicks
The maximum gas flow rate increases with the increase in ROP, which is why a low ROP is recommended when drilling a shallow gas zone.
Early gas kick detection is of practical importance for preventing blowout. When an early well kick occurs, it must be detected in time. The early gas kick detection method can be classified into two types according to the different installation positions of sensors: detection on platform and downhole detection (Yang., 2019).Detection on platform is convenient, but the detected time of gas kick lags behind the occurrence of gas kick. By comparison, down-hole detection can improve the accuracy and detect gas kick earlier (Hu., 2014). However, this method is more expensive and not suitable for high temperature and high pressure conditions.
4.3.3 Drilling a pilot hole and using dynamic kill or well kill
Drilling a pilot hole is recommended to investigate the presence of shallow gas. The diameter of the pilot hole is usually small (ranging from 21.59–31.12cm), which can reduce the exposed area and the gas invasion rate when drilling shallow gas (Adams and Kuhlman, 1990). Once a gas kick occurs, the small-sized pilot well can be dyna- mically killed. It is drilled at a controlled rate to minimize the volume of gas invasion. The circulation rate must be high enough to flush gas out of the well. Althoughpilot holes can reduce the difficulty of high-pressure shallow gas treatment, they do not guarantee that a blowout will be prevented because the small diameter increases the swab pressure. Great caution should be maintained when drilling pilot holes.
Increasing the bottom-hole pressure can decrease the bottom-hole pressure difference. Therefore, the dynamic kill is considered an effective method to control shallow gas invasion. Dynamic kill is a method to control formation pore pressure that relies on annular friction to create back pressure in the annulus. Consequently, the bottom- hole pressure will increase. Dynamic kill is usually performed by pumping drilling fluid with high density and viscosity at a high rate.
When the gas invasion rate is high or the hole size is large, dynamic kill is no longer effective. In this case, pump- ing heavy mud can be used to rebuild hydrostatic pressure and stop the gas flow. One important issue is to determine the appropriate mud density. On the one hand, the mud density should be high enough to prevent gas invasion, but on the other hand, the mud density should not cause the fracturing of the formation at the last casing seat. Therefore, the mud density requires careful adjustment during the process of well killing. Some operators also recommend the combination of dynamic kill and well kill to control shallow gas. This technique can create a higher pressure to balance the formation pressure.
4.3.4 Drilling the rescue well
Drilling the rescue well is one of the most effective solutions for blowout control. Drilling a directional well en- ables the rescue well to intersect with the accidental well at the connectivity point (Fig.21). Then, the killing fluid can be pumped into the accidental well. The killing method mainly involves:
1) Pumping seawater into the well at a high rate to enhance the equivalent circulating density (ECD) to balance the formation pore pressure, followed by pumping the killing fluid to displace the seawater in the well. After the pressure in the well is balanced, the cement slurry is injected and the well is abandoned.
2) Pumping seawater into the well at a high rate to enhance the ECD to balance the formation pore pressure, followed by the direct injection of cement slurry to abandon the well.
3) Pumping the killing fluid directly. After the pressure in the well is balanced, the cement slurry is injected and the well is abandoned.
5 Conclusions
1) After the shallow gas zone is drilled, a large amount of gas driven by the pressure difference may flow into the well. This situation may also cause the collapse of the well- bore and the enlargement of the borehole. Generally, the gas cut caused by invasion is the main hazard when drilling a shallow gas zone.

Fig.22 Schematic of drilling rescue well.
2) The gas flow rate increases with the increase in the shallow gas zone permeability, water depth, and ROP, but they have little effect on the final accumulated gas invasion volume. Compared with these factors, burial depth, bottom-hole pressure difference, and shallow gas zone thickness could affect gas invasion more significantly. The gas flow rate increases significantly as the burial depth increases. A great bottom-hole pressure difference corresponds to a great gas flow rate and accumulated gas invasion volume, thus indicating their approximately linear re- lation. The accumulated gas invasion volume increases as the formation thickness increases, but the maximum gas flow rate will not constantly increase with the increase in the formation thickness.
3) According to the classification of shallow gas risks, prevention methods of identification, decreasing ROP, early gas kick detection, drilling pilot hole, dynamic kill, well kill, and drilling rescue well need to be adopted to control shallow gas for different risk levels.
4) The numerical model presented in this study does not consider the effect of gas-liquid two-phase flow in the wellbore on the bottom-hole pressure after the gas invasion. However, accurate quantification of the shallow gas hazard degree needs to consider the gas-liquid two-phase flow in the wellbore, which needs further study.
Acknowledgements
This study was supported by the Hainan Provincial Na- tural Science Foundation of China (No. 2018CXTD346), the Sanya Yazhou Bay Science and Technology City Program (No. SKJC-2020-01-009), the Hainan Provincial Ma- jor Science and Technology Program of China (Nos. 521 MS069, ZDKJ202019), and the National Key Research and Development Program of China (No. 2019YFC0312301).
Adams, N. J., and Kuhlman, L. G., 1990. Case history analyses of shallow gas blowouts.. Hous- ton, Texas, 97-106.
Avelar, C. S., Ribeiro, P. R., and Sepehrnoori, K., 2009. Deep- water gas kick simulation., 67 (1-2): 13-22.
Bybee, K., 2005. Overcoming shallow-gas drilling difficulties., 57 (1): 55-57.
Cheng, K., Wang, Y., and Yang, Q., 2018. A semi-resolved CFD- DEM model for seepage-induced fine particle migration in gap-graded soils., 100: 30-51.
Costeno, H., Roed, H., Erivwo, O., Ngau, C. U., and Harris, A., 2012. Managing shallow gas drilling risk with casing drilling technology in Brown Field re-development campaigns.. Tianjin, 1-7.
Floodgate, G. D., and Judd, A. G., 1992. The origins of shallow gas., 12 (10): 1145-1156.
Galdino, J. F., Oliveira, G. M., and Franco, A. T., 2019. Gas kick detection and pressure transmission in thixotropic, compres- sible drilling fluids., 180: 138-149.
He, J. X., Su, P. B., Lu, Z. Q., Zhang, W., Liu, Z. J., and Li, X. T., 2015. Prediction of gas sources of natural gas hydrate in the Qiongdongnan Basin, northern South China Sea and its migra- tion, accumulkation and reservoir formation pattern., 35 (8): 19-29.
Hu, L. T., Zhang, K. N., and Gao, T., 2011. Numerical studies of gas production from gas hydrate zone using heat injection and depressurization in Shenhu area, the South China Sea., 25 (4): 675-681.
Hu, Y. J., Huang, Y., and Li, X. Y., 2014. Automatic de-noising and recognition algorithm for drilling fluid pulse signal., 46 (2): 378-384.
Li, P., Du, J., Liu, L. J., Cao, C. X., and Xu, Y. Q., 2010. Dis- tribution characteristics of the shallow gas in Chinese offshore seabed., 21 (1): 69-74.
Lin, C. M., Gu, L. X., Li, G. Y., Zhao, Y. Y., and Jiang, W. S., 2004. Geology and formation mechanism of late Quaternary shallow biogenic gas reservoirs in the Hangzhou Bay area, eastern China., 88 (5): 613-625.
Marken, C., Hansen, S., and Øregaard, J., 2000. Shallow gas kick: Simulation and analysis for top hole drilling without a riser.. Dallas, Texas, 1-10.
Mayer, J., and Sachsenhofer, R. F., 2013. Shallow hydrocarbons in lower Austria: A drilling hazard and a valuable exploration tool., 106 (1): 62-71.
Mazzetti, M. J., Skagestad, R., Mathisen, A., and Eldrup, N. H., 2014. CO2from natural gas sweetening to kick-start EOR in the North Sea., 63: 7280-7289.
Nermoen, A., Raufaste, C., deVilliers, S. D., Jettestuen, E., Mea- kin, P., and Dysthe, D. K., 2010. Morphological transitions in partially gas-fluidized granular mixtures., 81 (6):1-11.
Obuba, J., Ikiesnkimama, S. S., and Ubani, C. E., 2013. Natural gas compressibility factor correlation evaluation for Niger Del- ta gas fields.,6 (4): 1-10.
Orange, D. L., García-García, A., Dan, M. C., Lorenson, T., For- tier, G., Trincardi, F.,., 2005. High-resolution surveys for geohazards and shallow gas: NW Adriatic (Italy) and Isken- derun Bay (Turkey)., 26 (2-4): 247-266.
Rath, J. S., and Podio, A. L., 2000. Advanced transient simulator for studying shallow gas blowouts..New Orleans, Louisiana, 1-25.
Sule, I., Khan, F., and Butt, S., 2019. Experimental investigation of gas kick effects on dynamic drilling parameters., 9 (1): 605- 616.
Sun, B. J., Fu, W. Q., Wang, N., Wang, Z. Y., and Gao, Y. H., 2019. Multiphase flow modeling of gas intrusion in oil-based drilling mud., 174: 1142-1151.
Sun, J., Wu, S. G., Deng, J. G., Lin, H., and Zhang, H. Y., 2018. Numerical simulation of mechanical compaction of deepwater shallow sediments., 17 (1): 53-64.
Sun, Q. L., Wu, S. G., Cartwright, J., and Dong, D. D., 2012. Shallow gas and focused fluid flow systems in the Pearl River Mouth Basin, northern South China Sea., 315- 318 (4): 1-14.
Sun, X. F., and Mohanty, K. K., 2006. Kinetic simulation of me- thane hydrate formation and dissociation in porous media., 61 (1): 3476-3495.
Tiraputra, P., Thiravutpinyo, P., Pongorapin, S., Fraboulet, B., Dooply, M., Friedl, W.,., 2004. Overcoming shallow-gas drilling difficulties in the Gulf of Thailand.. Dallas, Texas, 1-13.
Upchurch, E. R., Falkner, S., House, A., Nguyen, C., and Russell, K., 2017. Blowout prevention and relief-well planning for the wheatstone big-bore gas-well project.,32 (3): 153-167.
van Genuchten, M. T., 1980. A closed-form equation for pre- dicting the hydraulic conductivity of unsaturated soils., 44 (5): 892-898.
Wu, S. G., Wang, D. W., and David, V., 2018. Deep-sea geoha- zards in the South China Sea., 17 (1): 1-7.
Yang, H. W., Li, J., Liu, G. H., Wang, C., Jiang, H. L., Luo, K. D.,., 2019. A new method for early gas kick detection based on the consistencies and differences of bottomhole pres- sures at two measured points., 176: 1095-1105.
Zhang, B. L., Yang, J., Wang, L., Di, P. W., and Zhao, Y. Q., 2016. Shallow gas well drilling risk assessment and prevention in the Yingqiong Basin area of high temperature and high pressure., 38 (6): 766- 770.
Zhang, L. B., Wu, S. G., Zheng, W. P., and Fan, J. C., 2018. A dynamic and quantitative risk assessment method with uncer- tainties for offshore managed pressure drilling phases., 104: 39-54.
Zhu, L. Q., Ma, Y. S., Cai, J. C., Zhang, C. M., Wu, S. G., and Zhou, X. Q., 2021. Key factors of marine shale conductivity in southern China–Part I: The influence factors other than porosity., 205: 108698.
Zulkipli, S. N. F., Shuib, S. N., Saw, L. J., and Harun, N., 2018. Maximizing value from well abandonment through shallow gas hunting and integrated well surveillance.. Kuala Lumpur, 1-13.
J. Ocean Univ. China(Oceanic and Coastal Sea Research)
https://doi.org/10.1007/s11802-022-4855-z
ISSN 1672-5182, 2022 21 (3): 707-718
(November 25, 2020;
January 6, 2021;
February 28, 2021)
© Ocean University of China, Science Press and Springer-Verlag GmbH Germany 2022
Corresponding author. E-mail: sunjin19870216@126.com
(Edited by Chen Wenwen)
 Journal of Ocean University of China2022年3期
- Journal of Ocean University of China的其它文章
- Effect of Intertidal Elevation at Tsuyazaki Cove, Fukuoka,Japan on Survival Rate of Horseshoe Crab Tachypleus tridentatusEggs
- Asian Horseshoe Crab Bycatch in Intertidal Zones of the Northern Beibu Gulf: Suggestions for Conservation Management
- Experimental Investigation on the Interactions Between Dam-Break Flow and a Floating Box
- Variational Solution of Coral Reef Stability Due to Horizontal Wave Loading
- High Microplastic Contamination in Juvenile Tri-Spine Horseshoe Crabs: A Baseline Study of Nursery Habitats in Northern Beibu Gulf, China
- Influence of Autonomous Sailboat Dual-Wing Sail Interaction on Lift Coefficients