
Experimental realization of two-dimensional single-layer ultracold gases of 87Rb in an accordion lattice
2022-10-26 09:49LiangweiWang王良伟KaiWen文凯FangdeLiu刘方德YundaLi李云达PengjunWang王鹏军LianghuiHuang黄良辉LiangchaoChen陈良超WeiHan韩伟ZengmingMeng孟增明andJingZhang张靖
Chinese Physics B 2022年10期
关键词:云达
Liangwei Wang(王良伟) Kai Wen(文凯) Fangde Liu(刘方德) Yunda Li(李云达)Pengjun Wang(王鹏军) Lianghui Huang(黄良辉) Liangchao Chen(陈良超) Wei Han(韩伟)Zengming Meng(孟增明) and Jing Zhang(张靖)
1State Key Laboratory of Quantum Optics and Quantum Optics Devices,Institute of Opto-electronics,Shanxi University,Taiyuan 030006,China
2Collaborative Innovation Center of Extreme Optics,Shanxi University,Taiyuan 030006,China
Keywords: two-dimensional ultracold gases,accordion lattice,anisotropy
1. Introduction
Optical lattices together with ultracold atoms have become an important platform capable of studying manybody physics, including the Hubbard models,[1–8]collective effect[9–11]and low dimensional quantum systems.[12–16]For two-dimensional(2D)systems, the role of thermal and quantum fluctuations prevail at finite temperatures, and the longrange order disappears.[17,18]Consequently, many intriguing physical phenomena in 2D systems that are considerably different from 3D systems are emerging,such as the existence of the 2D Bose gas phase transition from the high temperature normal phase to a low temperature(below the critical temperatureTc)superfluid state,[19]which is a phase transition of the Berezinskii–Kosterlitz–Thouless(BKT)type,[20]and has been studied experimentally.[21–23]
Ultracold gases in a two-dimensional single-layer are more interesting since it is a clean and pure two-dimensional system and can simulate the single-layer materials such as graphene. Several schemes have been used to load atoms into a 2D single-layer,[24–27]however most of them results in a reduction of atomic numbers[28]due to trap mismatch when atoms in 3D trap are directly loaded into the 2D trap.To resolve this problem, the 3D ultracold atoms are loaded into a single large fringe and then compressed to the quasi-2D state by tuning the periodicity of a blue detuned optical lattice. The experimental scheme to form the lattice with tunable periodicity was first applied for the fabrication of a surfacerelief grating with continuous variation of periodicity by twobeam interferometry.[29]Lately, this scheme of 1D accordion type optical lattice was used to realize the quasi-2D quantum gas.[15,28,30–36]
In true 2D regime,condensate only exists atT=0,however, BEC can be trapped in quasi-2D trap with the trapping energy¯hωzalong thezdirection of strong confinement similar to or larger than the thermal energykBTand the interaction energy per particle. Here most of the atoms occupy the ground state of the vibrational motion along the direction of strong confinement,making it thermodynamically 2D,but collisions still keep their 3D character since the characteristic radiuslzof the Gaussian ground-state wavefunction in thezdirection is much larger than 3D scattering lengtha.[37,38]In quasi-2D regime,the interaction strengthgcan be written as
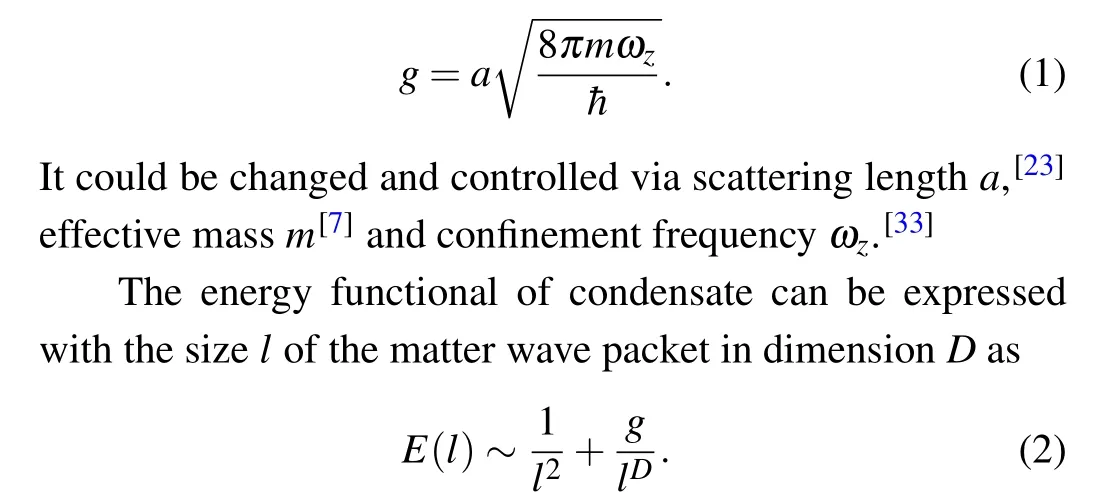
When considering attractive interactions(g <0),this leads to a stable minimum withl*~1/|g| for 1D (D=1), whereas the extremum obtainedl*~|g| is dynamically unstable for 3D(D=3). In contrast,the attractive 2D Bose gases may sustain a quasi-stationary state—scale-invariant Townes solitons,which was observed in experiment recently.[39,40]Therefore,2D Bose gases offer unique opportunities to explore scale invariance in a many-body system,because the effective contact interaction potential and single-particle dispersion both have the same scale dependence.
To achieve a quasi-2D BEC, we need to overcome the challenge of the spatial jitter of the two optical lattice beams at the position of BEC,and to make the lattice compressing procedure adiabatic and hence lower the heating of the atoms.[16]In this paper, we employ the accordion lattice to experimentally realize a 2D single-layer ultracold gases of87Rb, and measure the oscillation frequency and the anisotropy in the 2D BEC. We also present the important optimization procedures in detail that can lead to the best alignment of the accordion lattice and its concise overlap with the atoms cloud.This setup will enable us to study the Anderson localization,BKT phase transition and Kibble–Zurek mechanism in 2D ultracold atoms in the future.
2. Theory
As shown in Fig. 1, two parallel optical lattice beams propagate along the normal direction of the aspheric lens while keeping the same distancedfrom the optical axis. After passing through the lens,the two beams will focus and interfere in the focal plane of the lens with a fringe spacing given by
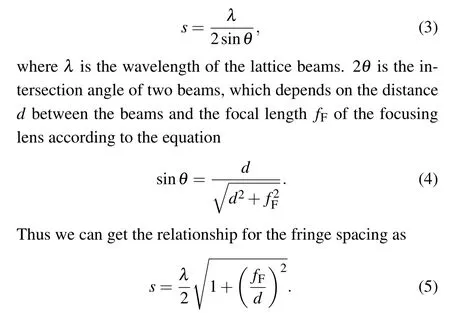
In our experiment,λ=532 nm,fF=150 mm,the range of the distance 2dbetween two lattice beams can be changed in the range of 22.8 mm≥2d ≥3 mm,to get a fringe spacing of 3.5 μm≤s ≤26.7 μm. Since(fF/d)2≫1,Eq.(4)can be simplified as
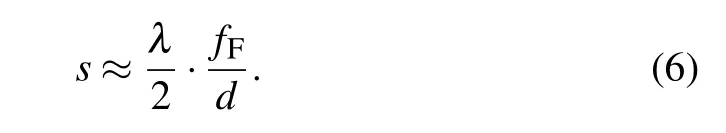
The intensity distribution of the interference pattern formed by the two accordion beams (having the same powerPin each beam)at the focal plane on the BEC position can be written as
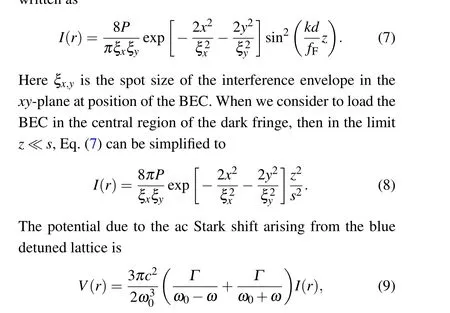
whereω0is the resonant frequency,ωis the driving frequency,andΓis the decay rate of the excited state.This equation gives the dependence of the important trapping parameters on the tunable lattice spacing,thus enabling us to generate 2D trap.
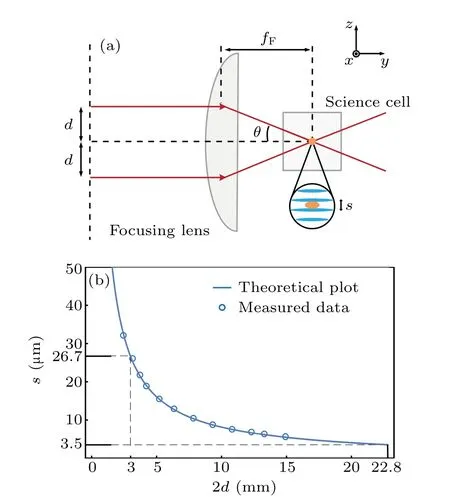
Fig.1. Schematic diagram for the principle of the accordion lattice. (a)Two parallel lattice beams intersect each other with an angel 2θ at the position of the BEC,forming an accordion lattice with dynamically variable periodicity s along the z axis by changing the d.(b)The relationship between the periodicity parameter s and the distance d. The solid line is the theoretical plot of Eq.(5)while the hollow circles represent the experimentally measured data.
3. Experimental setup
The first realization of an accordion lattice using acoustooptic deflector (AOD) was reported in Ref. [31]. The use of AOD has two obvious advantages: it eliminates the unwanted mechanical dither of the lattice beams due to no mechanical parts involved and is easy to control.
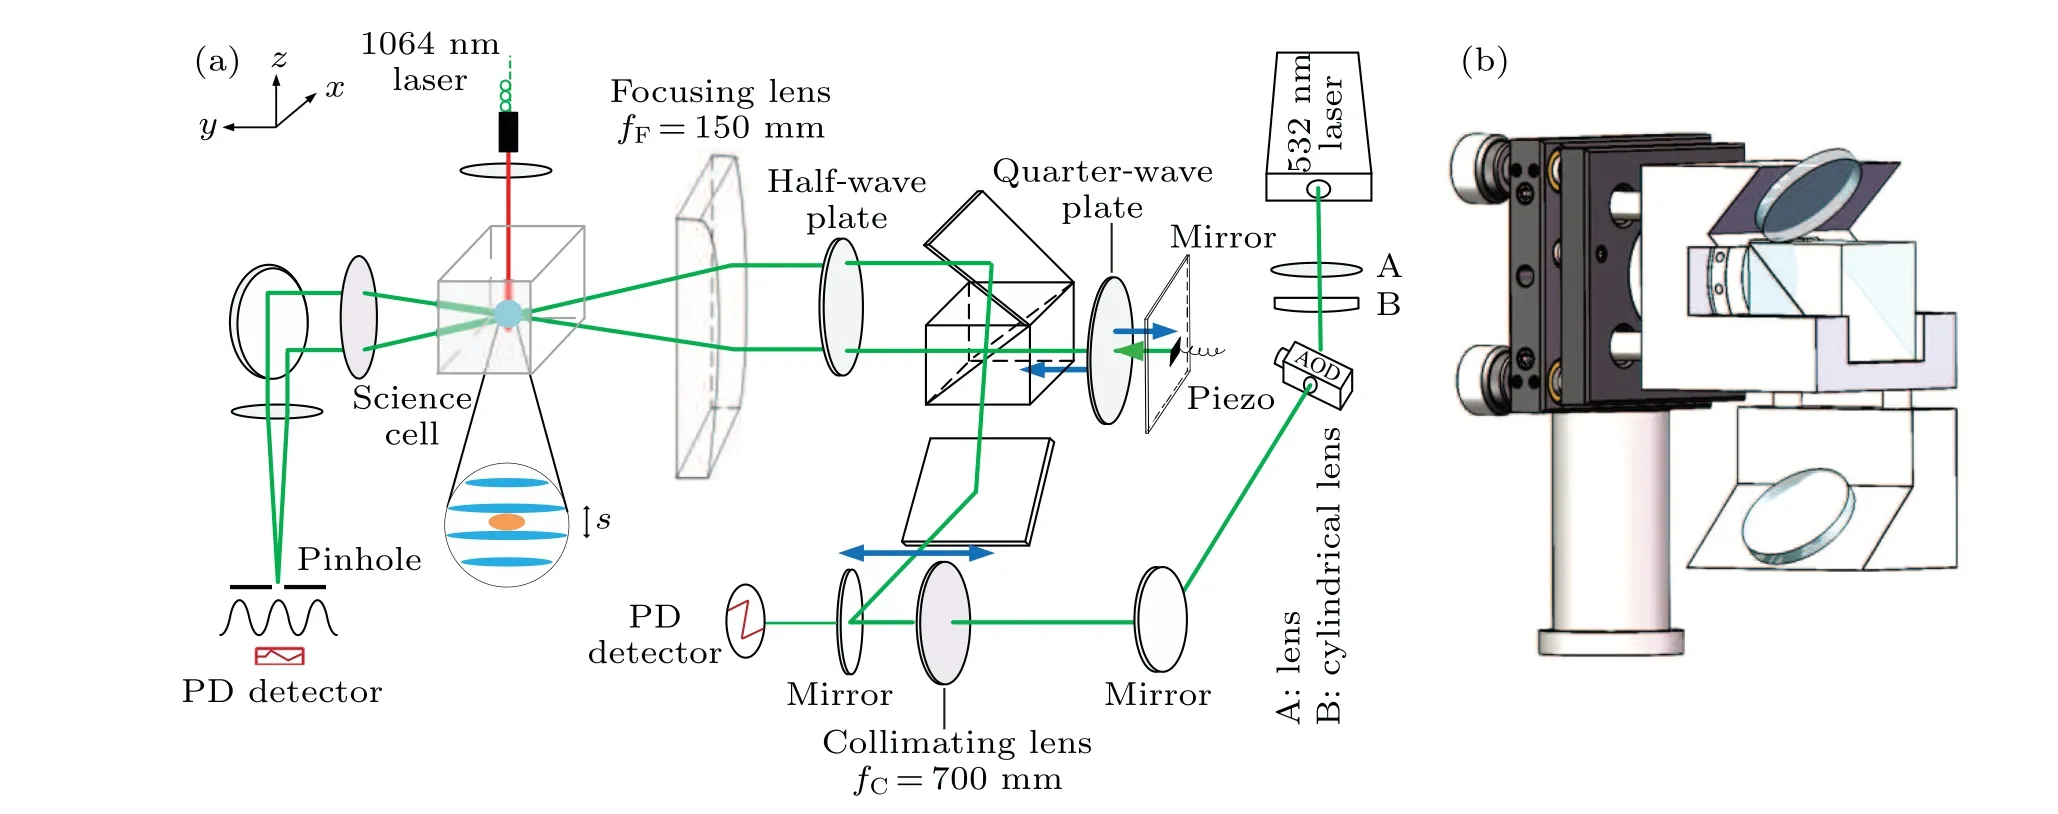
Fig. 2. Schematic diagram for the experimental setup. (a) The experimental setup. (b) The “tower” assembly is made by gluing together a polarization beam splitter(PBS),two 45° high-reflective mirrors,a quarter-wave plate and a 0° high-reflective mirror on a voltage-controlled piezo stack. The BEC is trapped in the potential consisted of the accordion lattice and the 1064 nm dipole trap.
As shown in the experimental setup in Fig.2(a),we use a cylindrical lens to change the laser beam shape into elliptical,and then the laser beam passes through a horizontally placed AOD (AA DTSX-532) with a waist size of 1 mm and 3 mm inyandzdirection, respectively. Then, a collimating lens with the focal lengthfC=700 mm placed 700 mm away from AOD,aligns the-1 diffraction order of the laser beams which propagate along thexaxis. This arrangement makes sure that the laser beam after the collimating lens is always parallel to thexaxis when the laser beam is deflected at different angles by tuning the driving frequency of the AOD. A photodiode(PD) placed behind the last mirror converts the dim leaking light to a voltage signal for the purpose of servo stabilization of the optical lattice potential.
Along thezdirection (gravity direction), the laser beam is split into two parallel beams through the“tower”assembly as shown in Fig.2(b). The“tower”assembly is made by gluing together a polarization beam splitter(PBS),two 45°highreflective mirrors,a quarter-wave plate and a 0°high-reflective mirror on a voltage-controlled piezo stack. With the help of the voltage-controlled piezo stack in the“tower”assembly,the position of a dark fringe in the interference pattern of the accordion lattice can be adjusted precisely. This configuration reduces the heating of atoms by keeping the two beams with the same consistent phase jitter. The quarter-wave plate and 0°mirror on a voltage-controlled piezo stack are used to compensate for the optical path difference between the two lattice beams. It needs to be emphasized that the quarter-wave plate and 0°mirror should be close to the PBS in order to reduce the geometrical aberration between the two lattice beams. This setup changes the scanning displacement of the lattice beam fromydirection tozdirection(the horizontal displacement of the lattice beam is converted into the vertical displacement).
A radio frequency(RF)field drives the AOD with the frequencies in the range of 106 MHz to 90 MHz,which translates to the dynamic tunning of the spacing of two parallel accordion beams from 3 mm to 22.8 mm. The half-wave plate plays an important role by changing the direction of polarization of both lattice beams fromz(vertical)toxdirection(horizontal),so we can have full destructive interference of the light beams at the position of atoms.
The relationship between the deflection angleθ′of the AOD and the intersection angle between the two beams can be written asθ′= (fF/fC)θ. Choosing a focusing lensfFwith the focal length smaller thanfCis desirable for space saving and reducing the tuning range of frequency sweep of the AOD. Here, we choosefF= 150 mm of the focusing lens limited by the available space in our system. The focusing lens is an aspheric lens with the aperture dimensions of (x,z)=(15,50) mm. The two lattice beams with the spot sizes of 1 and 5 mm inxandzdirections pass through the same focusing lens, and converge at the position of the BEC with waists of 350 μm and 70 μm alongxandzaxes,respectively.At the focus of the aspheric lens,the interference fringes with tunable periodicity form 2D pancakes of light in thexy-plane,which look like an accordion along thezdirection. Thanks to the cylindrical and the aspheric lenses,2D pancakes of light at the center of the accordion lattice are designed to be isotropic,and the spherical aberration is reduced to a minimum.
Here, we would like to emphasize that the selection of the focusing lens is important. In Fig.3,we present the measured displacements of the two beams at the focal planes using a spherical lens (Fig. 3(a)) and an aspheric (Fig. 3(b)) as the focusing lens respectively,when the displacements of the lattice beams are varied through changing the driving frequency of the AOD.It is clear that the deviation from the central position along thezandxdirections is reduced(at the maximum frequency range) to about 10 μm (Fig. 3(b)) when using the aspheric lens. Moreover,the deviations from the central position of the two lattice beams are made to be synchronous with each other for the aspheric lens,which significantly reduce the atomic heating due to the trap shift.
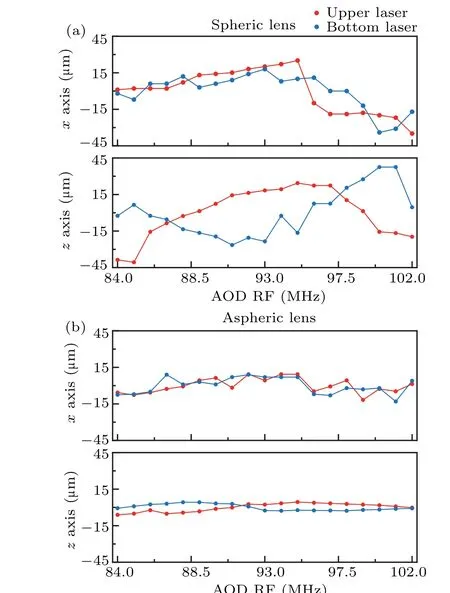
Fig. 3. The measured deviation of the displacement of the accordion beams at the focal point. (a) The upper (black line) and lower (red line)accordion beams’displacement for different RF frequencies using a spherical lens for focusing. (b)Accordion beams’displacement when we use an aspheric lens.
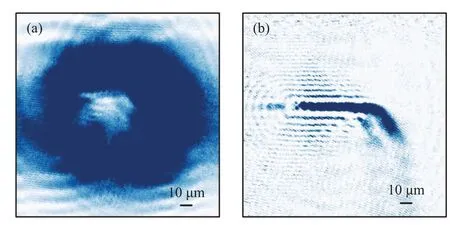
Fig. 4. (a) The absorption image of the poking hole caused by one of the accordion lattice beams at the center of the atomic cloud just before the BEC phase,after 3 ms TOF.(b)Absorption image of the atoms escaping from one side in the accordion lattice after turning off the vertical dipole trap.
In order to align the accordion beams on BEC,an absorption imaging system along thezdirection is used. We block one lattice beam and allow the other beam to interact with the BEC. We observe a hole in the atoms in the short timeof-flight absorption image (Fig. 4(a)), which is produced by only one lattice beam with the blue detuning. We adjust its location in the center of the atomic cloud with the electrically controlled mirror just before the focusing lens (not shown in Fig. 2). Then, we obtain the minimum deviation of the hole during the scanning frequencies of the RF by optimizing the position of the focusing lens mounted on a translation stage.Moreover, the accordion pancakes should be aligned inxzplane,which can be checked by holding the atoms only in the accordion lattice and seeing the atoms escaping from one side of the in-plane potential due to gravity,as shown in Fig.4(b).
A quasi-2D trap needs a weak trap in thexandydirections, which is produced by a red-detuned laser beam(1064 nm) propagating along thezaxis and converged (by a 300 mm focal length spherical lens)at the position of the BEC.
4. Experimental results
We now present the preparation of the 2D BEC in an accordion lattice in detail. The experimental timing sequences are shown in Fig.5.After the evaporative cooling of the atoms by ramping down the power of the crossed optical dipole trap(ODT),[41–43]a 3D BEC in the|F=2,mF=2〉state with a number of 7×10⁵is achieved. We ramp up the power of accordion beams to the maximal value of 640 mW per beam during 50 ms with a maximum accordion lattice periodicity of 26.7 μm for the AOD driving frequency of 106 MHz. After this ramp,the AOD driving frequency is swept from 106 MHz to 90 MHz to compress the atoms. We divide the lattice compression process in 11 linear steps, 106, 105, 104, 103, 102,101, 100, 99, 96, 93, 90 MHz, respectively. The 11th step corresponds to the case of minimum spacing with 3.5 μm. At the same time we change the intensity of the dipole trap laser in each step by decreasing the power of the crossed ODT to zero,and ramping up the power of the vertical 1064 nm beam adiabatically from zero to 20 mW.We ramp the AOD frequencies linearly in each step,thereby ramping up the confinement frequencyωzlinearly. After the vertical trap is ramped to the maximum at step 8,we switch off the horizontal ODT.Finally,the BEC is adiabatically transferred to the single-layer of the accordion lattice as shown in Fig.6(b). Thein situabsorption image(gravity direction)taken along thezaxis is presented in Fig.6(a).
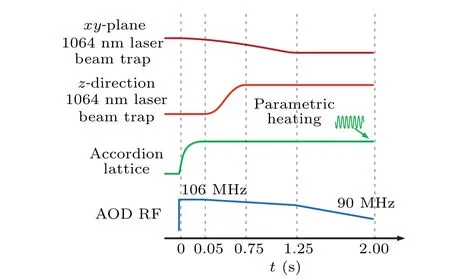
Fig.5. Time sequence for preparing the 2D BEC.The intensities of optical dipole trap laser beams are shown by the red lines while that of the accordion lattice beams is shown by the green line. The green wiggly curve shows the amplitude modulation of the accordion lattice beams to measure the trapping frequencies of the accordion lattice,also called parametric heating method.
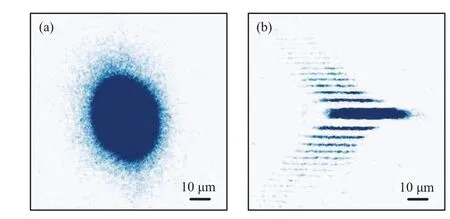
Fig.6. In situ absorption image. (a)Top view(from a high resolution imaging system). (b) Side view (from a horizontal imaging system).The interference fringe is induced by the diffraction of the single layer atoms in the image system.
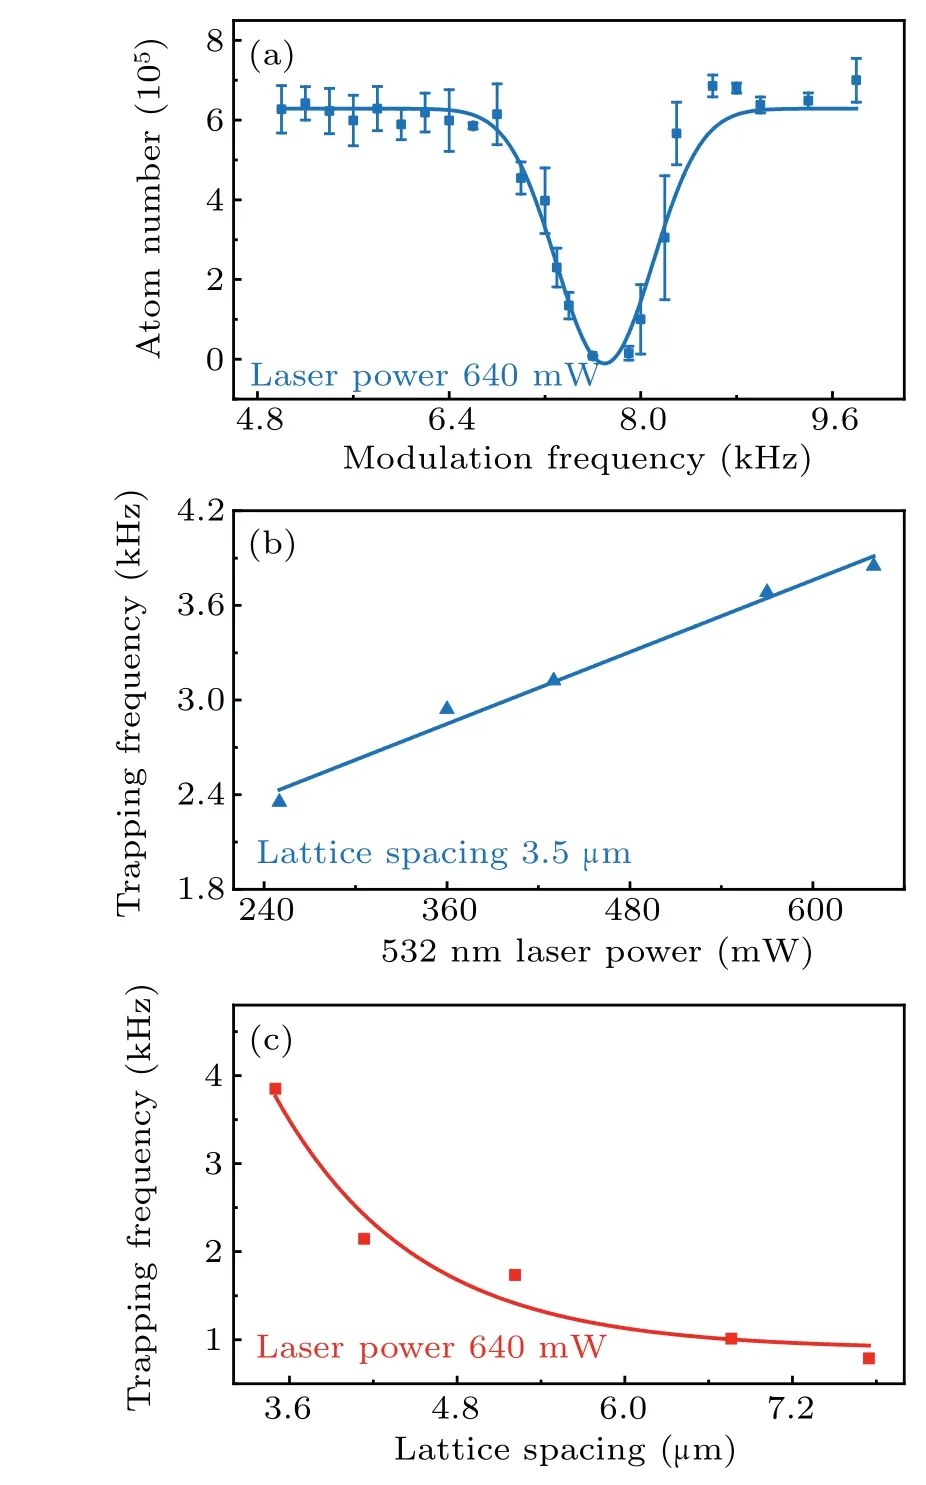
Fig. 7. Measurement of the vertical trapping frequency. (a) Trapping frequency of quasi-2D potential is measured using modulation spectroscopy.The lattice spacing is 3.5 μm and the power of the accordion lattice beam is 640 mW. Every data point is the average of three experiment runs. The solid curve is a Gaussian fit yielding a center frequency of 7.7 kHz. (b)The trapping frequencies as the function of the power of the accordion lattice. (c)The trapping frequencies as the function of the lattice spacing.
We apply the parametric heating method to measure the trapping frequency of the quasi-2D potential. We modulate the intensity of the accordion beams for 800 ms and then measure the atomic loss as the function of the modulation frequency. The results are shown in Fig.7(a). The graph shows a clear parametric resonance at the modulation frequency of 7.7 kHz. In general, parametric resonance is strongest if the drive frequency is close to twice the trap-oscillation frequency.Therefore, the vertical trapping frequency is 2π×3.85 kHz.At the minimum spacing of the accordion lattice, we further study the trap frequencies for various laser powers, as shown in Fig.7(b).The results show that the trap frequency varies approximately linearly as the function of the lattice power. We also measure the trap frequencies with the different spacing of the accordion lattice,as shown in Fig.7(c).
We employ the time of flight absorption imaging method to measure the anisotropy of the BEC in quasi-2D potential.The atom size of the different direction is directly measured by TOF when both the single beam 1064 nm trap and the accordion lattice are turned off simultaneously. Figure 8 shows that the expansions of the cloud size in bothxandzdirections are quite different. The strong confinement inzdirection induces the fast expansion. It is evident from Fig. 8 that BEC confined in 2D potential is anisotropic. Furthermore,we study BEC expansion in the presence of the accordion trap. The single beam 1064 nm trap is turned off first and the atoms are left to diffuse with a certain time in the presence of the accordion trap alone. At last, we take absorption imaging with the accordion lattice as shown in Fig.9. Owing to the difference of trapping frequencies between the accordion lattice and optical dipole trap,the expansion rates have little difference along thexandyaxes.
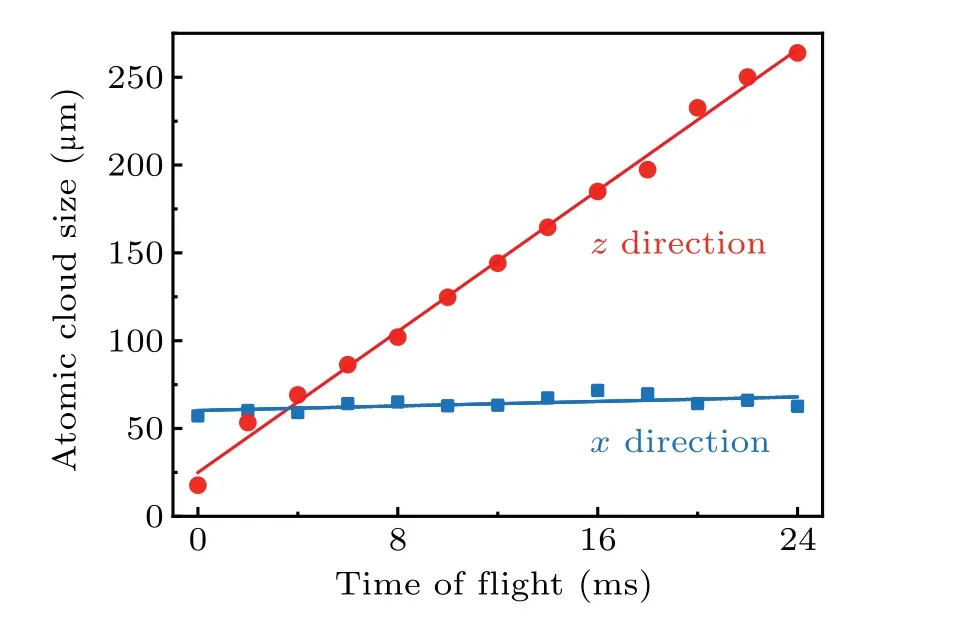
Fig.8. The anisotropy of the atomic cloud at various TOFs. The measured atomic cloud sizes along the x and z axes taken by horizontal imaging.
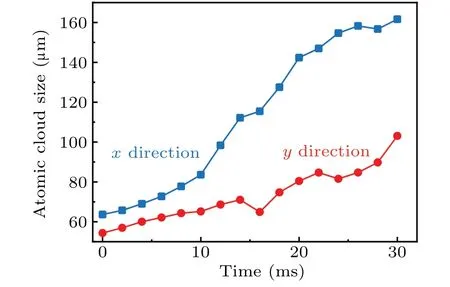
Fig.9. Experimental observation of the expansion of BEC in accordion lattice. The measured atomic cloud sizes along the x and y axes when turning off the 1064 nm single beam trap and keeping the accordion lattice on until the absorption imaging finished.
5. Conclusion
We have presented the design of an accordion lattice in detail, including the crucial optical elements, the optimization procedure, and stabilization of the two accordion lattice beams. By using an active feedback for the intensity of the lattice beam, almost all atoms can be loaded into a single layer. With 2 seconds of adiabatic compression, a quasi-2D BEC is created. In addition,we have measured the anisotropy of the accordion lattice using the conventional TOF method.Recently, we realized atomic BEC in twisted-bilayer optical lattices based on this system.[44]In the future,we may use this setup to study BKT phase transition,Anderson localization in disordered potential,and dynamic phenomena in 2D ultracold atoms.
Acknowledgements
Project supported by the Innovation Program for Quantum Science and Technology (Grant No. 2021ZD0302003),the National Key Research and Development Program of China(Grant Nos.2016YFA0301602,2018YFA0307601,and 2021YFA1401700), the National Natural Science Foundation of China (Grant Nos. 12034011, 92065108, 11974224,12022406, and 12004229), the Natural Science Basic Research Plan of Shaanxi Province, China (Grant No. 2019JQ-058), and the Fund for Shanxi “1331 Project” Key Subjects Construction.
猜你喜欢
郭沫若学刊(2019年1期)2019-04-03
郭沫若学刊(2019年1期)2019-04-03
民族文学(2019年3期)2019-03-29
消费电子(2015年11期)2015-09-10
- Chinese Physics B的其它文章
- Formation of high-density cold molecules via electromagnetic trap
- Dynamics of molecular alignment steered by a few-cycle terahertz laser pulse
- Terahertz spectroscopy and lattice vibrational analysis of pararealgar and orpiment
- Molecule opacity study on low-lying states of CS
- Finite-time Mittag–Leffler synchronization of fractional-order complex-valued memristive neural networks with time delay
- Ultrafast Coulomb explosion imaging of molecules and molecular clusters