
Unsteady detonation with thermodynamic nonequilibrium effect based on the kinetic theory
2023-09-28 06:22XianliSuandChuandongLin
Xianli Su and Chuandong Lin
Sino-French Institute of Nuclear Engineering and Technology,Sun Yat-sen University,Zhuhai 519082,China
Abstract
In this paper,unsteady detonation is simulated and investigated from the viewpoint of kinetic theory.The deviations of the velocity distribution function from the equilibrium state are studied in the evolution of detonation.It has been discovered that the characteristics of the deviation around the detonation wave are significantly different from those in the post-wave region.Besides,the kinetic moments of the reaction term have been simulated,verified and analyzed in detail.In addition,the reaction manifestation is defined to describe the global effects of kinetic moments due to chemical reactions.It is interesting to find that there are three types of periodic oscillations of the reaction manifestation during the evolution of the unsteady detonation.Via the fast Fourier transform,it can be seen that the reaction manifestation is mainly composed of several signal frequencies.Moreover,the impact of rate constants of the two-step reaction scheme on the reaction manifestation is studied,and the influence of chemical heat is investigated as well.
Keywords: unsteady detonation,chemical reaction,kinetic theory,discrete Boltzmann method
1.Introduction
Detonation is a kind of supersonic combustion where a chemical reaction is coupled with shock dynamics [1,2].Detonation is the key factor causing catastrophic damage in various explosion accidents,such as gas explosions [3].Besides,detonation has been widely used in aerospace,defense,mining,and demolition applications [4-6].In view of its importance,detonation has been researched by experimental [7-10],theoretical [11,12],and numerical methods[13-17].Especially,with the rapid development of computer technology and computational fluid dynamics,numerical simulation has become an indispensable method to study detonation [2,18].However,the evolutionary process of detonation involves complex physicochemical phenomena[11,12].During the evolution of the detonation,the chemical reaction and hydrodynamic processes interact with each other,which produces various interfacial and mechanical structures,and contains a wealth of hydrodynamic and thermodynamic nonequilibrium effects [19].Therefore,the accurate prediction and effective control of detonation are still open issues.
In recent years,the kinetic methods based on the Boltzmann equation have become a popular mesoscopic simulation approach in various fields [20-23].In particular,the discrete Boltzmann method(DBM)[24,25]is suitable for supersonic waves with essential nonequilibrium effects,such as the steady or unsteady detonation.A finite number of velocities is employed to discretize the Boltzmann equation in the modeling of DBM.Thanks to its finite discrete velocities and distribution functions,the DBM owns a high computational efficiency [24,26].Moreover,the hydrodynamic and thermodynamic nonequilibrium effects beyond the macroscopic governing equations can be obtained and quantified as the higher-order kinetic moments in the DBM[27].Therefore,as a mesoscopic kinetic model,the DBM not only inherits the function of the Boltzmann equation to recover the macroscopic transport equations in the continuous limit,but also has the ability to capture the thermodynamic nonequilibrium effects beyond the macroscopic equations.The DBM has been widely utilized to obtain some deeper insights into nonequilibrium behaviours in various complex fluids and has excellent applications in the analysis of nonequilibrium,nonlinear,transient complex flow systems [22-27,29].
Recently,the DBM has achieved remarkable success in simulating combustion and detonation [24,25,30-38].The pioneering DBM for detonation [30] was presented by Yan et al who adopted the Lee-Tarver model [39] to control the chemical reaction.In 2014,Lin et al [31] proposed a novel polar coordinate DBM and investigated typical implosion and explosion processes.In 2015,Xu et al presented a twodimensional multiple-relaxation-time model [32] and studied the hydrodynamic and thermodynamic nonequilibrium in the process of steady detonation.In 2016,a double-distributionfunction DBM for combustion and detonation was constructed by Lin et al [33],where the chemical reactant is described by one distribution function,and the chemical product by the other distribution function.Then,Lin et al reported a multi-component DBM for premixed,nonpremixed,or partially premixed nonequilibrium reactive flows [35].In 2019,Lin et al developed a multiple-relaxation-time DBM for unsteady reactive flows[24],where the specific heat ratio and Prandtl number are adjustable.In 2020,Lin et al simulated unsteady detonation with essential hydrodynamic and thermodynamic nonequilibrium effects,and studied the impact of the perturbation amplitude,wavelength,and chemical heat release on the physical field of unsteady detonation with nonequilibrium effects[25].Next,a three-dimensional DBM for the simulation of detonation was developed by Ji et al[36],and they captured the features of the three-dimensional detonation via the DBM[37].Very recently,Su et al recovered the particle velocity distribution function of reactive flows from the gas kinetic theory and investigated the higher-order kinetic moments and nonequilibrium quantities around the detonation wave by using the DBM [38].
In the present study,we carry out more in-depth and comprehensive research on unsteady detonation via the DBM.In section 2,the details of the modeling construction are presented.Then,the DBM is employed to simulate the unsteady detonation.The deviation of the velocity distribution function from the equilibrium state and the kinetic moments of the reaction term are studied in section 3.Reaction manifestations in moment space are investigated from a kinetic perspective in section 4.Finally,section 5 provides a summary.
2.Discrete Boltzmann model
The DBM is based on the following equation,
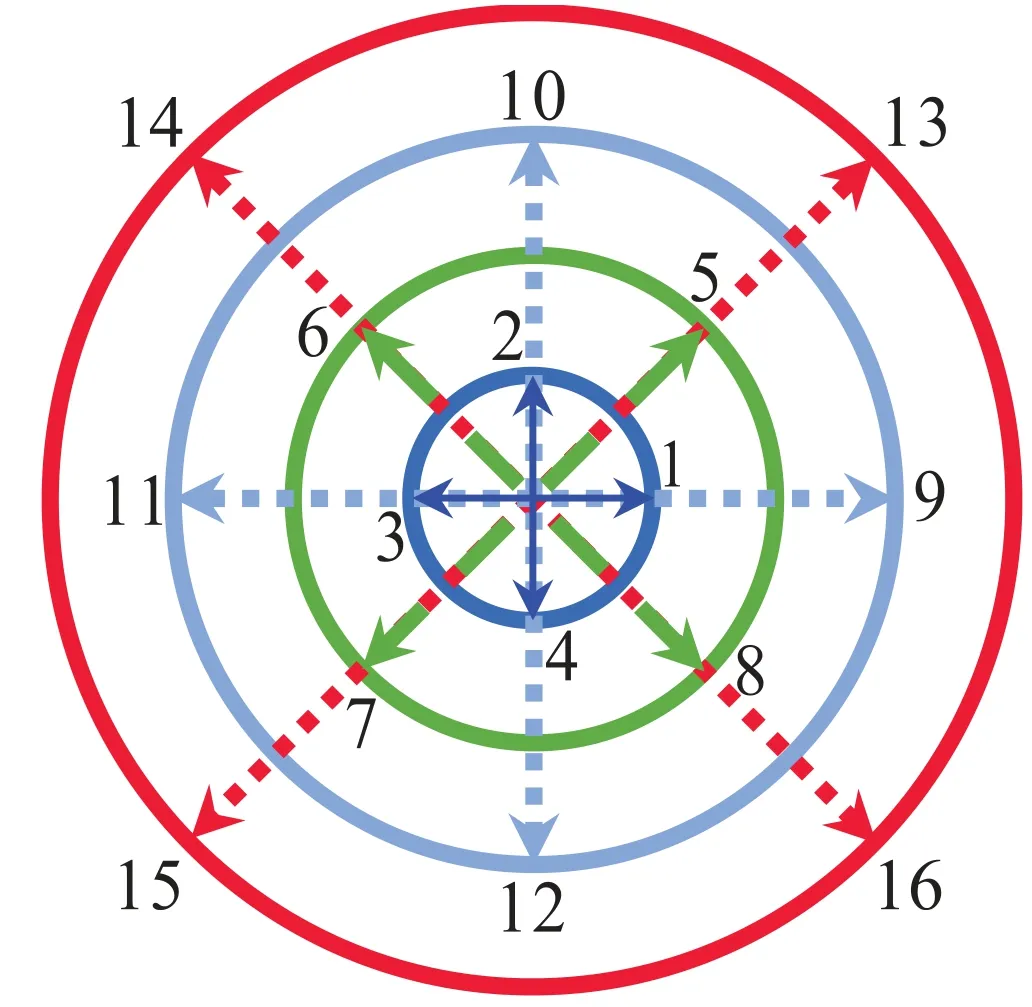
where τ denotes the relaxation time,t the time,fiandfieqrepresent the discrete distribution function and its equilibrium counterpart,respectively.Moreover,videnotes the discrete velocity with i=1,2,3,…,N,and N=16 is the total number of discrete velocities.Here a two-dimensional sixteen-velocity model is utilized,see figure 1.
In especial,the original expression of equilibrium distribution function feqis as follows [24]
where n,u,and T represent the particle number density,flow velocity and temperature,respectively.Besides,D=2 denotes the dimension,I counts extra degrees of freedom due to vibration and/or rotation,and η is used to describe the corresponding vibrational and/or rotational energies.
On the right-hand side of equation (1),Riindicates the reaction term describing the change rate of the distribution function due to chemical reactions.In this paper,a two-step reaction scheme is employed to control the chemical reaction process [40],
The first step in equation (3) denotes a thermally neutral induction zone or ignition process,and the second step in equation (4) describes the rapid energy release after the branched-chain thermal explosion.ξ′ denotes the change rate of the reaction progress variable in a thermally neutral induction period,whileλ′ is the change rate of the mass fraction of the chemical product.Besides,Tsis the temperature after the preshock wave.EIand ERrepresent the activation energies.KIand KRindicate the rate constants.
Under the assumption that the time scale of molecular collisions < the time scale of chemical reactions < the characteristic time scale of flows,the original reaction term can be obtained [38],
where Q indicates the chemical heat release per unit mass of chemical reactant.
In this work,in order to recover the Navier-Stokes (NS)equations,the following moment relations should be satisfied,
with the particle velocities Ψ=1,v,(v·v+η2),vv,(v·v+η2)v,vvv,(v·v+η2)vv,and the corresponding discrete velocities,Ψi=1,vi,(vi·vi+η2i),vivi,(vi·vi+ηi2)vi,vivivi,(vi·vi+ηi2)vivi.Substituting equations (2) into (6) leads to an explicit expression:
where M is a 16×16 square matrix bridging the velocity and moment space,consisting of the functions of the discrete velocities.In addition,feqandHfeqare matrix expressions of the equilibrium distribution function in velocity and moment space,respectively.The details are in appendix A.
Similarly,the reaction terms follow the relations,
The elements of Ψ and Ψiare the same as those in equation (6).Substituting equations (5) into (8) results in,HR=MR,where R and HRcorrespond to the matrices of reaction term in velocity and moment space,respectively.Hence,
where M−1is the inverse of M.Mathematically,the matrix HRis expressed byHR=(HR1HR2…HR16)T.Physically,HR1represents the change rate of mass density due to chemical reactions.HR2and HR3describe the corresponding change rate of momentum in the x and y directions,respectively.HR4indicates the change rate of energy because of the chemical reactions.HR5,HR6and HR7describe the change rate of nonorganised momentum fluxes due to chemical reactions.HR8,HR9,HR10,HR11,HR12,and HR13are related to the change rate of nonorganised energy fluxes due to chemical reactions.HR14,HR15,and HR16correspond to the change rate of the fluxes of nonorganised energy fluxes due to chemical reactions.
3.Investigation of unsteady detonation
In this section,the DBM is employed to simulate the onedimensional unsteady detonation.The initial configuration,obtained from the Hugoniot relation,takes the form
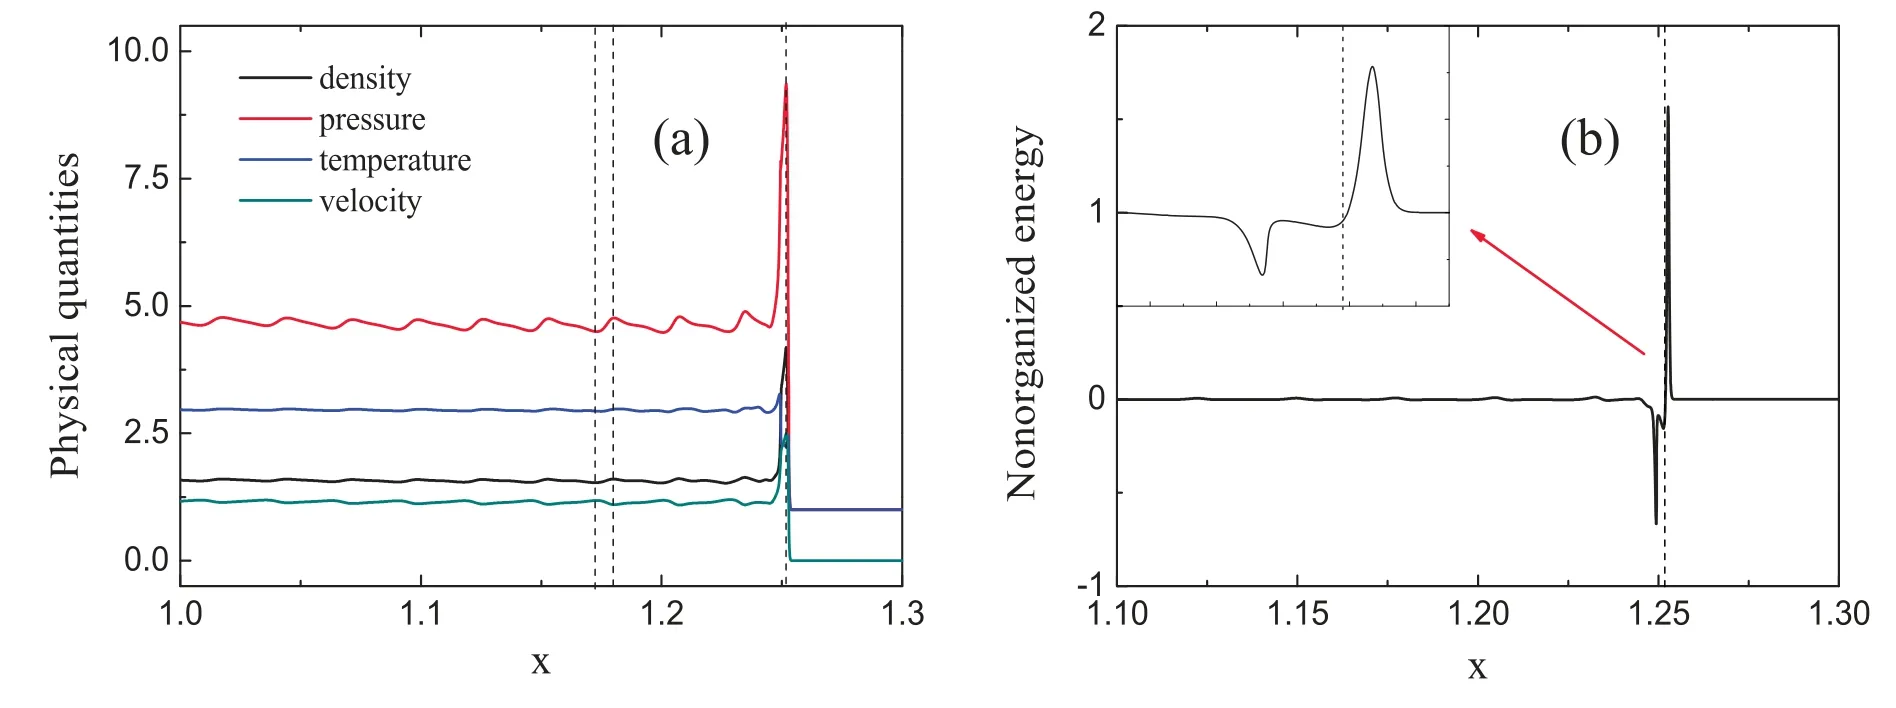
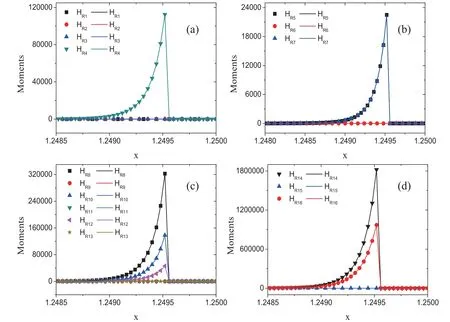
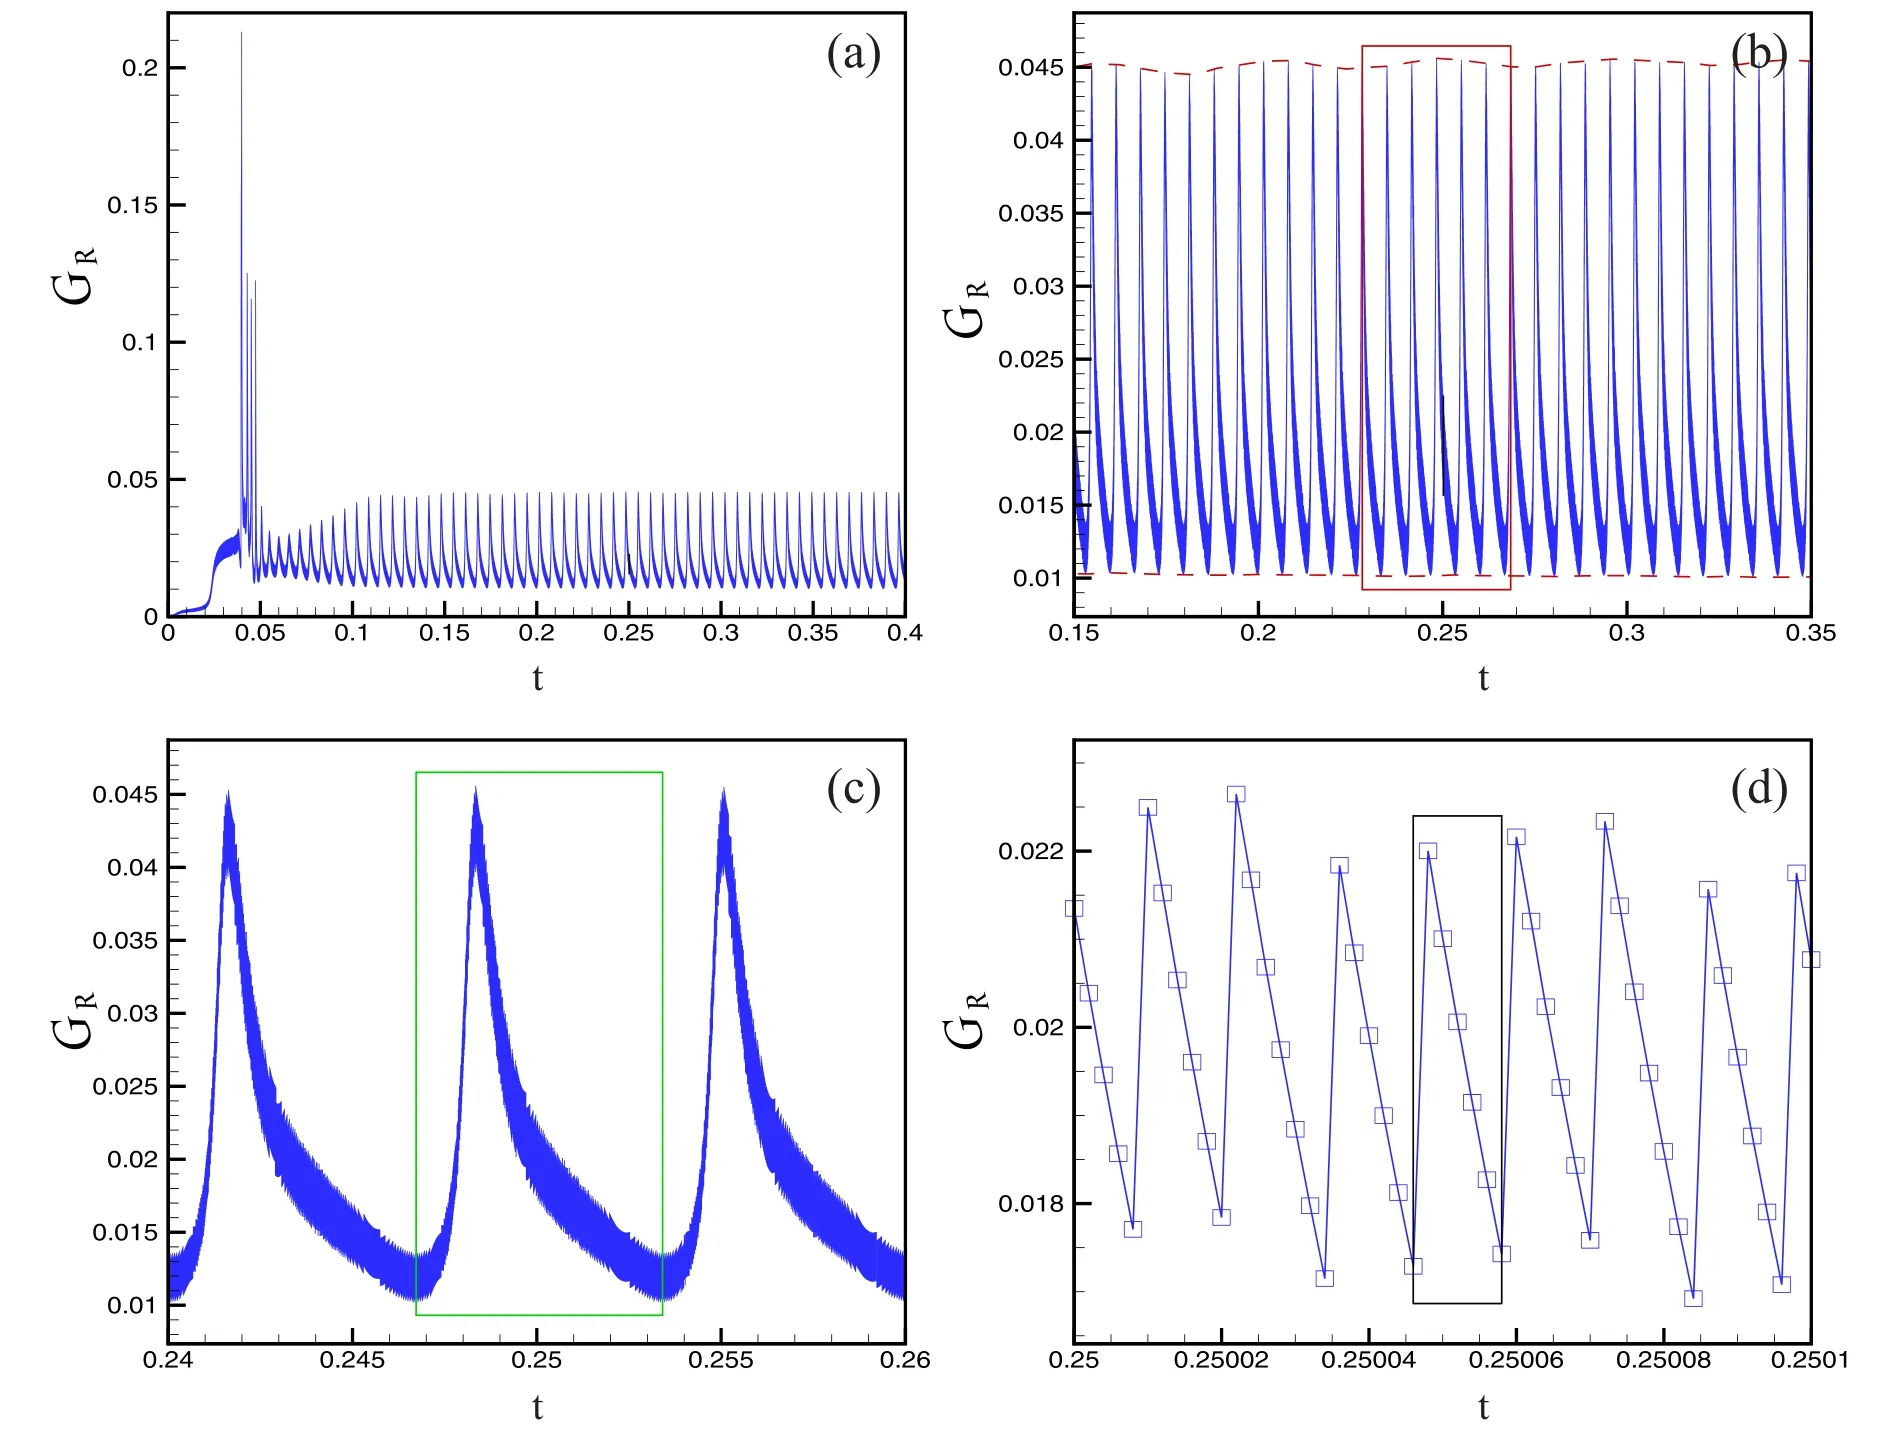
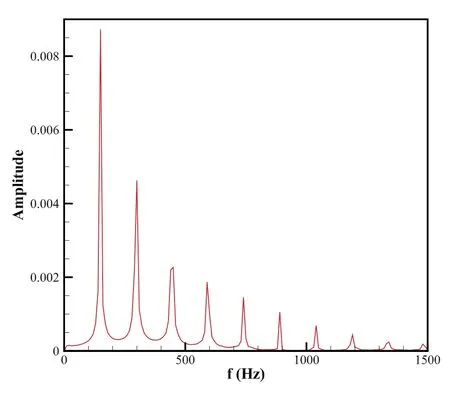
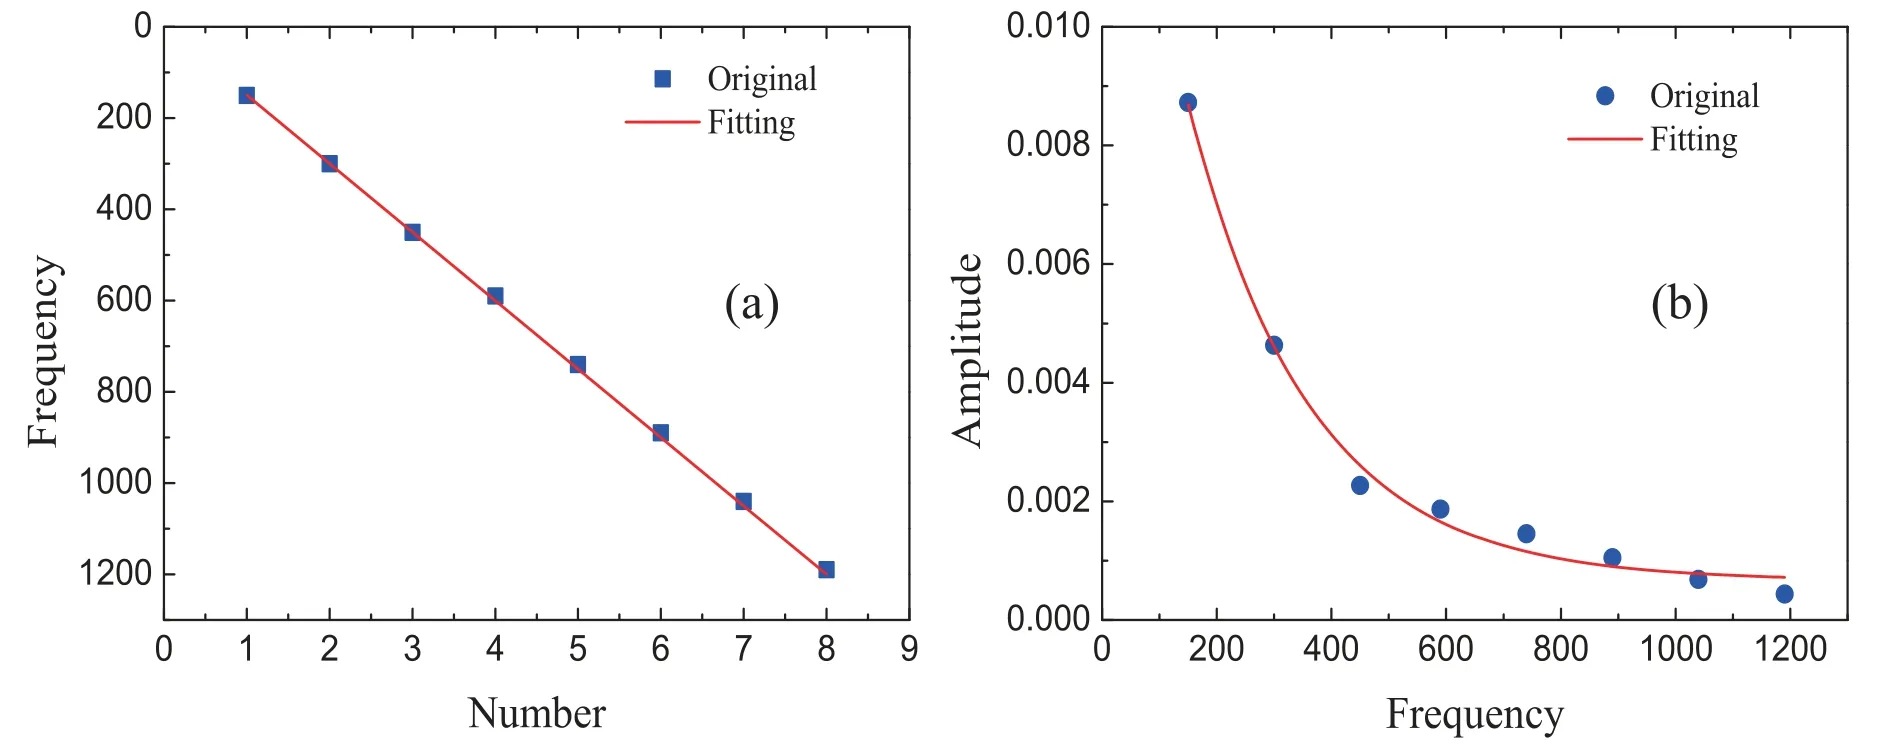
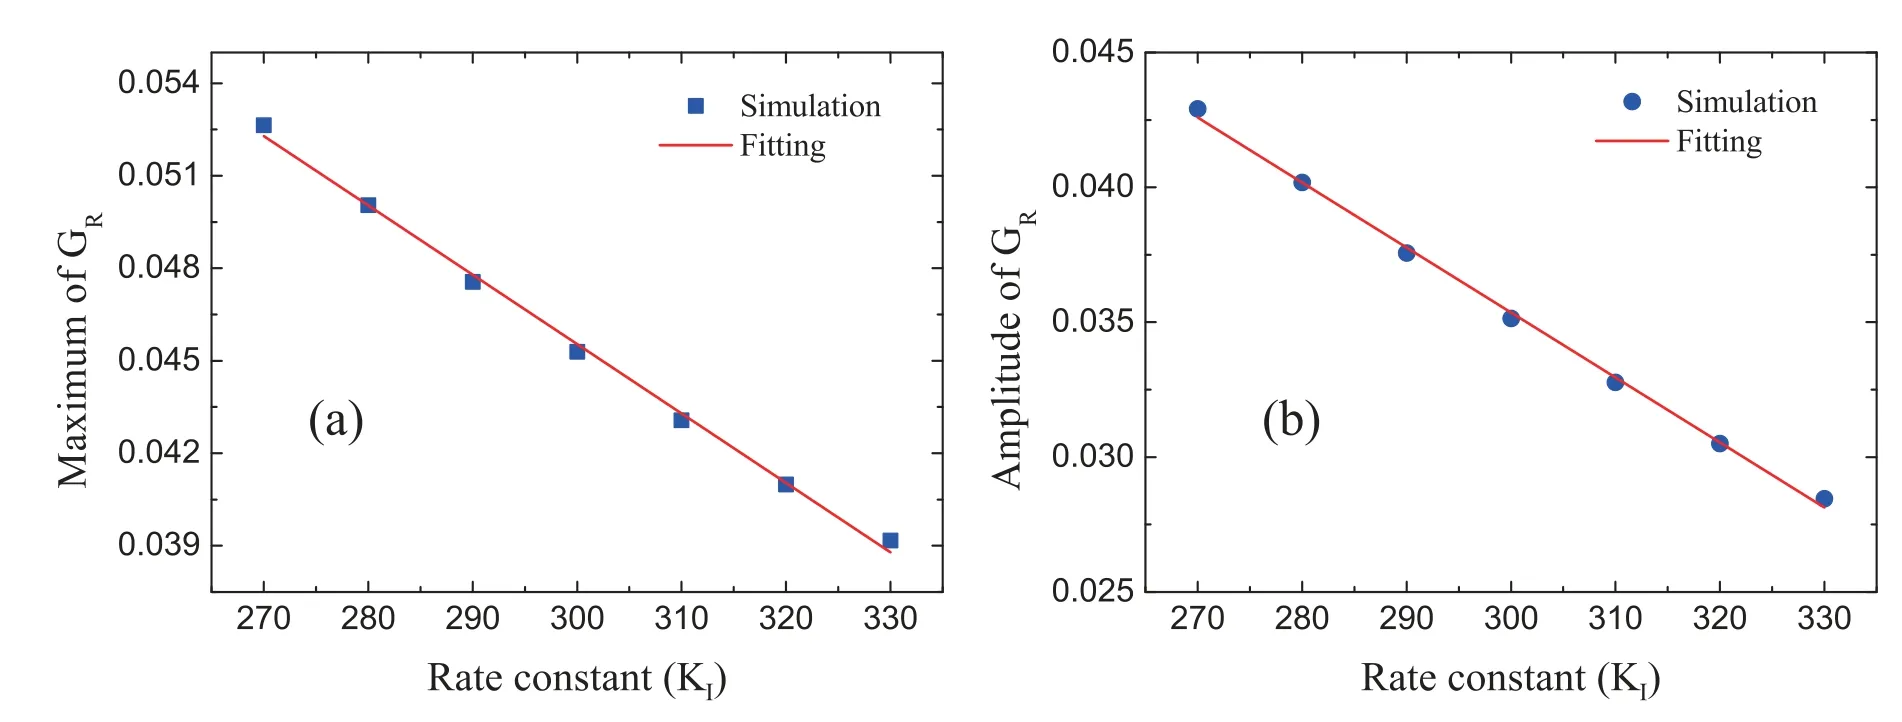
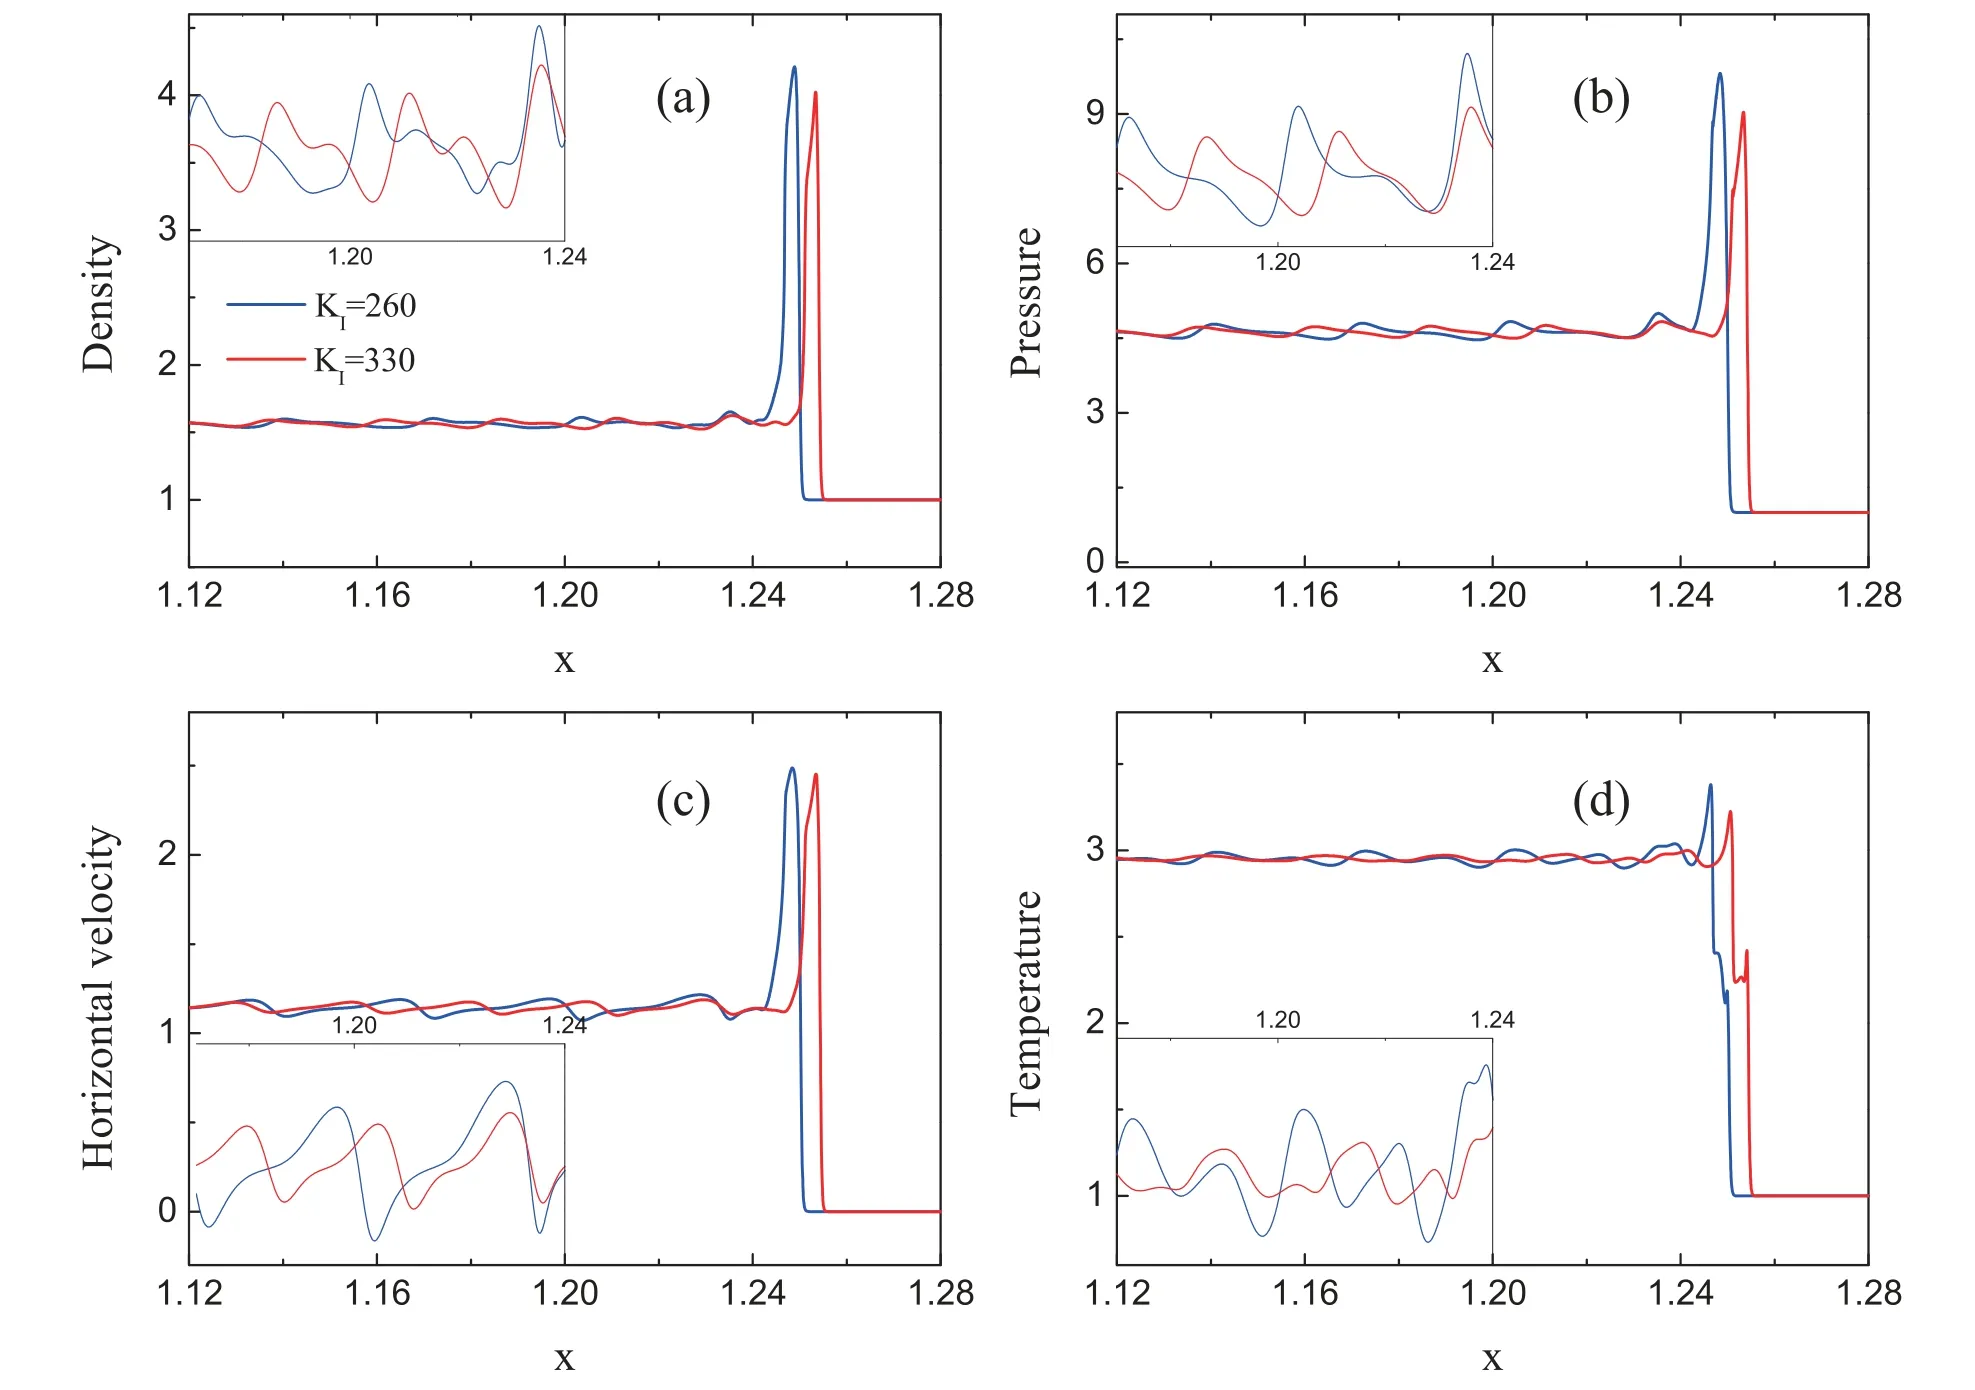
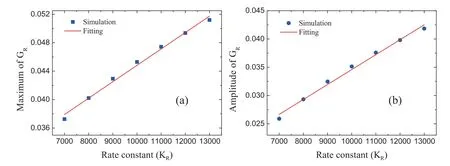
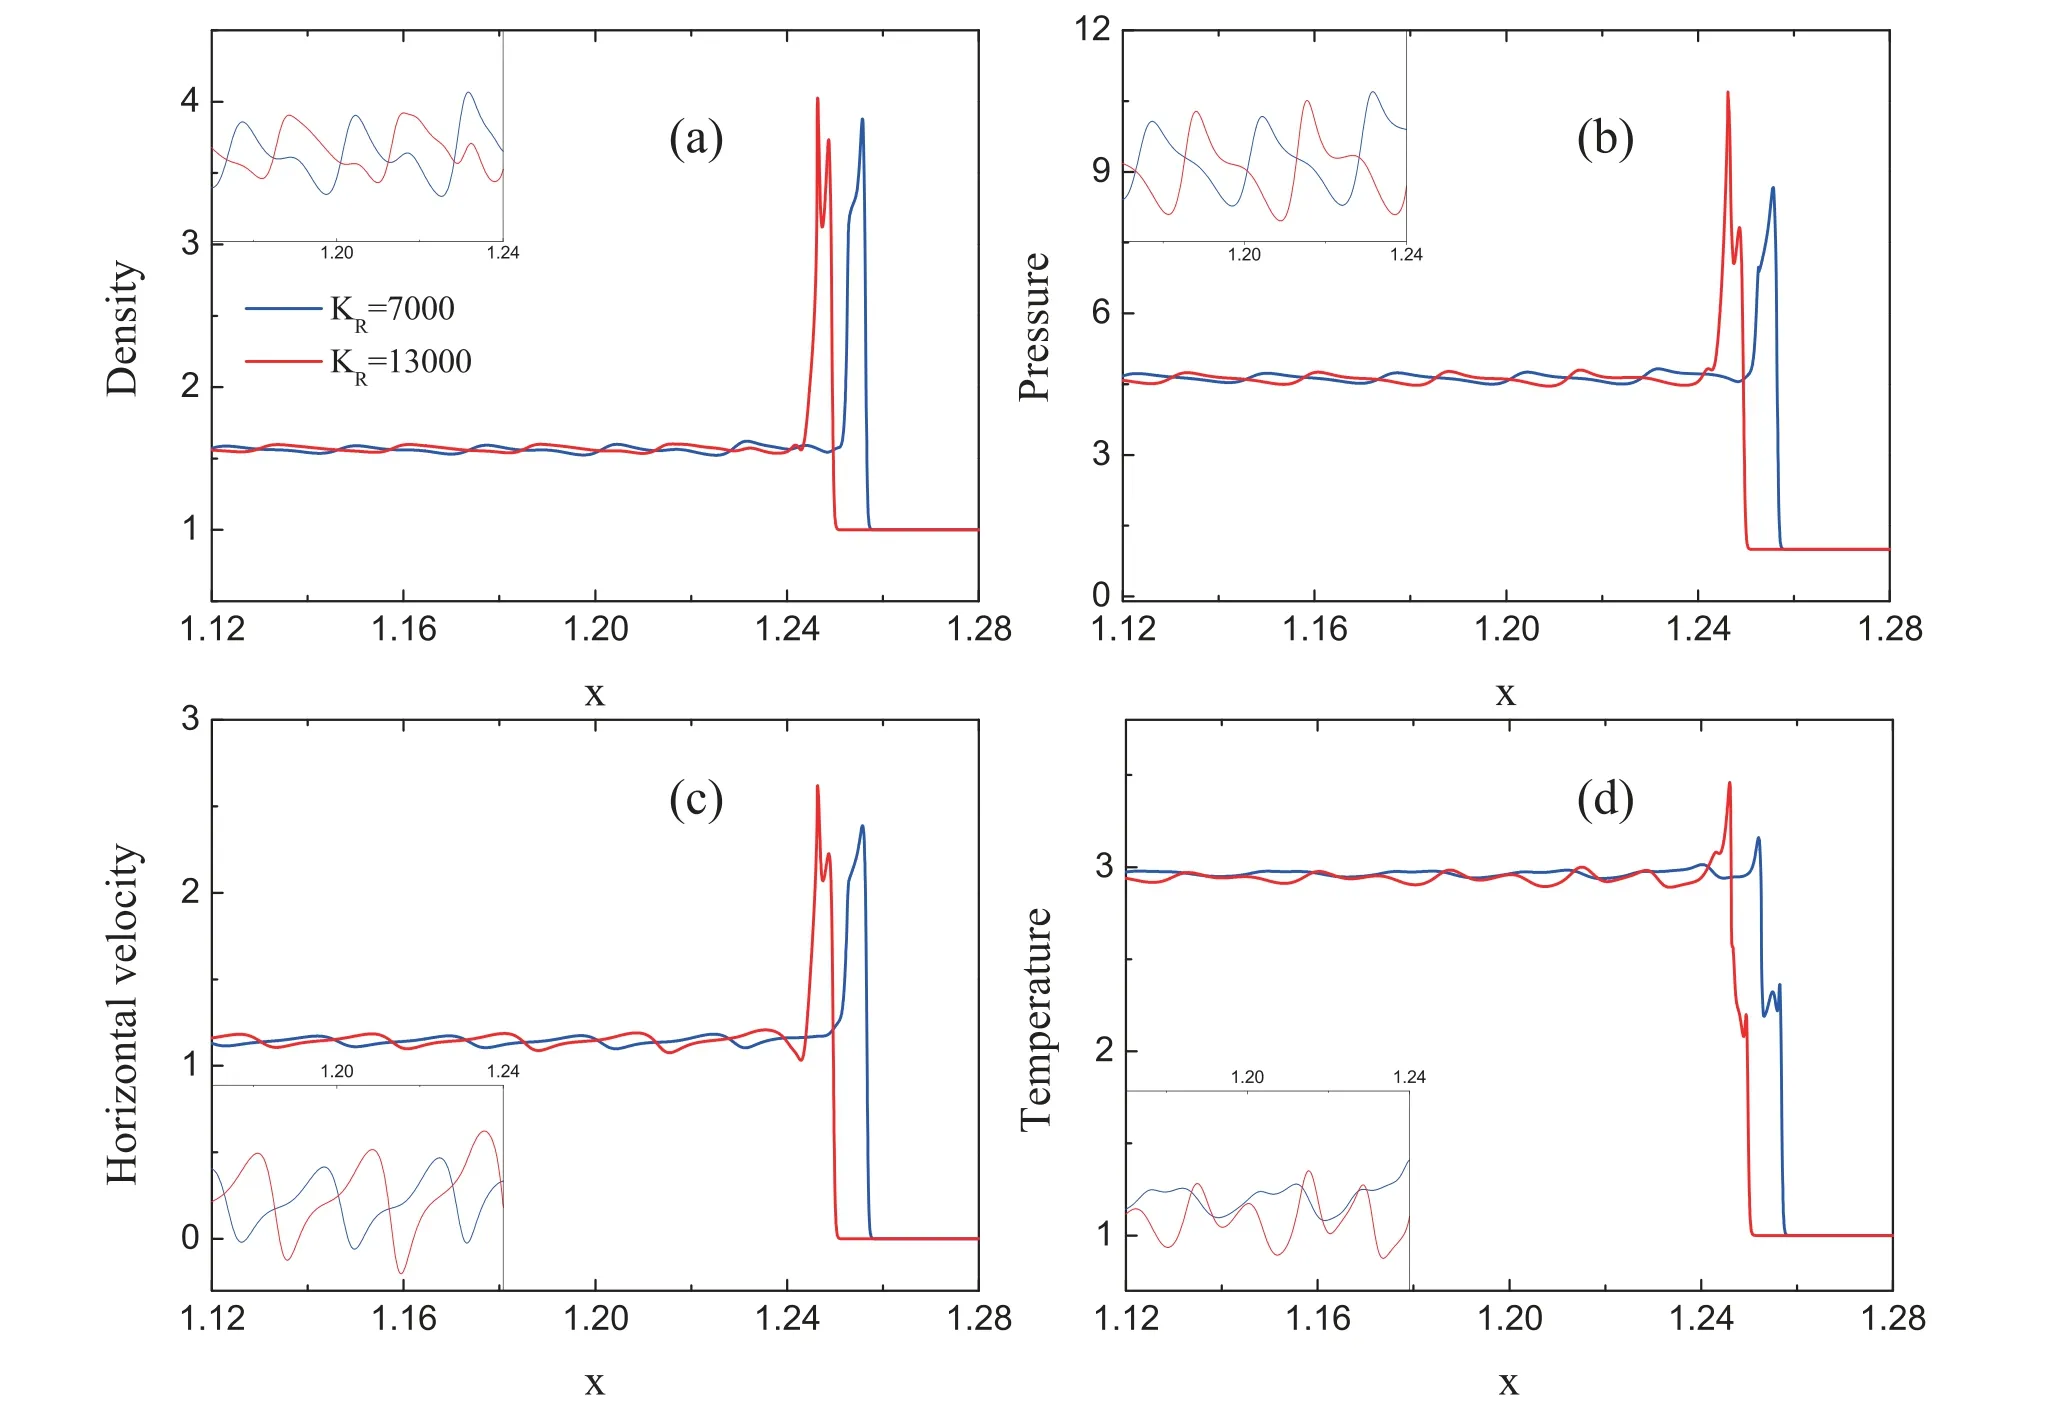
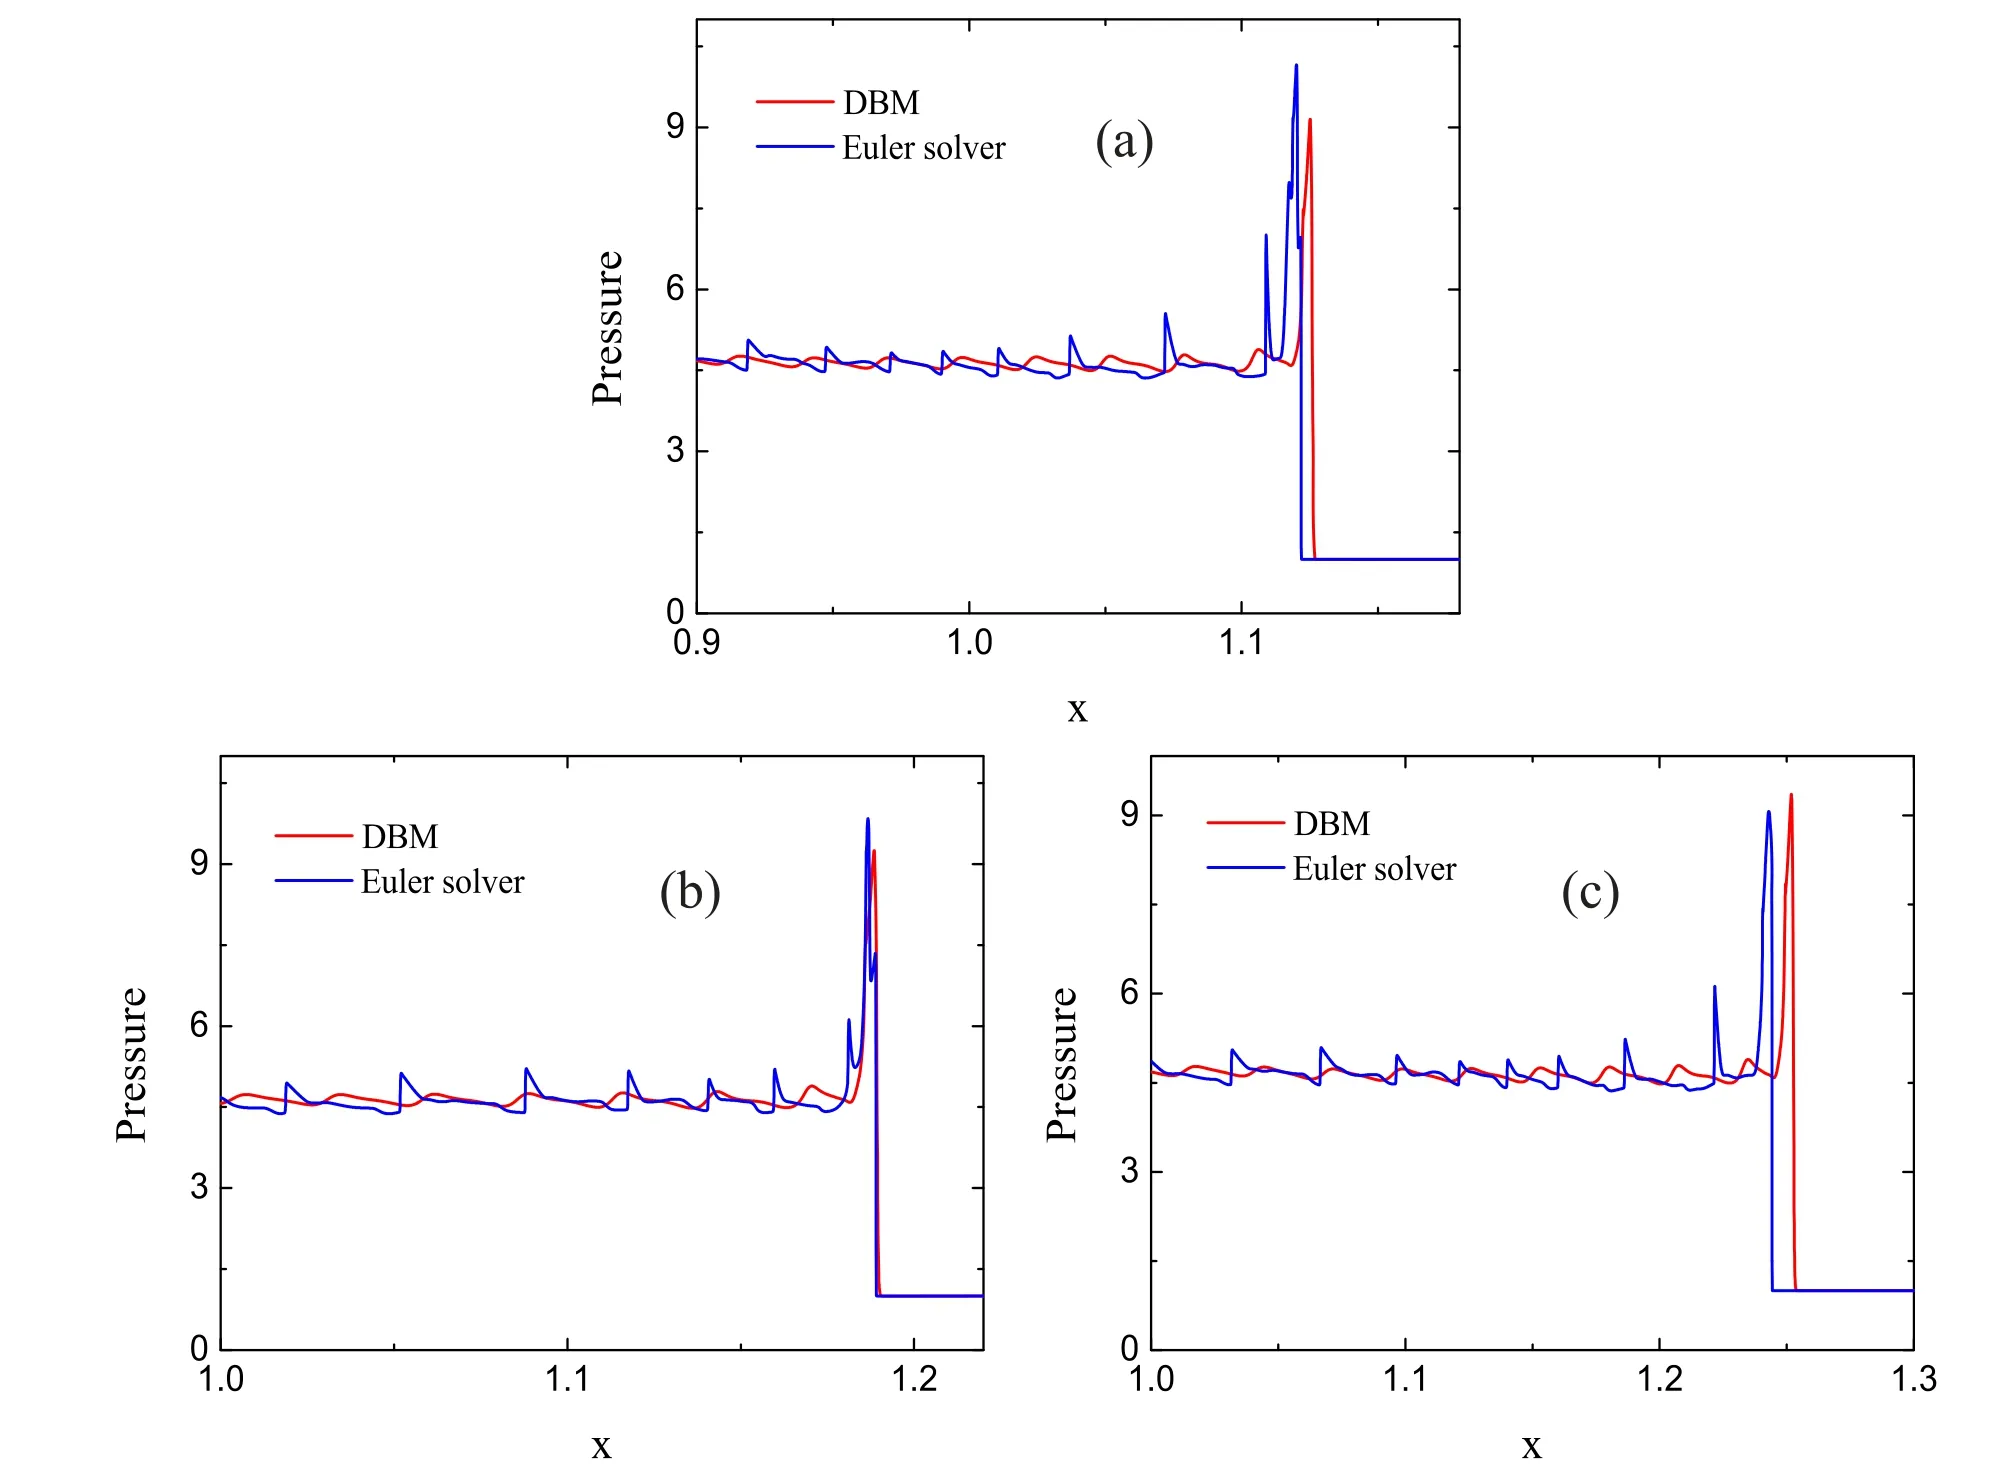
where the subscript L indicates 0 ≤x ≤0.01,and R indicates 0.01 The pressure,temperature,density and horizontal velocity are illustrated in figure 2(a).Obviously,as the detonation wave propagates from left to right,the macroscopic physical quantities in the medium first rise drastically and then fall sharply to form a high peak.Then there are regular fluctuations after the peak.The three dashed lines in figure 2(a)denote the locations x=1.1724,x=1.1799,and x=1.2518,respectively. Figure 2(b) exhibits the nonorganized energy in the x direction.The inset shows the corresponding profiles within the spatial range 1.245 Next,let us investigate the velocity distribution function of unsteady detonation.In [38],via the Chapman-Enskog analysis,the local particle velocity distribution function of reactive flow is derived from the gas kinetic theory.In short,on the NS level,the local particle velocity distribution function reads where feqis the equilibrium particle velocity distribution function,and fneqis the deviation of the velocity distribution function from the equilibrium state.Besides,fneqcan be written as [38], From equations(10)and(11),it can be seen that both spatial gradients and reaction term make contributions to the deviation of the local velocity distribution function from the equilibrium state,while the velocity distribution function is composed of the equilibrium particle velocity distribution function and the corresponding deviation counterpart. Next,we conduct an in-depth study of fneq.Since the macroscopic quantities show regular oscillations in figure 2,we first investigate the deviations at a trough (x=1.1724) and a peak (x=1.1799) of the pressure in the region after the detonation front,and the position of the highest peak(x=1.2518)of pressure around the detonation wave is also researched.To this end,figure 3 depicts the deviation of the particle velocity distribution function from the equilibrium statefneq=fneq(vx,vy)in the left column and corresponding contours in the velocity space(vx,vy)in the right column.To be specifci,fgiures 3(a)and(b)exhibit the deviation fneqand its corresponding contour at the valley of the pressure.Figures 3(c) and (d) display the deviation fneqand the relevant contour at the peak of the pressure.Besides,the deviation fneqand its contour at the position of the highest peak of pressure around the detonation wave are drawn in figures 3(e) and (f),respectively. As shown in figures 3(a) and (c),there are both positive and negative deviations.Figure 3(a) depicts that along the vxdirection,a deep negative valley first appears,and then there is a positive peak,afterwards it decreases to form a shallow negative valley.On the contrary,there is an opposite trend in figure 3(c).Firstly,a small positive peak appears,then drops to a negative trough,and later it increases to a high positive peak.Meanwhile,it is interesting to note that the curves of figures 3(b) and (d) look quite similar to each other.Both structures are composed of three parts,and the corresponding shapes of the three parts are the same.However,the difference between figures 3(b)and(d)mainly lies in the values of each contour line,especially whether the values are positive or negative.Specifically,from left to right,the values of three parts of figure 3(b) are first negative,then positive,and finally negative,which is consistent with the trend of figure 3(a).Similarly,the values of the three parts in figure 3(d) are consistent with the trend of figure 3(c),which contains positive,negative,and positive parts.Moreover,From the three-dimensional view,figures 3(e) looks like a bulging positive circle surrounding a negative valley.Besides,it can be found from the contour that figure 3(f) is symmetric in the vxand vydirections. In sum,it can be found in figure 3 that the characteristics of the deviation near the wavefront of the detonation are significantly different from those in the post-wave region.Besides,the nonequilibrium intensity around the detonation wave is much greater than that in the post-wave region.Moreover,in the post-wave region of the unsteady detonation wave,the deviation of the particle velocity distribution function from the equilibrium state changes with the macroscopic quantities and nonorganized energy. It should be pointed out that the DBM is a mesoscopic kinetic method,so the chemical reaction of unsteady detonation can be studied from the kinetic moment viewpoint.Figure 4 depicts the sixteen moments of reaction term HR. Figure 4(a) exhibits the profiles of moments of reaction term HR1to HR4.The symbols denote the DBM results,and the solid lines represent the theoretical solutions.Clearly,the simulation results are in nice agreement with the theoretical solutions.Besides,it can be seen that during the evolution of unsteady detonation wave,HR1,HR2and HR3keep zero due to the conservation of mass and moment.HR4first increases sharply and then decreases smoothly,and forms a towering asymmetric peak.The reason is that there is violent chemical heat released around the detonation wave. Figure 4(b) displays the moments of reaction term HR5,HR6and HR7.It is obvious that HR6is zero,while HR5and HR7first grow and then decline,forming a positive crest.Besides,the trends of HR5and HR7are exactly the same,which is also consistent with the theoretical solutionsHR5=ρT′ andHR7=ρT′. The patterns of moments of reaction term HR8,HR9,HR10,HR11,HR12,and HR13are shown in figure 4(c).Clearly,HR9,HR11,and HR13keep zero,while HR8,HR10,and HR12all increase first and then drop sharply.Moreover,the peak of HR8is higher and wider than HR10,and the peak of HR12is thinner and lower than HR10.The evolution in figure 4(c) is in accordance with the theoretical solutionsHR8=(D+I+2)ρuxT′,HR9=(D+I+2)ρuyT′,HR10=3ρuxT′,HR11=ρuyT′,HR12=ρuxT′,andHR13=3ρuyT′,respectively. The rest change rate of the fluxes of nonorganized energy flux due to chemical reactions HR14to HR16is plotted in figure 4(d).Similarly,HR15keeps zero as the detonation wave propagates from left to right,while HR14and HR16show positive peaks.In addition,the peak of HR14is taller and wider than HR16.The theoretical solutionsHR14=ρ[ 2T(D+I+2)+(D+I+5)ux2+uy2]T′,HR15=ρuxuy(D+I+4)T′,andHR16=ρ[2T(D+I+2)+ux2+(D+I+5)uy2]T′ explain the variation patterns of figure 4(d). In order to have a better understanding of chemical reactions of unsteady detonation from the perspective of kinetic moments,the reaction manifestation GRis defined to describe the global effects due to the chemical reaction in moment space where the integral is over the whole computational domain.It should be mentioned that it is a coarse-grained way to investigate physical characteristics and reaction manifestations by using equation(12),which denotes the magnitude of the quantity in the moment space(HR1,HR2,...,HR16).That is to say,the mathematical expression of equation (12) consists of 16 independent variables. Figure 5 shows the evolution of the reaction manifestation in moment space.Figure 5(a)shows the whole process of reaction manifestation,it can be seen that when t<0.1,the reaction manifestation changes very drastically,in especial,an extremely high peak was observed around t=0.04.After t>0.15,the reaction manifestation begins to show regular oscillations.In figure 5(b),the red dashed lines represent the envelope curves.From the upper envelop curve,it can be seen that the maximum of reaction manifestation displays a periodic small change when t>0.15.One cycle of the first type of periodic oscillation is shown by the red rectangular frame,and the first cycle is about T1=0.040 28.Then,we further narrow the time scale of the observed reaction manifestation.Figure 5(c)illustrates the second type of cycle of the reaction manifestation around T2=0.006 69,i.e.the pattern of change from a valley to a peak,and one of the cycles is displayed by the green rectangular frame.Besides,after partially zooming in figure 5(c),we see that the data points which are plotted by hollow squares also seem to evolve with a much smaller period from figure 5(d),i.e.they alternate in groups of about seven points.Similarly,one cycle of the third period is about T3=0.000 012 signed by the black rectangular frame. As shown in figure 5,there are three types of periodic changes in the reaction manifestation in the moment space of unsteady detonation during the post-stabilization evolution.Therefore,the fast Fourier transform is introduced to deal with the reaction manifestation in figure 5(b).Figure 6 illustrates the amplitude versus frequency f(HZ).It is apparent that there are many peaks in various frequencies.As the frequency increases,the amplitude decreases gradually.The first eight peaks are more distinct,which denotes that the reaction manifestation is composed mainly of the first several groups' signal of different frequencies. In addition,the specific frequency and corresponding amplitude are shown in table 1.The first line denotes the number of the first eight frequencies,and the second and third lines give the values of the corresponding frequency and amplitude,respectively.It can be found from the table that the frequencies are all roughly multiples of f=150 (HZ). The data in table 1 are fitted to further explore the relations among the number,frequency,and amplitude.Figure 7(a)depicts the values of frequency versus the number of frequency.The squares denote the numerical data,and the solid line represents the fitting function f=150n,where f and n stand for the frequency and number,respectively.It is evident that the original data agree well with the fitting solutions in figure 7(a),which means that the reaction manifestation may consist of a superposition of frequencies of different multiples of f=150 (HZ).Figure 7(b) displays the amplitude (A) versus frequency.In the same way,the circles represent the numerical data,and the line is for the fitting functionA=0.01637 ×exp(-f/210.9455).From the ftiting result,it can be seen that there is an exponentially decreasing relationship between the frequency and amplitude.The amplitude decreases exponentially as the frequency increases. Next,let us study the effects of different physical factors on the reaction manifestation in the detonation process.We focus on the changes in the maximum and amplitude of the reaction manifestation.In fact,the bifurcation boundary between steady and unsteady detonations depends on the ratio of the length of the heat release layer to that of the induction zone layer [40,41].Generally,the length of the induction zone can be adjusted by adjusting KI,meanwhile,the length of the heat release layer can be determined by KR.The two rate constants play an important role in the evolution of the detonation.Therefore,we first consider unsteady detonations with the rate constant KItunable,and the other parameters fixed the same as the above simulation. Figures 8(a)and(b)exhibit the maximum and amplitude of the reaction manifestation versus the rate constant KI,respectively.The symbols denote the simulation results and the lines are for the fitting results.The fitting equations in figures 8(a)and (b) areYMax=0.11305-2.2505 ×10⁻⁴×KIand A=0.10767 −2.41021×10⁻⁴×KI,respectively.Obviously,with the increasing rate constant KI,the maximum and amplitude of the reaction manifestation decrease.Figure 9 illustrates the physical quantities around the detonation wave with two different rate constants KI.As shown in figures 9(a)-(d),with the increasing KI,the amplitudes of the oscillation of density,pressure,horizontal velocity and temperature around the detonation wave become smaller,which means that the chemical reactions become less violent.In other words,the reaction manifestation becomes weaker. Table 1.The frequencies and corresponding amplitudes of the reaction manifestation. Next,we simulate the unsteady detonation wave with various values of rate constant KRfrom KR=7000 to KR=13000.Figure 10 illustrates the simulation results and fitting solutions which are displayed by the symbols and solid lines,respectively.The fitting equations areYMax=0.02175+2.3068 ×10⁻⁶×KRand A=0.00818+2.64065×10⁻⁶×KR,respectively.Obviously,the values of maximum and amplitude grow linearly with the increasing KR.Figures 11(a)-(d) display the evolutions of density,pressure,horizontal velocity and temperature with different rate constants KR,respectively.It is clear in figure 11 that with the increase of KR,the macroscopic physical quantities change more violently,which means that the intensity of chemical reactions is enhanced.Consequently,the global effect caused by chemical reactions on the moment space is enhanced,and the reaction manifestation becomes stronger. Figure 1.Sketch of the two-dimensional sixteen-velocity model. Figure 2.Profiles of physical quantities (a) and nonorganized energy (b) of the unsteady detonation wave. Figure 4.Kinetic moments of reaction term around the detonation wave.(a)HR1 to HR4,(b)HR5 to HR7,(c)HR8 to HR13,and(d)HR14 to HR16.The symbols show the numerical results,and the solid lines represent the theoretical solutions. Figure 5.Evolution of the reaction manifestation in moment space.(a) 0 ≤t ≤0.4,(b) 0.15 ≤t ≤0.35,(c) 0.24 ≤t ≤0.26,and (d)0.25 ≤t ≤0.2501. Figure 6.The amplitude versus frequency from the fast Fourier transform performed on the reaction manifestation. Figure 7.The fitting results of the reaction manifestation.(a) the relation between the number and frequency,and (b) amplitude versus frequency. Figure 8.The maximum (a) and amplitude (b) of the reaction manifestation versus rate constant KI. Figure 9.The physical quantities with different rate constants KI,(a) density,(b) pressure,(c) horizontal velocity,and (d) temperature. Figure 10.The maximum (a) and amplitude (b) of the reaction manifestation versus rate constant KR. Figure 11.The physical quantities with different rate constants KR,(a) density,(b) pressure,(c) horizontal velocity,and (d) temperature. Finally,the simulations of unsteady detonation waves are carried out for various values of chemical heat release per unit mass from Q=3 to 8.Figures 12(a) and (b) show the simulation and fitting results.Symbols represent the simulation results,and the solid lines denote the fitting equationsYMax=−0.12108+0.04272×Q and A=−0.10301+0.03554×Q,respectively.It can be found that as the chemical heat increases,the values of maximum and amplitude increase in a linear form.Physically,for larger chemical heat,the chemical reaction occurs more violently,the physical quantities change more sharply around the detonation wave,and the reaction manifestation becomes larger. In this work,we have investigated the characteristics of unsteady detonation from the kinetic viewpoint.The unsteady detonations are simulated via the DBM,which has the capability of capturing detonation waves with nonequilibrium effects.As the detonation wave propagates forwards,the macroscopic physical quantities in the medium first rise drastically and then fall sharply to form a peak.There are regular oscillations after the detonation peak.Besides,the deviation of the velocity distribution function from the local equilibrium state of unsteady detonation oscillates with the macroscopic quantities.Especially,the deviations show opposite patterns at the peak and trough of pressure after the detonation wave.Moreover,the characteristics of the deviation at the peak of pressure are significantly different from those in the post-wave region.In addition,the nonequilibrium intensity around the detonation wave is much greater than that in the post-wave region.Furthermore,the DBM is adopted to investigate the chemical reaction of unsteady detonation,and the change rate of the kinetic moments due to chemical reactions is consistent with their theoretical solution. In order to have a deeper understanding of chemical reactions from the kinetic perspective,the reaction manifestation is defined to describe the global effects.There are three types of periodic oscillations in the reaction manifestation in moment space during the evolution of the unsteady detonation,and the corresponding cycles are about T1=0.04 028,T2=0.006 69 and T3=0.000 012,respectively.Via the fast Fourier transform,it can be seen that the reaction manifestation is mainly composed of several signal frequencies.Besides,it has been demonstrated that the reaction manifestation consists of a superposition of frequencies of different multiples of f=150 (HZ),and the corresponding amplitude decreases exponentially as the frequency increases.Finally,the influences of rate constants and the chemical heat on the reaction manifestation have been investigated.From the numerical simulations and corresponding fitting equations,the following points can be obtained: (I) with the increasing rate constant KI,the maximum and amplitude of the reaction manifestation decrease.(II) The values of maximum and amplitude of the reaction manifestation grow linearly with the increasing rate constant KR.(III) As the chemical heat increases,the values of maximum and amplitude increase in a linear form. Acknowledgments This work is supported by the National Natural Science Foundation of China (under Grant No.51806116),and Guangdong Basic and Applied Basic Research Foundation(under Grant No.2022A1515012116). Appendix A The matrixHfeqtakes the form, The matrix HRis expressed by, whose elements are HR1=0,HR2=0,HR3=0,HR4=ρ(D+I)T′,HR5=ρT′,HR6=0,HR7=ρT′,HR8=(D+I+2)ρuxT′,HR9=(D+I+2)ρuyT′,HR10=3ρuxT′,HR11=ρuyT′,HR12=ρuxT′,HR13=3ρuyT′,HR14=ρ[ 2T(D+I+2)+(D+I+5)ux2+uy2]T′,HR15=ρuxuy(D+I+4)T′,andHR16=ρ[ 2T(D+I+2)+ux2+(D+I+5)uy2]T′. The matrix M is specified as containing the blocks,Mi=(Mi1Mi2…Mi16),with elementsM1i=1,M2i=vix,M3i=viy,M4i=vi2+ηi2,M5i=vi2x,M6i=vixviy,M7i=v2iy,M8i= Appendix B Most of the previous research on the mechanism of unstable detonation is studied using somehow CFD method,which is quite different from DBM.Roughly speaking,a DBM is approximately equivalent to a continuous fluid model plus a coarse-grained model of other relevant thermodynamic nonequilibrium effects.Therefore,DBM has the ability to capture unsteady detonation with nonequilibrium effects,including diffusion and thermal conduction.In this sector,the DBM results are compared with a CFD simulation.The same initial configurations are used in the CFD simulation. Figure 13 depicts the pressure profiles of unsteady detonation at various times.The red lines represent the DBM results,and the blue lines plot the CFD solutions via an Euler solver.It is clear that the profiles simulated by the DBM are smoother than those using the Euler solver,and the amplitudes simulated by DBM are smaller compared to Euler solver solutions.Physically,the increasing diffusion smooths the density gradient,and the increasing thermal conduction smooths the temperature gradient.Consequently,the pressure amplitude is smaller when considering nonequilibrium effects,including the diffusion and thermal conduction [28].The simulation via Euler solver lacks essential thermodynamics of nonequilibrium effects.In addition,the detonation velocities calculated by the DBM and Euler solver are 3.166 and 3.178,respectively.The corresponding theoretical solution is 3.208.Therefore,the results are generally satisfactory. Figure 13.Comparisons between Euler solver solutions and DBM results of the unsteady detonation at t=0.36(a),t=0.38(b),and t=0.4(c),respectively.4.Reaction manifestation in moment space

5.Conclusions
 Communications in Theoretical Physics2023年7期