
Metabolomics in chronic hepatitis C: Decoding fibrosis grading and underlying pathways
2023-12-05 07:17AdrianaCamargoFerrasiSamaraVitriaGranjaLimaAlineFariaGalvaniJeanyDelafioriFlaviaLusaDiasAudibertRodrigoRamosCatharinoGiovanniFariaSilvaRobertaRodriguesPraxedesDrieleBretonesSantosDayaneTrevisandeMacedoAlmeidaEstelaOlive
World Journal of Hepatology 2023年11期
Adriana Camargo Ferrasi,Samara Vitória Granja Lima,Aline Faria Galvani,Jeany Delafiori,Flavia Luísa Dias-Audibert,Rodrigo Ramos Catharino,Giovanni Faria Silva,Roberta Rodrigues Praxedes,Driele Bretones Santos,Dayane Trevisan de Macedo Almeida,Estela Oliveira Lima
Abstract BACKGROUND Chronic Hepatitis C (CHC) affects 71 million people globally and leads to liver issues such as fibrosis,cirrhosis,cancer,and death.A better understanding and prognosis of liver involvement are vital to reduce morbidity and mortality.The accurate identification of the fibrosis stage is crucial for making treatment decisions and predicting outcomes.Tests used to grade fibrosis include histological analysis and imaging but have limitations.Blood markers such as molecular biomarkers can offer valuable insights into fibrosis.AIM To identify potential biomarkers that might stratify these lesions and add information about the molecular mechanisms involved in the disease.METHODS Plasma samples were collected from 46 patients with hepatitis C and classified into fibrosis grades F1 (n=13),F2 (n=12),F3 (n=6),and F4 (n=15).To ensure that the identified biomarkers were exclusive to liver lesions (CHC fibrosis),healthy volunteer participants (n=50) were also included.An untargeted metabolomic technique was used to analyze the plasma metabolites using mass spectrometry and database verification.Statistical analyses were performed to identify differential biomarkers among groups.RESULTS Six differential metabolites were identified in each grade of fibrosis.This six-metabolite profile was able to establish a clustering tendency in patients with the same grade of fibrosis;thus,they showed greater efficiency in discriminating grades.CONCLUSION This study suggests that some of the observed biomarkers,once validated,have the potential to be applied as prognostic biomarkers.Furthermore,it suggests that liquid biopsy analyses of plasma metabolites are a good source of molecular biomarkers capable of stratifying patients with CHC according to fibrosis grade.
Key Words: Chronic Hepatitis C;Fibrosis;Metabolome;Biomarkers;Plasma;Liquid biopsy
INTRODUCTION
Chronic hepatitis C (CHC) is an infectious disease caused by the hepatitis C virus (HCV) and is a serious public health problem,affecting an estimated 71 million people worldwide[1-3].
Approximately 50%-80% of HCV-infected individuals develop CHC,which can trigger a chronic inflammatory disease process leading to liver fibrosis,cirrhosis,hepatocellular carcinoma (HCC),and death[4].
Natural progression of CHC occurs with sustained inflammation due to repetitive liver injury,followed by the activation of hepatic stellate cells,deposition of fibrillar collagen in the extracellular matrix (ECM),and progressive fibrosis[5,6].These progressive processes may result in ECM degradation and,consequently,vascular and architectural alterations,leading to cirrhosis (10%-20% of patients)[7] or HCC (1%-5%)[8].
Early diagnosis and treatment can prevent liver cirrhosis and HCC,especially with screening and recent advances in CHC treatment based on direct-acting antiviral therapy.However,effective reduction of disease morbidity and mortality requires better characterization of liver involvement,more accurate prognosis,and follow-up[9].Under this scenario,accurate identification of the liver fibrosis stage is critical for the clinical management of HCC,guiding therapeutic options and helping to predict prognosis[10].However,this approach is challenging.Tests used to stage fibrosis include histological analysis of liver biopsies and imaging tests.Liver biopsy is considered the “gold standard” for the diagnosis and staging of liver fibrosis.However,it is an invasive and uncomfortable procedure with a risk of minor (10%-20%) or serious (0.5%-1%) complications[7,11].In addition,the interpretation of histological results is subject to sampling errors and inter-observer subjectivity in the interpretation of histological results[7,12,13].For staging the grades of fibrosis in biopsied liver tissue,the 0-4 scale of the Metavir classification system[14] is commonly used;however,the main limitations are related to the representativeness of liver samples and histopathological interpretation.Conventional imaging tests include ultrasonography,computed tomography,and magnetic resonance imaging.Although they represent important tools for detecting cirrhosis,nodules on the liver surface,and splenomegaly,they present low sensitivity for moderate or even advanced fibrosis.Newer acoustic technologies,such as hepatic elastography,can increase the accuracy of imaging techniques.For these tests,acoustic vibrations are applied to the abdomen and,according to how quickly these vibrations are transmitted along the liver tissue,the stiffness (fibrosis) of the liver is indicated.However,conditions other than fibrosis also increase liver stiffness[7],which requires further study and standardization.Another important limitation is the cost of the equipment[15],which is unaffordable in places with limited financial resources.In clinical practice,blood markers should be considered a relevant source of information.Current approaches are limited to combining commonly available tests (e.g.,aspartate transaminase,alanine aminotransferase,albumin,serum bilirubin,and international normalized ratio) with clinical information (e.g.,age,body mass index,and diabetes) and,in some cases,direct markers of liver function.However,this approach is most useful in distinguishing between two levels of fibrosis: Absent to minimalvsmoderate to severe and fails to stratify the grades.
Undeniably,the search for blood biomarkers is a less invasive method for diagnosis and prognosis,and as blood circulates through most tissues,it can be a relevant source of information about diseases.Therefore,different molecular biomarkers,particularly those with easier and more accessible analytical methodologies,have been investigated for the characterization of liver fibrosis[16-20].
The present study focused on analyzing the plasma metabolome of patients with CHC with different grades of fibrosis aiming to identify potential biomarkers for stratifying these lesions.The metabolome is the set of endogenously synthesized metabolites in a specific physiological condition and may represent the final product of gene expression.Thus,as a secondary aim of this study,we analyzed the pathways linked to the main metabolites detected,contributing information about the molecular mechanisms involved in the disease.
MATERIALS AND METHODS
Study participants
This study was approved by the Ethics Committee on Research of São Paulo State University in accordance with the provisions of the Declaration of Helsinki.Plasma samples from 46 volunteer participants diagnosed with hepatitis C were obtained from peripheral blood.The inclusion criteria were as follows: Patients > 18 years,unrelated,diagnosed by detection of HCV RNA,with identification of HCV genotype,naïve patients (with no previous hepatitis C treatment),and patients with a known fibrosis stage or clinical diagnosis of cirrhosis by imaging.The exclusion criteria were as follows:Volunteers with a history of liver transplantation,hepatic steatosis unrelated to chronic hepatitis C and other liver diseases.To ensure that the biomarkers identified were exclusive to liver lesions (hepatitis C fibrosis),50 healthy volunteer blood bank donors [healthy control group (CG)] were included in this study.Participants were recruited from the Viral Hepatitis Outpatient Clinic of Botucatu Medical School,UNESP,Brazil.The demographic and clinical characteristics of the study participants are summarized in Table 1.
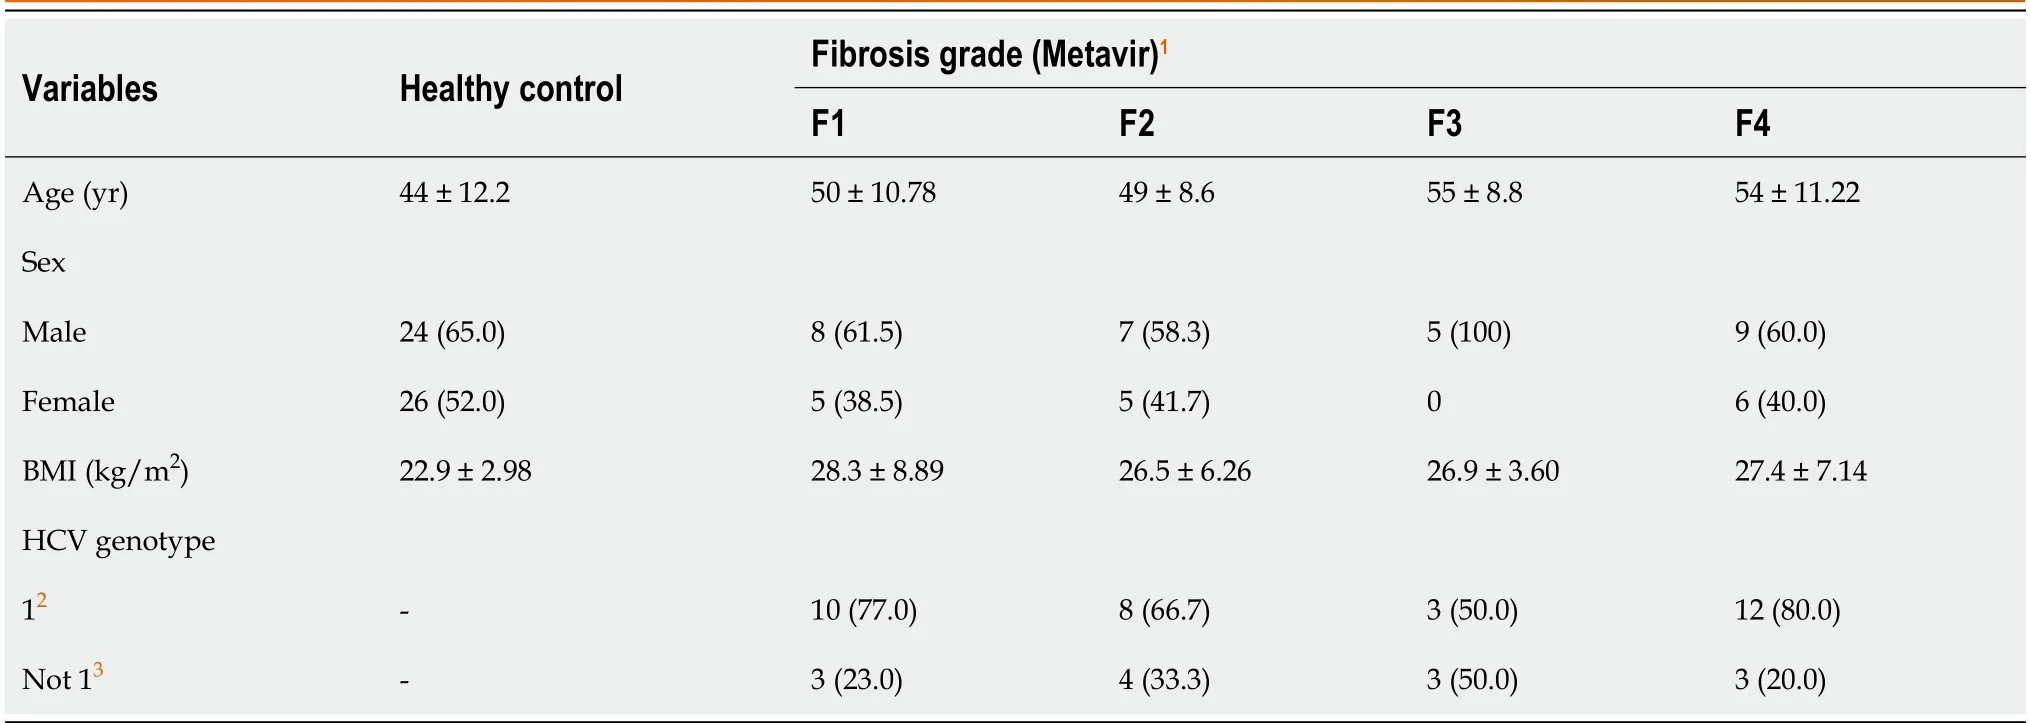
Table 1 Demographic and clinical characteristics of all study participants,distributed by fibrosis grade (Metavir score)
Fibrosis was classified based on the Metavir score[14].Liver samples were collected by percutaneous biopsy before treatment and analyzed histologically.Peripheral blood was collected at the same time as the liver biopsy.
Sample preparation
Samples were collected in tubes with ethylenediamine tetraacetic acid anticoagulant,followed by centrifugation to separate the plasma,which was stored at -80 ℃ until metabolite extraction.At the time of extraction,20 μL of blood plasma was solubilized in 200 μL of tetrahydrofuran,vortexed,and centrifuged at 3200 rpm for 5 min.Then,the collected supernatant was solubilized in 780 μL of methanol and again centrifuged as above.Afterward,50 μL of this supernatant was solubilized in 500 μL methanol q.s.,homogenized,and subjected to chemical ionization with 0.1% formic acid.
Mass spectrometry
For mass spectrometry analysis,the ionized solution was directly injected into an LTQ Mass Spectrometer (ESI-LTQ-XL Discovery,Thermo Fisher Scientific,Waltham,MA,United States) using electrospray ionization.Ten replicates were used for each biological replicate.The parameters for analysis were set as the following configuration: Sample flow rate of 10 μL/min,capillary temperature of 180 ℃,7 kV spray voltage,and carrier gas of 2 arbitrary units.After direct injection,the samples were analyzed in the positive ion mode in the mass range of 100-1400 (mass-to-charge ratio),and the signal intensity was detected,which resulted in a set of ionsm/zfor each sample.XCalibur software (v.2.4,Thermo Scientific)was used to acquire and process the spectrometer data,which were submitted for statistical analysis.
Statistical analyses
Statistical analysis was performed using MetaboAnalyst 4.0 platform[21],in which raw data were evaluated using partial least squares discriminant analysis (PLS-DA).As a result,a list of markers was generated according to the intensity of the most differential and important markers for each group evaluated;that is,the variable importance score (VIP score) was obtained.From this,six ions with the highest VIP score for each grade of fibrosis,with scores > 2.0,were selected.The accuracy of the identified biomarkers was assessed by receiver operating characteristic (ROC) curve analysis.
Identification of biomarkers
From the selected biomarkers,a search was performed using the METLIN online metabolomics database (http://metlin.scripps.edu) to identify molecules compatible with the mass/charge values selected for each grade of fibrosis.The molecules of interest were added to the candidate list and fragmented in silico using the MassFrontier tool (v.6.0,Thermo Fisher Scientific).After the fragmentation in silico,the molecules whose fragments were compatible with those generated experimentally were selected.
RESULTS
Selection of biomarkers
Based on the PLS-DA,the ions were grouped according to the signal intensity profile within each staging grade,making it possible to analyze the separation between fibrosis grades,as represented in the PLS-DA score plot (Figure 1).
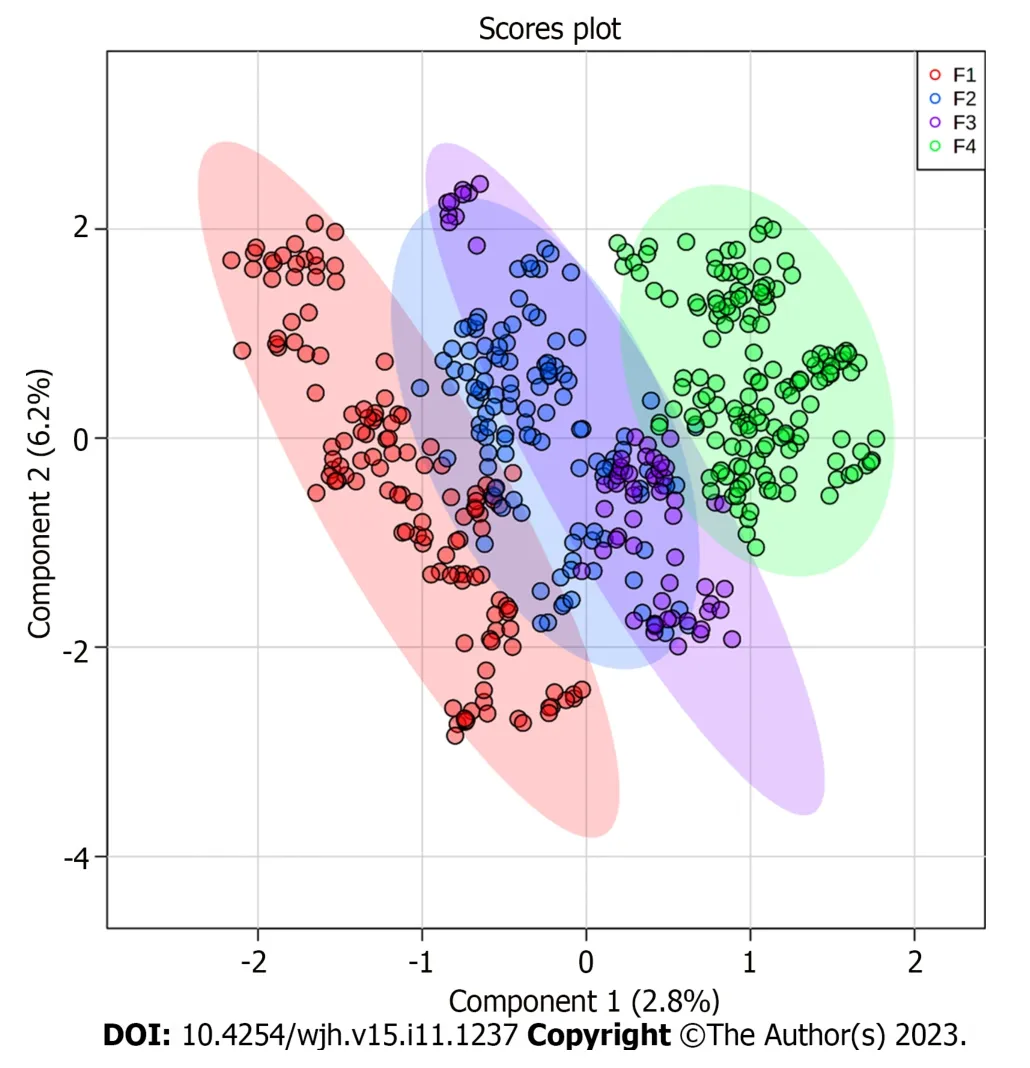
Figure 1 Score plot generated from partial least squares discriminant analysis comparing fibrosis grades (Metavir). Each plasma metabolite profile is highlighted by different colors: F1 (red dots),F2 (blue dots),F3 (purple dots),and F4 (green dots).The shaded regions around the points represent the 95%confidence interval for each group.
To identify the biomarkers responsible for the separation between the groups (Figure 1),a VIP score was used in the projection.This score allows visualization of the relevance of each marker within each grade analyzed according to the mass/charge ratios of the metabolites[22].Considering a VIP score of > 2.0 (Figure 2),the six most important ions were selected for each group (Table 2).
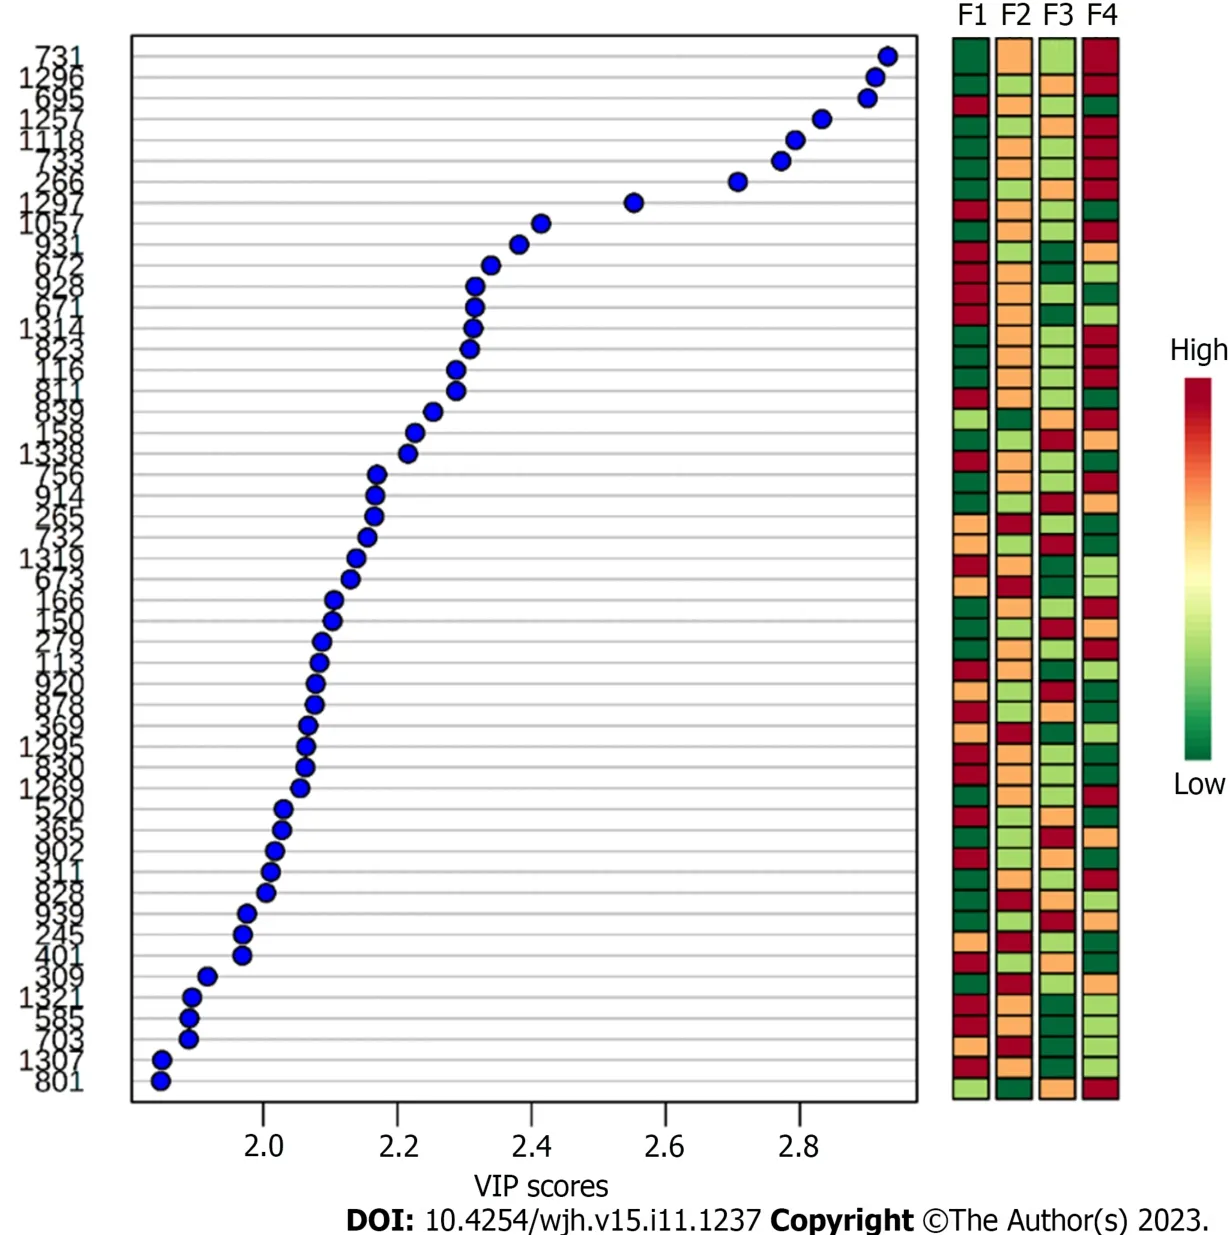
Figure 2 Variable importance score of the biomarkers identified for grades F1,F2,F3,and F4. The Y axis represents the metabolites m/z ratio.The X axis indicates the importance of projection for each biomarker.Laterally to the right,the relevance of each specific marker within the group analyzed is represented according to the color gradations of each biomarker for each grade of fibrosis.The red color represents the most relevant biomarkers;as the red intensity decreases and approaches the green color,the relevance of the biomarkers reduces.Red=up-regulation;Green=down-regulation.VIP Score: Variable importance score.
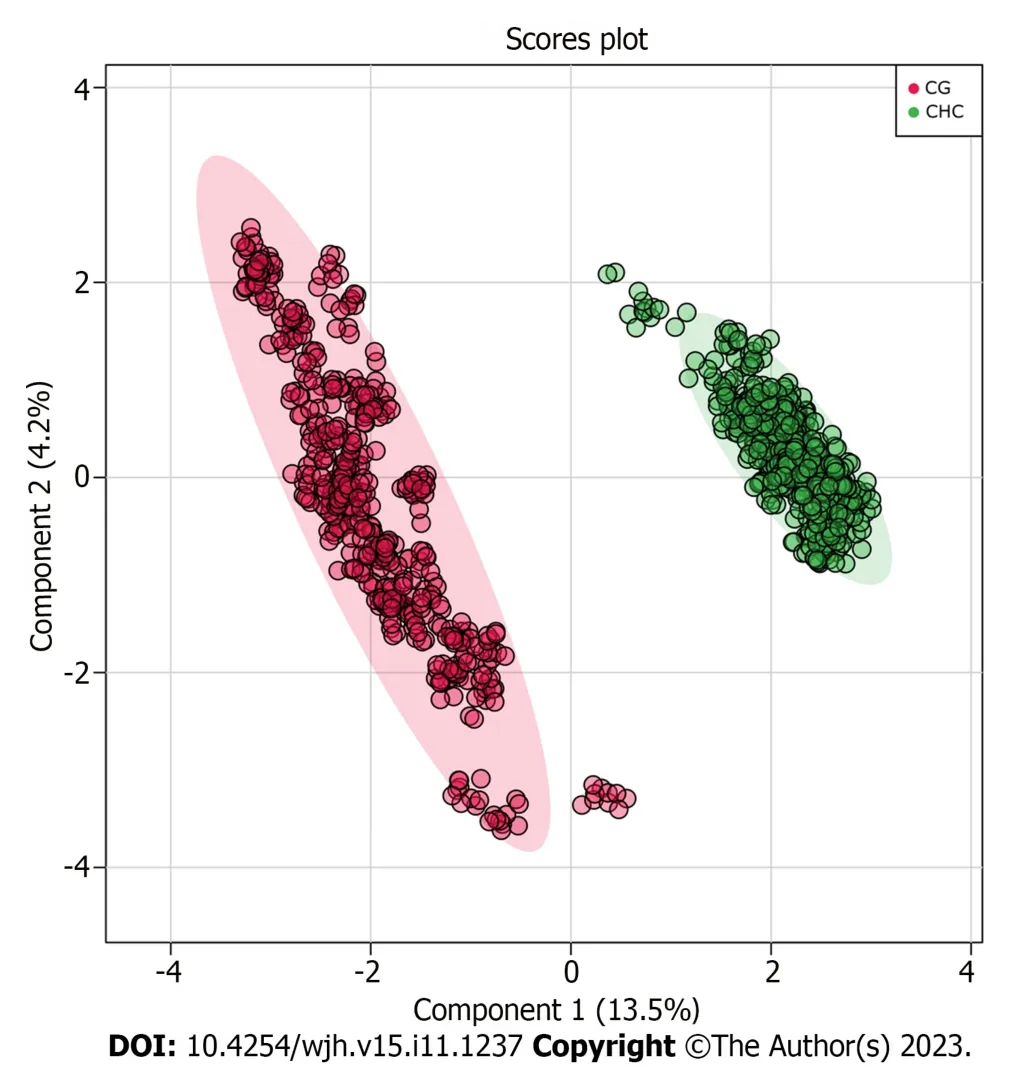
Figure 3 Score plot generated from partial least squares discriminant analysis comparing the chronic hepatitis C vs healthy control groups. Each group is highlighted by different colors: Healthy control groups (red dots) and chronic hepatitis C (green dots),where each dot represents one analytical replicate.The shaded regions around the points represent the 95% confidence interval for each group.
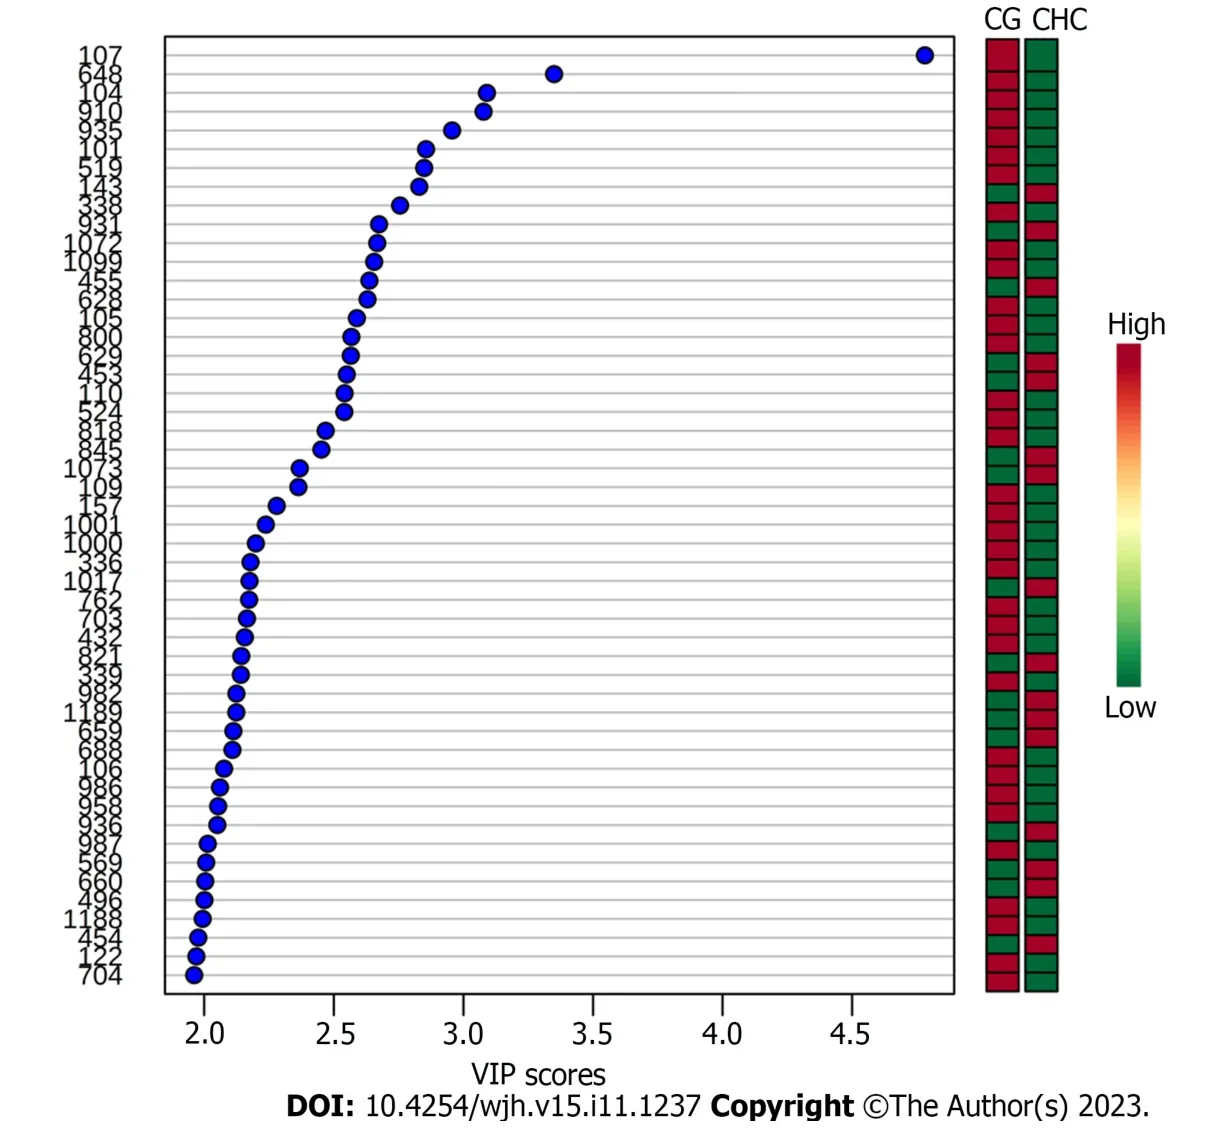
Figure 4 Variable importance score of the biomarkers identified when comparing the chronic hepatitis C vs healthy control groups. The Y axis represents the metabolites m/z ratio.The X axis indicates the importance in projection for each biomarker.Laterally to the right,the relevance of each specific marker within the group analyzed is represented according to the color gradations of each biomarker for each grade of fibrosis.The red color represents the most relevant biomarkers;as the red intensity decreases and approaches the green color,the relevance of the biomarkers reduces.Red=up-regulation;Green=downregulation.VIP Score: Variable importance score.
To ensure that the identified biomarkers were exclusive to liver lesions (fibrosis,CHC),CG were included.The plasma samples from the two groups (CHCvsCG) were compared and this analysis showed that the fibrosis biomarkers(Table 2) were not detected in CG.The PLS-DA and VIP score graphs comparing the two groups are shown in Figures 3 and 4,respectively.
Identification of biomarkers
The most relevant biomarkers,represented bym/zvalues,were identified according to fibrosis grade,as shown in Table 2.
ROC curve analysis
The accuracy of the biomarkers was assessed using the ROC curve analysis of the sets of metabolites identified for each fibrosis grade (Figure 5).ROC curves were used to analyze the sensitivity,specificity,and area under the curve (AUC) of each group of metabolites identified at each grade of fibrosis.The ROC curve of the selected metabolites for F1 (AUC=0.806) was plotted with a sensitivity of 82% and a specificity of 68%,and the other selected metabolite groups for F2 (AUC=0.652),F3 (AUC=0.807),and F4 (AUC=0.864) showed sensitivities of 62%,82%,and 83% and specificities of 57%,74%,and 76%,respectively.
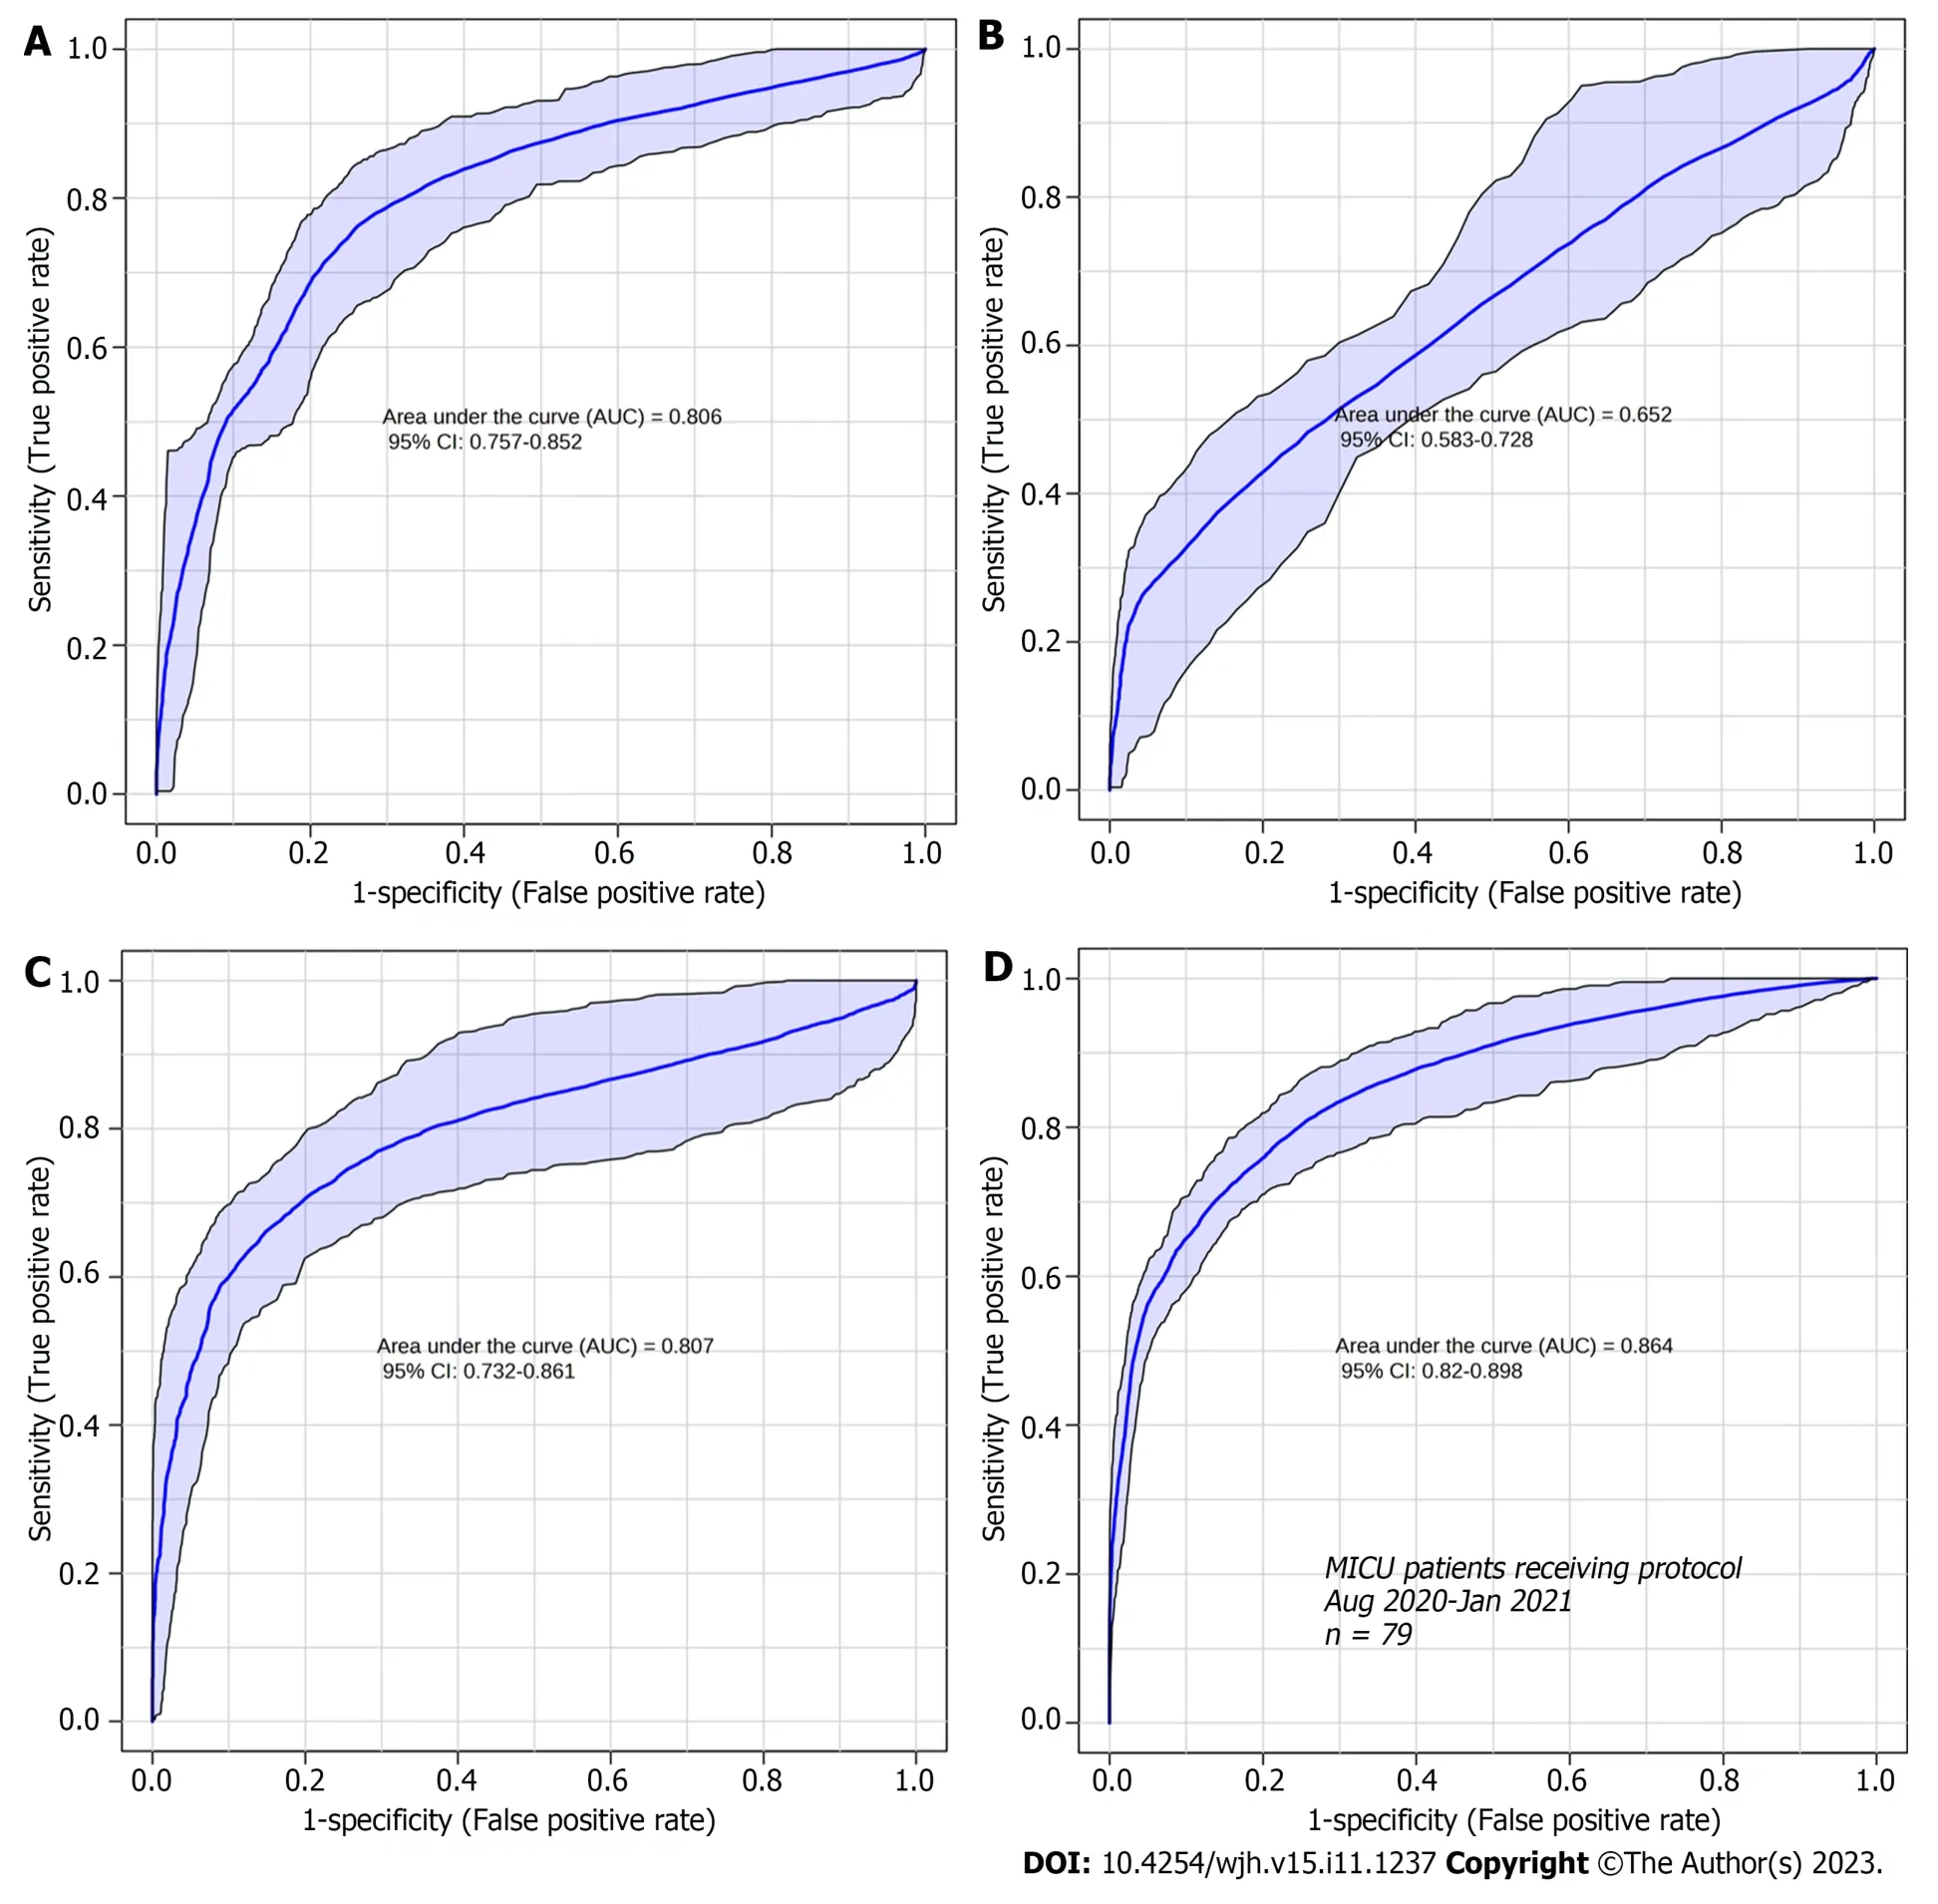
Figure 5 Receiver operating characteristic curve analysis of the sets of metabolites identified at each fibrosis grade. A: Receiver operating characteristic (ROC) curve analysis of the set of differential metabolites identified in F1 compared to the other grades (F2,F3,and F4);B: ROC curve analysis of the set of differential metabolites identified in F2 compared to the other grades (F1,F3,and F4);C: ROC curve analysis of the set of differential metabolites identified in F3 compared to the other grades (F1,F2,and F4);D: ROC curve analysis of the set of differential metabolites identified in F4 compared to the other grades (F1,F2,and F3).
DISCUSSION
The metabolome was analyzed to identify new prognostic and diagnostic biomarkers.Thus,the present study investigated the differential metabolites in blood plasma as potential biomarkers of fibrosis stages.Our analysis identified potential biomarkers for each grade of liver fibrosis,which will increase our knowledge about the progression of CHC and highlight targets for further investigation.The identified biomarkers were able to establish a clustering tendency in patients with the same grade of fibrosis despite some overlap.The score plot analysis showed greater efficiency in discriminating between the extreme grades (F1 and F4),with an overlap in grades F2 and F3.This result may be related to the analytical bias of histological classification,as the formation of groups was based on this criterion-Metavir[12-14],which is subject to some bias related to inadequate sample acquisition,incorrect sample representation or inter-observer variability[7,12,13].To ensure that the identified biomarkers were exclusive to liver lesions caused by CHC,we compared them with the plasma samples of healthy donors (Figures 3 and 4).None of the biomarkers found in the patient within the CHC group were detected in the plasma of healthy controls,which reinforces their potential as biomarkers exclusive to the disease.
Analysis of the accuracy of the most relevant metabolites in each grade showed that the sets associated with grades F1,F3,and F4 were good biomarkers (AUC 0.806,0.807,and 0.864,respectively;Figure 5) and had good sensitivity and specificity scores.However,the metabolites identified as grade F2 were less specific and showed poor sensitivity.Such findings could be useful for distinguishing grades F1,F3,and F4,where uncertainty exists when the analyses are based solely on histology.Some serum markers of fibrosis validated in patients with hepatitis C and correlated with liver biopsy as a reference standard showed a mean AUC suitable for clinical practice (> 0.80)[23];however,an overlap was also observed between adjacent grades of liver fibrosis,particularly the lower grade[24].
Despite the histological bias,our analysis identified different metabolites from diverse chemical classes,including sterols,fatty acids,lipids,and coenzymes.However,for each grade of fibrosis,a metabolite profile has been identified,and as observed in Figure 2,the relevance of each molecule changes according to the fibrosis grade and may intensify or decrease during the disease.
Some studies have demonstrated the potential of metabolomics analyses for different scenarios in diverse diseases,particularly in cancer management[25].One of the great achievements of metabolomics is the assessment of therapeutic responses and tumor progression,as shown by Rattneret al[26],in which serum blood metabolites indicated positive or negative responses to chemotherapy using gas chromatography-mass spectrometry.In addition,some methods for metabolomics analysis,such as nuclear magnetic resonance and multisegment injection-capillary electrophoresis-mass spectrometry,have also shown impressive results,and have also been used to evaluate the metabolome of serum samples from patients with CHC with fibrosis of different grades[27].This study identified markers for the highest grades of fibrosis,which are compatible with our results,such as glycerophospholipid and acyl-carnitine markers.Therefore,the use of metabolomics approaches for liquid biopsies show promise as diagnostic,prognostic,and therapeutic monitoring tools.
In the context of viral infection,viruses are known to synthesize fatty acids by benefitting from their intermediate products.HCV alters the expression of lipid-related genes associated with cholesterol biosynthesis[28,29].Interestingly,some metabolites found in different grades of fibrosis are associated with lipid alterations[30-32].
For grade F1,biomarkers that may be more related to HCV infection than to the development of fibrosis were observed when compared to patients with more advanced fibrosis.Thus,the first molecule identified in F1 belonged to the sterol class,with specific signatures for cholesterol ester (CE) (m/z=671 andm/z=672).Previous studies have pointed out that CE is a critical component of lipoviral particles whose synthesis has been linked to HCV infection in vitro when cholesterol and triglyceride accumulation is observed[29].In agreement with our results,we suggest that HCV may modulate the environment,promoting a higher density and infectivity of viral particles and viral spread in the hepatic tissue,which intensifies infection[28,33,34].
Considering lipid metabolism and accumulation,it was possible to identify the sphingolipid class in intermediategrade F2,represented by ceramide (m/z=673).It is a central molecule in sphingolipid metabolism with anti-proliferative and pro-apoptotic effects[30].In the context of HCV infection,lipid accumulation and,consequently,ceramide accumulation occur and may lead to steatosis[35],which may contribute to the development of liver fibrosis[5,35-37].
In addition,a glycerolipid was also identified in F1,specified as diacylglycerol (DG) (m/z=695).Recent studies have shown that the conversion of DG to phosphatidic acid (mediated by diacylglycerokinases) results in lysophosphatidic acid production,which is involved in many chronic inflammatory diseases,including fibrosis and cancer[38,39].Therefore,the present study highlights a potential relationship between high levels of DG and a less fibrotic state (lowgrade fibrosis) compared to F4,where fibrosis is accentuated.
Another lipid class,glycerophospholipids,was identified in intermediate-grade F3 and advanced-grade F4,in which the biomarkers were identified as phosphoethanolamines (PE) (m/z=731,m/z=732,andm/z=733).Some studies have suggested that PE gradually increases according to the grade of liver fibrosis and acts as a potential marker of carcinogenesis[40,41].This finding suggests that patients diagnosed with F3 could be at the beginning of the carcinogenesis process;however,this hypothesis needs to be further investigated.
Other biomarkers related to changes in lipid signaling pathways have also been identified.One of these belongs to the eicosanoid class (m/z=369) identified in F2.This molecule is a biologically active lipid that has several implications in biological processes and is a potent mediator of inflammation in infectious diseases and HCC[42,43].In addition,it is associated with liver fibrosis staging and is a potential biomarker[44-46].Another class of lipids,prenol lipids,was identified as F3,represented by farnesylcysteine (m/z=365).This marker participates in the process of liver carcinogenesis by directly acting on the activity of oncogenic rat sarcoma virus protein[47,48].Thus,these results encourage investigations into the use of this metabolite as a potential biomarker of the risk of tumor development.
Different intermediate metabolites of the coenzyme A (CoA) class have also been identified,and they are typically involved in the β-oxidation of medium-and long-chain fatty acids to acyl-CoA,a key intermediate in lipid metabolism.Some studies suggest the existence of a disruption in fatty acid lipid metabolic pathways during HCV infection[49,50].This process results in the accumulation of acyl-CoA and fatty acid metabolic intermediates,such as the three molecules identified in the present study,described as follows.The cis,cis-3,6-dodecadienoyl-CoA (m/z=928) was identified in the F1 cases in our study.For F3,the marker S-2-octenoyl CoA (m/z=914) was found[51,52],and in advanced grade (F4),a CoA metabolite (m/z=1118) was identified.Because different acyl-CoAs isoenzymes are expressed in the liver,some of which are overexpressed in activated hepatic stellate cells[51,53],the results of the present study indicate that there is a disruption in lipid metabolism throughout the infection;however,this is unclear and requires further investigation.Considering the presence of acyl-CoAs in three different fibrosis grades,these molecules are not good candidates for the classification of fibrosis stages but highlight their importance in CHC.
Another marker involved in β-oxidation was found in patients with F4,represented by malonyl carnitine (m/z=266).Tumors require more energy for cell proliferation,which may lead to dysregulation of energy-supplying metabolic pathways,such as β-oxidation of fatty acids[54,55].In the context of HCC,alterations in the metabolism of acylcarnitine are directly related to the worsening of the disease and to alterations of β-oxidation[56],which results in the accumulation of Acyl-CoA[57],as discussed previously.Thus,malonylcarnitine can be considered a potential HCC biomarker;however,further studies are needed to validate this hypothesis.
In addition to the lipid biomarkers,the polypeptide angiotensin III (Ang III) (m/z=931) was identified in F1,which,according to some studies,exhibits physiologically relevant effects similar to those of angiotensin II.In the context of CHC and liver fibrosis,Ang III participates in the increase in collagen production through its interaction with the angiotensin type 2 receptor[58,59] Therefore,this pathway may be involved at the beginning of the fibrotic process once Ang III is identified in F1.
The last two metabolites were identified as intermediate grades: methyladenosine (m/z=265) in F2 and (S)-2,3,4,5-tetrahydropiperidine-2-carboxylate (m/z=150) in F3.Adenosine methylation is a post-transcriptional modification of mRNAs that affects various biological functions[60-62].In HCV infection,methyladenosine may represent an RNA modification that enhances the production of infectious particles by interacting with viral proteins[62-64].These findings suggest that these modifications are involved in the progression of infections and liver fibrosis.Finally,(S)-2,3,4,5-tetrahydropiperidine-2-carboxylate identified in F3 may be related to the degradation of enzymatically inactive proteins and viral assembly[65].Although this study related amino acid residues to the progression of infection and consequent worsening of fibrosis staging,further studies are necessary to clarify the actions of these protein residues in the viral cycle.
The main limitation of this research was the sample size.This study covered a regional sample and were limited to a single center,which may limit external generalization.However,the results encourage further research with a larger casuistry and the application of this methodology to other liver diseases.
The current study has innovative potential for the detection of markers in plasma,an easily accessible biological fluid.Besides,liquid biopsy could be used side by side with the other noninvasive tests (like elastography) for achieving more accuracy in predicting prognosis.
CONCLUSION
In conclusion,the results from this study suggest that some of the observed biomarkers,once validated,have the potential to be applied as prognostic biomarkers.In addition,they suggest that liquid biopsy analyses of plasma metabolites are a good source of molecular biomarkers capable of stratifying patients with CHC according to fibrosis grade.
ARTICLE HIGHLIGHTS
Research background
Chronic hepatitis C (CHC) is an infectious disease caused by the hepatitis C virus,leading to liver issues like fibrosis,cirrhosis,cancer,and death.The accurate fibrosis stage identification is crucial for treatment decisions and predicting outcomes.Thus,blood markers are a source of relevant information on the staging of fibrosis,in a less invasive and representative way,compared to percutaneous biopsies.
Research motivation
Currently,approaches to staging fibrosis are invasive,subject to sampling errors and subjectivity between observers.In clinical routine,blood markers should be considered a relevant source of information.However,current approaches are limited to routine biochemical tests associated with clinical information,which is not very informative.Analyses based on liquid biopsy are less invasive,and blood plasma,since it circulates throughout the body,can provide information on pathologies that have not yet manifested themselves clinically,positively impacting on prognosis.
Research objectives
Analyze the plasmatic metabolome of CHC patients,looking for potential biomarkers to stratify these lesions.
Research methods
Plasma metabolites from hepatitis C patients and 50 healthy volunteer participants were analyzed using the LTQ Mass Spectrometer.The sample and the control group were classified into Fibrosis grades was classified using the Metavir score.Liver samples were collected by percutaneous biopsy before any treatment and then analyzed histologically.The most relevant metabolites were categorized using the METLIN online metabolomics database.The molecules of interest were added to a list of candidates and subsequently fragmented in silico using the MassFrontier tool.Molecules compatible with those generated experimentally were then selected for functional analysis.
Research results
For each degree of fibrosis,six differential metabolites were identified that were able to establish an interesting grouping trend among patients with the same degree of fibrosis.
Research conclusions
The results of this study suggest that liquid biopsy analyzes of plasma metabolites are a good source of molecular biomarkers capable of stratifying patients with CHC according to their fibrosis grade.
Research perspectives
Some of the observed biomarkers,once validated,have the potential for application as prognostic biomarkers.This study has innovative potential regarding the detection of pre-clinical biomarkers in easily accessible plasma using minimally invasive methods.
FOOTNOTES
Author contributions:Ferrasi AC,Lima EO,Delafiori J and Dias-Audibert FL performed mass spectrometry experiments;Ferrasi AC,Galvani AF,Santos DB,Silva GF,and Praxedes RR performed biofluid collection and selection and provided clinical support;Ferrasi AC,Almeida DTM,Lima EO,Praxedes RR,and Lima SVG analyzed the data and prepared the Figures;Ferrasi AC and Lima SVG wrote the manuscript;Lima EO,Silva GF,and Catharino RR revised the manuscript;Catharino RR provided the infrastructure and methodological support;Ferrasi AC and Lima EO designed,managed,and supervised the study;All authors approved the final version of the article.
Supported bySão Paulo Research Foundation,No.2021/04753-0.
Institutional review board statement:The study was reviewed and approved by the Institutional Review Board at the Botucatu Medical School.
Informed consent statement:All the participants in this study signed the Informed Consent Form.
Conflict-of-interest statement:The authors declare that there is no conflict-of-interest.
Data sharing statement:No additional data are available.
Open-Access:This article is an open-access article that was selected by an in-house editor and fully peer-reviewed by external reviewers.It is distributed in accordance with the Creative Commons Attribution NonCommercial (CC BY-NC 4.0) license,which permits others to distribute,remix,adapt,build upon this work non-commercially,and license their derivative works on different terms,provided the original work is properly cited and the use is non-commercial.See: https://creativecommons.org/Licenses/by-nc/4.0/
Country/Territory of origin:Brazil
ORCID number:Adriana Camargo Ferrasi 0000-0001-9200-5391;Aline Faria Galvani 0000-0002-0795-1453;Jeany Delafiori 0000-0003-2481-0465;Flavia Luísa Dias-Audibert 0000-0001-5758-2070;Rodrigo Ramos Catharino 0000-0001-7219-2644;Giovanni Faria Silva 0000-0001-6129-7045;Roberta Rodrigues Praxedes 0000-0002-0378-4248;Driele Bretones Santos 0000-0002-1415-6984;Estela Oliveira Lima 0000-0003-0479-0364.
Corresponding Author's Membership in Professional Societies:European Association for Cancer Research (EACR),EACR34184.
S-Editor:Qu XL
L-Editor:A
P-Editor:Cai YX
 World Journal of Hepatology2023年11期
- World Journal of Hepatology的其它文章
- Budd-Chiari syndrome in children: Challenges and outcome
- Risk of hepatitis B reactivation in patients with myeloproliferative neoplasms treated with ruxolitinib
- Function of macrophage-derived exosomes in chronic liver disease:From pathogenesis to treatment
- Global burden of cirrhosis and other chronic liver diseases due to nonalcoholic fatty liver disease,1990-2019
- Evaluation of a protocol for rifaximin discontinuation in critically ill patients with liver disease receiving broad-spectrum antibiotic therapy
- Editorial: Metabolomics in chronic hepatitis C: Decoding fibrosis grading and underlying pathways