
Genome assembly of KA105, a new resource for maize molecular breeding and genomic research
2023-12-25 09:50TingLiShutuXuJiawenZhaoYapengWangJunZhangXinWeiJianzhouQuRuisuYuXinghuaZhangChuangMaJiquanXue
The Crop Journal 2023年6期
Ting Li, Shutu Xu,*, Jiawen Zhao, Yapeng Wang, Jun Zhang, Xin Wei, Jianzhou Qu,Ruisu Yu, Xinghua Zhang, Chuang Ma,*, Jiquan Xue,*
a The Key Laboratory of Biology and Genetic Improvement of Maize in Arid Area of Northwest Region, Northwest A&F University, Yangling 712100, Shaanxi, China
b Maize Engineering & Technology Research Centre, College of Agronomy, Northwest A&F University, Yangling 712100, Shaanxi, China
c State Key Laboratory of Crop Stress Biology for Arid Areas, Center of Bioinformatics, College of Life Sciences, Northwest A&F University, Yangling 712100, Shaanxi, China
Keywords:Genome assembly Pedigree analysis Structural variation Transcriptome atlas Differential network
ABSTRACT Superior inbred lines are central to maize breeding as sources of natural variation.Although many elite lines have been sequenced, less sequencing attention has been paid to newly developed lines.We constructed a genome assembly of the elite inbred line KA105,which has recently been developed by an artificial breeding population named Shaan A and has shown desirable characteristics for breeding.Its pedigree showed genetic divergence from B73 and other lines in its pedigree.Comparison with the B73 reference genome revealed extensive structural variation, 58 presence/absence variation (PAV)genes, and 1023 expanded gene families, some of which may be associated with disease resistance.A network-based integrative analysis of stress-induced transcriptomes identified 13 KA105-specific PAV genes,of which eight were induced by at least one kind of stress,participating in gene modules responding to stress such as drought and southern leaf blight disease.More than 200,000 gene pairs were differentially correlated between KA105 and B73 during kernel development.The KA105 reference genome and transcriptome atlas are a resource for further germplasm improvement and surveys of maize genomic variation and gene function.
1.Introduction
Maize (Zea mays L.) is used for food, animal feed, and biofuels worldwide.In 2020, the global production of maize exceeded 1.1 billion tons[1],and world demand for maize continues to rise with population growth and climate change [2].During the current era of breeding 4.0, genomics-assisted maize breeding has been deployed to accelerate germplasm innovation and cultivar alternation for objectives such as yield increase, environmental adaptation, disease resistance, and quality improvement [3,4].Because genomics-assisted breeding requires multi-omics integrated analysis based on high-quality genome assemblies of diverse germplasm resources [5], generation of high-quality maize genome assemblies is needed.
With the rapid development of high-throughput sequencing technologies, genomes have been assembled for more than 50 maize accessions.The first assembled genome of maize was that of B73[6],a founder line of the stiff-stalk germplasm,and has been used as a reference genome for advancing maize genetics, breeding, and genomic studies [7,8].Considering that ‘‘One reference genome is not enough” [9], subsequent genome sequencing and assembly of two classical maize inbred lines, Mo17 from the Lancaster group and PH207 from the Iodent germplasm, facilitated the discovery of extensive intraspecific variation[10,11].As a complement to these temperate reference genomes, the genome of a tropical small-kernel(SK)accession was also sequenced,providing a further boost to the identification of structural variations (SVs),and the cloning of the new functional gene ZmBAM1d[12].Several founder lines widely used in Europe and China have also been whole-genome sequenced[13–17].The genomes of four European flint lines (F7, EP1, DK105, and PE0075) revealed extensive genomic differences between the flint and dent germplasm pools [13].The genomic assembly of Huangzaosi,a founder parent originating from a landrace representing the Tangsipingtou group in China,expanded understanding of its improvement history and genomic variations [14].Genomic information from RP125, a Chinese elite maize inbred line, is also being used to accelerate the cloning of functional genes from its ethyl methanesulfonate mutant library[17].Genome sequencing of maize germplasm with specific desirable characteristics has advanced the dissection of genetic basis of interesting traits [18–20].The high-quality genome assemblies of 26 diverse parents for a nested association mapping population have opened a precedent for pan-genome analysis,as well as studies of the association between SVs and DNA methylation rates [7].Despite these pioneering works, high-quality genome assemblies for elite maize germplasm resources, especially of newly developed lines, are still urgently needed to accelerate understanding of genetic variation, discovery of functional genes, and maize breeding research.
KA105,a new maize line,was derived from the Shaan A group in 2011[21].It grows well in arid and semi-arid areas,with adaptions to abiotic stresses including drought and low nitrogen(LN)[22,23].It shows resistance against multiple diseases,such as southern leaf blight (SLB) and Gibberella stalk rot [24],and exhibits a fast kernel dehydration rate and high combining ability [25,26].Owing to these desired traits,KA105 has been used as a parent for 19 maize cultivars including five nationally approved ones including Shaandan 650, Shaandan 660, and Shaandan 680.
Because of its value in Chinese maize breeding, we selected KA105 for construction of a high-quality genome assembly to supplement existing genomic resources for maize breeding and functional research.The objective of this study was to assemble the KA105 genome, characterize it with respect to the ancestral lines in its pedigree, identify differences between KA105 and B73 line at genome and transcriptome levels, construct a stress-induced transcriptome atlas of KA105,and perform network-based integrative analysis to identify maize genes responsive to multiple stresses.
2.Materials and methods
2.1.Generation of maize inbred line KA105
KA105 was generated from third-round improvement of the Shaan A group, which was constructed by crossing an elite inbred line Ye478 with a synthetic population origining from four superior maize varieties (Zhengdan 958, Xianyu 335, Nongda 108, and Denghai 661).During population improvement and inbred line development, all plants were grown in multiple locations under high-density planting, drought, and LN treatments to strengthen artificial selection under adverse conditions.Performance and pedigrees are shown in Figs.1A,S1.KA105 showed desirable properties including wide adaptability, comprehensive and moderate disease resistance,high N-use efficiency,and high combining ability[22–24,26].KA105 was also identified as a superior parent that has been used to generate 19 maize commercial varieties since 2015 (Table S1).
2.2.Phenotypic evaluation
KA105 and B73 were planted in Yangling, Shaanxi province,China, in 2019, in two replications of four 4.5-m rows spaced 0.6 m apart.The planting density was 75,000 plants per hectare.Field management followed standard practices.After silking, all maize ears were self-pollinated, and the pollination date was recorded.Ears were harvested and threshed according to the date of pollination.Kernel moisture content (KMC, %) was assessed by oven drying at seven successive stages: 21, 28, 35, 42, 49, 56 and 63 days after pollination (DAP).Details of KMC measurement are presented in our previous report [25].After reaching maturity,the remaining ears were harvested and threshed,and uniform kernels were then selected for measurement of kernel length (KL,mm),kernel width(KW,mm),and kernel thickness(KT,mm),with an electronic digital caliper.Starch content(%),fiber content(%),oil content (%), and protein content (%) were measured with a nearinfrared spectroscope (DA7250, Perten, Hägersten, Sweden).
2.3.KA105 whole-genome sequencing
Young leaf samples of KA105 at the five-leaf stage were collected and frozen in liquid nitrogen for extraction of high-quality genomic DNA by a modified cetyltrimethylammonium bromide method [27].RNase treatment was applied to remove RNA contaminants.For PacBio (Pacific Biosciences, Menlo Park, CA, USA)sequencing, DNA was sheared into ~20 kb fragment size for use in long-read library construction according to the manufacturer’s instructions.The final libraries were then sequenced on a PacBio Sequel II instrument.For Illumina(San Diego,CA,USA)sequencing,short-read(350-bp)libraries were constructed following the manufacturer’s protocol and sequenced on an Illumina Novaseq instrument.For chromosomal conformational capture(Hi-C)sequencing,Hi-C libraries based on DpnII restriction enzymes were generated as previously described [28], with a fragment size of 300–700 bp,and sequenced on the Novaseq.
2.4.De novo assembly and quality control of the KA105 genome
For the assembly of KA105, PacBio long reads were errorcorrected with Canu[29]and de novo assembled into contigs with SMARTdenovo [30].The initial contigs were polished using Illumina short reads with Pilon software [31].For anchored contigs,a pre-assembly was first performed to correct the polished contigs using the Hi-C data.Briefly, the polished contigs of the primary assembly were broken into 50 kb segments, which were then reassembled according to Hi-C data.Any segments that could not be recovered to the initial assembly were split into two fragments at the lowest Hi-C coverage site.The corrected contigs and Hi-C reads were used to generate the genome assembly using LACHESIS[32] with the following parameters: CLUSTER_MIN_RE_SITES = 85 0, CLUSTER_MAX_LINK_DENSITY = 2, ORDER_MIN_N_RES_IN_TRU NK = 1335, ORDER_MIN_N_RES_IN_SHREDS = 1283.
To assess the completeness and accuracy of the KA105 assembly,we first aligned the Illumina short reads to the assembly using Burrows-Wheeler alignment (BWA) [33].We then performed a Benchmarking Universal Single-Copy Orthologs (BUSCOs, http://busco.ezlab.org) analysis using busco (v2.0, database:embryophyta_odb9) [34] and the long terminal repeat assembly index (LAI) [35] to assess the assembly with default parameters.
2.5.RNA-seq data collection and generation
RNA-seq libraries of the maize inbred line KA105 were constructed from nine tissues: seedling leaves, seedling roots, ear leaves, aerial roots, tassels, bracts, pollinated silks, and kernels(20 and 30 DAP).Another 50 RNA-seq libraries were constructed using kernel samples from seven developmental stages (12, 21,28,36,42,49,and 56 DAP)[25]and leaf samples under treatments consisting of polyethylene glycol(PEG),LN,SLB,and southern corn rust (SCR), with at least two biological replicates per sample.For PEG stress, seeds were sown in soil and grown under 25 ± 1 °C and 16 h light/8 h dark conditions.Two-leaf seedlings were sampled and transferred to Hoagland’s nutrient solution.At threeleaf stage, the seedlings were treated with 10% PEG-6000, and leaves were harvested at 0, 6, and 12 h after treatment.For LN stress,plants at the two-leaf stage were incubated in nutrient solution with the normal nitrogen level (4.00 mmol L-1) and LN level(0.04 mmol L-1), and leaves were harvested approximately 4 d after treatments.Ca(NO3)2∙4H2O was used as nitrogen source.For SLB treatment,seedlings were planted in soil and the fourth leaves of plants were spray-inoculated with Cochliobolus heterostrophus spore suspension (5 × 10⁴mL-1) [36].Infected and non-infected leaves were collected separately after 12 h.For SCR treatment,plants were inoculated with Puccinia polysora (1 × 10⁶mL-1) and a mock treatment (0.01% tween 20).Leaves were sampled 2 and 6 d after inoculation.
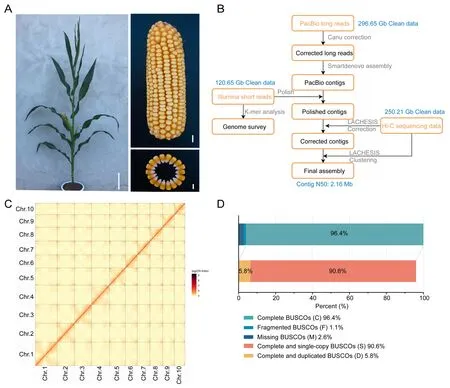
Fig.1.Overview of the KA105 genome assembly.(A) KA105 plant, ear, and kernel.Scale bars, 20 cm for plant, 1 cm for ear, and 5 mm for kernels.(B) Overview of the bioinformatics pipeline used for KA105 genome assembly.(C) Chromosomal conformational capture (Hi-C) interaction matrix for the 10 chromosomes.(D) Benchmarking universal single-copy orthologs (BUSCOs) evaluation indicates the completeness of the assembled KA105 genome.
All collected samples were immediately frozen in liquid nitrogen and stored at-80°C.Total RNA was extracted from each sample with TRIzol reagent (Invitrogen, Carlsbad, CA, USA) for library construction and sequencing according to the standard Illumina manufacturer’s protocol.Raw reads were cleaned using fastp(v0.23.2) [37] with default parameters, and clean reads were mapped to the KA105 genome with hisat2(v2.2.1)[38].Transcripts per million(TPM)values and read counts for each gene were calculated with Stringtie (v2.1.4) [39].
2.6.Genome annotation
Annotation of transposable elements(TEs)was performed with a combination of homology-based and de novo approaches.A de novo repeat library in KA105 was constructed with RepeatModeler2(v2.0.1)[40].Long terminal repeat(LTR)retrotransposons were predicted with LTR_retriever(v2.8)[41].The final TEs were identified with RepeatMasker (v4.1.0) [42] based on a combination of built-in de novo repeat libraries and three public databases: Repbase (v19.06) [43], REXdb (v3.0) [44], and Dfam (v3.2) [45].Tandem repeats were characterized with MIcroSAtellite identification tool (MISA, v2.1) [46] and Tandem Repeat Finder(TRF, v409) [47].
Gene annotation of the KA105 genome was performed with a bioinformatics pipeline combining ab initio-based, RNA-seqbased, and homology-support methods.For the ab initio method,Augustus(v2.4)[48]and SNAP(2006–07–28)[49]were employed with default parameters.Protein sequences of five plant species:
Sorghum bicolor,Oryza sativa,Brachypodium distachyon,Setaria italica, and Arabidopsis thaliana, were collected and used for homology-based prediction with GeMoMa (v1.7) [50].RNA-seqbased prediction employed the assembled RNA-seq transcripts and full-length transcripts from nanopore sequencing of six tissues:bract,kernel,leaf,root,silk,and tassel.All gene models were then combined with EVidenceModeler(EVM,v1.1.1)[51]for annotation,and the results were further refined with PASA(v2.0.2)[52].Gene functional annotation was performed with eight public databases: Gene Ontology (GO), NCBI non-redundant (NR), Kyoto Encyclopedia of Genes and Genomes (KEGG), eukaryotic Ortholog Groups database (KOG), Swiss-prot, TrEMBL, the protein families(Pfam), and eggNOG-mapper (eggNOG).
2.7.Relative identity-by-descent and phylogenetic analyses
Resequencing data of KA105 and five maize inbred lines(Xu178, PH6WC, PH4CV, Zheng58, and Chang7-2) were generated with the Illumina sequencing platform.Resequencing data for B73,HuangC,and Ye478 were retrieved from the Chinese National Genomics Data Center (NGDC, https://ngdc.cncb.ac.cn/,CRA001363) [12].Raw resequencing data of all these maize lines were trimmed with fastp[37].Clean paired-end reads were aligned to the KA105 genome using Bowtie2 (v2.4.2) [53] with default parameters.SAM files were sorted and converted into BAM files and uniquely mapped reads were extracted with SAMtools (v1.9)[54].Potential polymerase chain reaction duplications were removed with Picard MarkDuplicates (https://broadinstitute.github.io/picard/).Potential variations were identified with the HaplotypeCaller pipeline from Genome Analysis Toolkit (GATK,v4.1.9.0) [55].An additional filtering step was applied with vcfutils.pl (parameters: -W 10 -w 5) function in bcftools (v1.11,https://github.com/samtools/bcftools).High-quality singlenucleotide polymorphisms (SNPs) were identified with the VariantFiltration tool in GATK [55] with the following parameter settings: clusterSize 2, clusterWindowSize 5, QUAL < 30, QD < 2.0,MQ < 40, and FS > 60.0.
A neighbor-joining (NJ) tree was produced with Treebest(v1.9.2–2) (https://treesoft.sourceforge.net/treebest.shtml).Principal component analysis (PCA) was performed by GCTA (v1.93.2)[56].Identity-by-descent(IBD)segments were identified with IBDseq (vr1206) [57] with the following parameter settings: window = 50, LOD = 3, length = 0.01, trim = 0.For overlapping IBD segments, both higher LOD and lower recombination were required to retain segments.Owing to line Ye478’s status as a parent of Zheng58[58],some segments with the same LOD values and positions were difficult to distinguish between the two lines and were marked as Ye478/Zheng58.When the genetic constitution of each ancestral line was calculated, such segments were added to the absolute values obtained from Ye478.Gene presence/absence variation (gPAV) was characterized from the mapping BAM file with SGSGeneLoss package(v0.1)[59]with the parameter settings lostCutoff = 0.2 and minCov = 2.
2.8.Comparative genomic analysis
The published genome assemblies of B73 and other maize accessions were retrieved from MaizeGDB (https://download.maizegdb.org/) (Table S2).To identify syntenic relationships between the KA105 and B73 genomes, we extracted the longest coding sequences (CDSs) of genes, which were input into JCVI(v1.1.18) [60], and the parameter ‘‘-cscore = 0.99” was set.Gene family construction was performed with OrthoMCL (v2.0.9) [61]based on the longest protein sequences.GO enrichment of gene sets was calculated with clusterProfiler (v3.18.1) with a cutoff P value < 0.05 [62].Gene clusters were identified based on the output of OrthoMCL, and the maximum distance was set to 250 kb for two neighboring genes in a cluster[19].The RGAugury pipeline[63] was used to annotate resistance gene analogs (RGAs) with default parameters.
Genome alignment between KA105 and B73 was performed with the NUCmer program of MUMmer4 (v4.0.0) [64] using the parameter settings ‘‘-mumreference -g 1000 -c 90 -l 40”.The delta-filter program was used to identify alignment blocks with the parameter setting ‘‘-1”.The show-snps program was used to detect SNPs and insertions/deletions (InDels) with the settings ‘‘-ClrT-x 1”.Only variations located on the same chromosomes were retained.To identify PAV fragments, a sliding window (window size, 500 bp; step, 100 bp) was used to divide the KA105 genome.All divided sequences were then aligned against the B73 genome with the BWA-MEM algorithm (-w 500 -M) in BWA [65].If a sequence failed to be aligned to the B73 genome, or aligned with< 25% coverage, it was defined as a KA105-specific sequence.The same method was used to identify B73-specific sequences.For the identification of KA105 and B73 PAV genes, the longest CDS per gene was extracted,and genes with>75%of their CDS covered by specific sequences were defined as putative PAV genes [11].To exclude potential false positives, a second method was used.The KA105/B73 longest CDS sequences were mapped to the B73/KA105 genome using GMAP (gmap-2018-07-04) [66].Putative PAV genes with an alignment with < 25% coverage, or < 90% identity were filtered out to leave the final PAV genes.KA105-specific gene analyses using the second method were also performed between KA105 and the published genomes of other maize inbred lines.KA105-specific genes that were missing from or showed low identity in the genomes of at least two maize genotypes relative to KA105 were retained.To identify SVs between the KA105 and B73 genomes,the B73 assembly was first aligned to the KA105 genome with Minimap2 (v2.24) [67] with the parameter settings ‘‘-ax asm5”.SVs (> 50 bp) were detected in the resulting alignments with SyRI (v1.6) [68].
2.9.Transcriptome analysis
Raw sequencing reads from 21 RNA-seq libraries of maize B73 kernels (10, 12, 14, 16, 18, 20, 22, 24, 26, 28, 30, 32, 34, 36, and 38 DAP) were retrieved from the NCBI SRA database (https://www.ncbi.nlm.nih.gov/sra) under accession ID SRP037559 [69].The RNA-seq reads were then aligned to the B73 reference genome with a pipeline similar to that used for KA105 RNA-seq processing.The mean value of all replicates was calculated for the gene expression matrix of both the KA105 and B73 kernels and only genes with TPM > 1 in at least 50% of the samples were retained.The TPM matrix was transformed by log2(TPM + 1) and 1-to-1 orthologous genes with a coefficient of variation(CV)>0.1 were identified.The retained genes were used to detect pair-wise differential correlations between KA105 and B73 with comp.2.cc.fdr function in Diff-Corr package (v0.4.2) [70], using a stringent cutoff of a local false discovery rate(FDR)<0.005.In brief,the package separately calculated Pearson’s correlation matrix for each dataset and tested the differential correlation between the two datasets via Fisher’s ztest.
For time-series RNA-seq data of kernel development, differentially expressed genes (DEGs) were identified by two approaches:1) pairwise comparisons between time points using DESeq2 [71],and 2) time-course comparisons using ImpulseDE2 [72].Genes with Padj< 0.001 in ImpulseDE2 output and |log2(fold change)|≥1 and Padj< 0.05 in DESeq2 output were assigned as DEGs.For the stress-tested samples, DESeq2 (v1.30.1) was used to identify differential expression between the control and treatment groups by the above criteria.To identify potential stress-response modules,31 libraries from stress and control samples were used to construct a gene co-expression network with R package WGCNA(v1.70–3) [73].Genes with TPM value > 5 in at least one library and CV > 0.5 were retained.A soft threshold (β) was determined based on a scale-free distribution,with a value of 14 selected.MergeCutHeight was set at 0.25, and the minimum module size was set to 100.The connectivity within the module(kWithin)was then estimated, and genes in the top 10% of kWithin were selected as hub genes.
3.Results
3.1.Genome assembly and annotation of the maize inbred line KA105
The newly developed maize inbred line KA105 was wholegenome sequenced using a combination of Illumina, PacBio longread sequencing, and Hi-C technologies.A total of 296.65 Gb of PacBio long reads (with 138.75× coverage) were used for contiglevel assembly.The assembled contigs were polished with 120.65 Gb of Illumina short reads (with 56.30× coverage)(Fig.1B; Table S3).A set of 250.21 Gb Hi-C data (~117.03× cover age) were used to anchor and orient the polished contigs as 10 pseudo-chromosomes.After Hi-C scaffolding, the KA105 genome was finally assembled at a length of 2138 Mb with a contig N50 length of 2.16 Mb (Tables 1, S4).Genome sequences (2047 Mb)were clustered and oriented as 10 pseudochromosomes, which accounted for 95.74% of the final genome size (Fig.1C; Table S5).Alignment of the Illumina short reads of KA105 to this newly assembled genome revealed a mapping rate of 99.67% and read coverage of 99.46% (Fig.S2).The genome showed a high LAI score of 30.57 (Table 1).Of the core Embryophyta genes, 96.4%(1387/1440) were complete in the final assembly (Fig.1D), a proportion comparable to those for the latest genomes of B73,Mo17,Oh7B,CML69,and SK inbred lines(Table S6).These statistics confirmed the quality of the KA105 genome assembly.
Repeat sequences comprised 85.33% of the genome: retroelements (78.71%), DNA transposons (3.51%), and satellites (3.11%).Among them, the Copia and Gypsy families were the most dominant TEs, representing respectively 23.49% and 44.63% of the genome(Table S7).The overall composition of the repetitive elements in KA105 was similar to those of the B73 and Mo17 genomes[7,11].A total of 38,933 protein-coding genes with 84,330 transcripts were predicted (Fig.S3; Tables 1, S8).Of these genes,37,963 (97.51%) were functionally annotated in at least one of the public databases(Fig.S4),and 25,078(64.41%)overlapped with TEs (Fig.S5).BUSCO evaluation showed that 99.0% of the core Embryophyta genes could be detected using the KA105 proteincoding gene annotation (Table S6).
3.2.Population structure and genomic constitution of KA105
To investigate the genetic constitution of KA105, we analyzed the whole-genome resequencing data of KA105 and B73, in addition to seven KA105 ancestral lines (Ye478, Zheng58, Chang7-2,PH6WC, PH4CV, Xu178, and HuangC) (Table S9).We identified 1,205,088 SNPs among these lines (Fig.S6).Both PCA and the NJ tree showed that KA105 was separated from the other eight lines(Fig.2A–B).

Table 1 Summary genome-assembly statistics for maize inbred line KA105.
Of the total genomic sequences in KA105, 90.22% (1.85 Gb) of could be traced back to ancestral lines in the pedigree (Fig.2C;Table S10).The largest proportion of genomic sequences in KA105 was from PH4CV (40.25%), followed by Ye478 (18.87%),PH6WC (18.40%), Xu178 (8.72%), Zheng58 (1.85%), Chang7-2(1.38%), and HuangC (0.75%).These results indicated that PH4CV was the major genetic contributor to KA105 and that the KA105 genome retained the genome sequences of multiple inbred lines with distinct genetic backgrounds.gPAV values for the seven ancestral lines based on the KA105 genome revealed that 6.42%(2500) of the total genes were dispensable (absent in at least one line in the pedigree) (Table S11).GO enrichment analysis also revealed that these genes were involved primarily in ‘‘cell wall macromolecule biosynthetic process”, ‘‘dioxygenase activity”, and‘‘xylosyltransferase activity”,indicating that these terms may function in the specific phenotype of KA105(Fig.S7).Thus,the genome sequences of KA105 were generated mainly by genetic recombination during breeding selection.
3.3.Genomic variations between KA105 and B73
We selected the first and most widely used reference genome of maize, B73 (B73_v5), as a comparison to KA105 for subsequent analysis from >50 maize accessions for which whole-genome sequences were available.To identify gene-content differences between KA105 and B73, genomic sequences of annotated protein-coding genes were first compared using JCVI, revealing 24,666 orthologous pairs: 24,646 (63.30%) in KA105 and 24,644(61.99%)in B73.OrthoMCL identified 21,566 orthogroups,of which 19,780 were shared between KA105 and B73.There were respectively 1023 and 544 species-expanded orthogroups that covered 5488 (14.10%) and 2246 (5.65%) genes for KA105 and B73(Table S12), suggesting that more families are expanded in the KA105 genome than B73 genome.The KA105 expanded genes were enriched in ‘‘DNA repair”, ‘‘peroxidase activity”, and ‘‘serine-type endopeptidase activity” (Fig.S8A), while genes from the B73-expanded orthogroups were enriched in ‘‘calcium ion binding”,‘‘response to abscisic acid”, and ‘‘carbohydrate binding”(Fig.S8B).Several KA105 expanded gene clusters were identified by clustering of genes within orthogroups (Fig.S9).A KA105 expanded orthogroup encoding hydroxycinnamoyltransferase on chromosome 3 was divided into two clusters in KA105,in contrast to one cluster in B73 (Fig.S10A).Another KA105 expanded orthogroup encoding peroxidase protein may be involved in phenylpropanoid biosynthesis on chromosome 10.It had six genes as one gene cluster in KA105 that were homologous to three genes(one gene cluster) in B73 (Fig.S10B).Additionally, the number of RGA genes in KA105 (1021) was slightly higher than that in B73(956) (Table S13).KA105 also contained several expanded RGA subfamilies: 664 and 646 RLK-type genes in KA105 and B73,respectively.
The syntenic regions of KA105 and B73 contained 7,775,278 SNPs and 1,164,250 InDels were identified in the regions of synteny between KA105 and B73, with means of 5.65 SNPs and 0.85 InDels per kb (Fig.3A; Table S14).Among them, 167,004 (2.15%)SNPs and 20,187 (1.73%) InDels resided in exonic regions(Table S15).We detected 18,289 KA105-specific genomic segments(14,359,698 bp) and 17,781 B73-specific genomic segments(12,776,200 bp) longer than 500 bp (Fig.S11).A total of 58 KA105-specific PAV genes and 61 B73-specific PAV genes were located in these segments (Tables 2, S16).Five KA105-specific PAV genes belonged to RGA, although this was not the case for any of the B73-specific PAV genes.Fifty-eight KA105-specific PAV genes were enriched mainly in ‘‘defense response” and ‘‘dioxygenase activity” (Fig.S12), a finding indicating stronger resistance for KA105 than B73.We identified 2933 translocations(22.79 Mb), 38 inversions (15.53 Mb), and 481 duplications(3.37 Mb) in KA105, as well as 3073 duplications (15.26 Mb) in B73 (Fig.3B; Table S17).Of these SVs, 27 exceeded 100 kb in the KA105 genome (Table S18).The largest inversion region, of 12.37 Mb, was located on chromosome 3 (93.83–106.21 Mb).For the largest inversion, syntenic relationships of these genes were largely maintained between inverted sequences in the two genomes (Fig.3B).Among gene structural variations, respectively,13,124 (39.70%),3006 (9.09%),and 1411 (4.27%)KA105 genes displayed amino acid changes,large-effect mutations,and large structural mutations (Table 2).Overall, these results suggest that extensive fine-scale variations are present between the genomes of KA105 and B73.
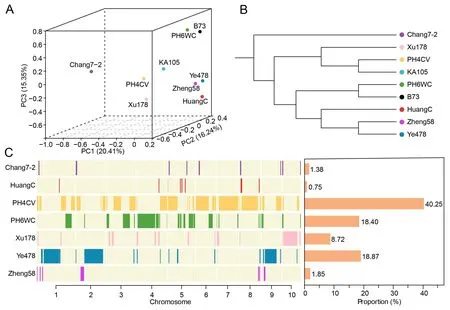
Fig.2.The genetic characteristic of maize inbred line KA105.(A) Three-dimensional principal component analysis (PCA) scatter plot of the first three components.(B)Phylogenetic tree of KA105 and eight elite maize inbred lines.(C) Distribution and genomic proportion of identity-by-descent (IBD) regions inherited from seven ancestral lines to KA105.Colors in the left-hand plot represent the IBD fragments retained by KA105 from various ancestral lines.The right-hand plot displays the genomic proportion of IBD fragments retained by KA105 from ancestral lines.

Fig.3.Genomic features of maize inbred line KA105.(A)Genomic landscape of KA105;a,transposable element(TE)number(window size of 1 Mb);b,gene number(window size of 1 Mb); c, gene expression (transcripts per million, TPM; the highest expression of sequenced samples is shown with log2 (TPM + 1); d, GC content (window size of 1 Mb); e, single-nucleotide polymorphisms (SNPs) and insertions/deletions (InDels) compared to the B73 genome (the outer and inner layers indicate SNPs and InDels,respectively);f,presence/absence variation(PAV)sequences of the KA105 genome.Chr,chromosome.The outer gray circle represents the chromosome length(Mb)of KA105.(B) Structural variations (SVs) between the KA105 and B73 genomes.Reference and query refer to KA105 and B73, respectively.Orange, blue, green, and grey represent inversion, duplication, translocation, and syntenic regions, respectively.The plot in the lower-right corner shows the synteny of genes in the largest inversion (located on chromosome 3) between KA105 and B73.
3.4.A stress-responsive transcriptome atlas of KA105 reveals new stress-induced genes
To construct a stress-responsive transcriptome atlas of KA105 based on the newly assembled genome, transcriptome data from leaves for PEG, LN, SLB, and SCR treatments were collected and aligned to the KA105 genome.A clear separation of each stress and a high similarity among biological replicates within each treatment were observed (Fig.S13; Table S19).Pairwise contrasts between the control and treatment groups for each stress condition were used to identify DEGs.A total of 13,540 DEGs were identified in response to PEG (8153), LN (2384), SLB (6978), and SCR(2354)(Fig.S14).Among them,37.87%(5128)responded to at least two stresses (Fig.4A).Many GO terms or pathways were enriched in all stresses, including ‘‘photosynthesis”, ‘‘phenylpropanoid metabolic process”and‘‘lignin metabolic process”(Fig.S15).However, several significant GO terms or pathways were specific to each stress, such as ‘‘jasmonic acid mediated signaling pathway”and ‘‘ABC transporters”.A set of 156 DEGs (named co-DEGs) were shared among all stresses, of which only 58 (51 down-regulated and 7 up-regulated) showed the same expression patterns under different stress treatments (Table S20).These down-regulated genes were involved mainly in the ‘‘photosynthesis” pathway.A set of 13 KA105-specific PAV genes showed differential expression after at least one treatment (Fig.4B).
Co-expression networks were identified by the weighted gene co-expression network analysis of 10,946 expressed genes.Of 17 modules harboring 113–3057 genes (Table S21), 10 modules were correlated with stress at P<0.01.Among these significant modules,the tan, pink, blue, and midnightblue modules showed their highest correlations with different stresses (Fig.S16).The tan module was significantly correlated with PEG stress, and the genes were involved in ‘‘regulation of stomatal opening” and ‘‘glucose-6-phosphate dehydrogenase activity” (Fig.4C–D).The blue module was significantly correlated with SLB and contained gene ZmCCoAOMT2 (Zm09G003690), which confers multiple disease resistance [74].Genes within the module were enriched mainly in ‘‘lignin metabolic process” and ‘‘phenylpropanoid biosynthetic process”.The cyan module showed a significant correlation with two abiotic stresses, suggesting that the genes of the module respond to abiotic stresses.Of 13 KA105-specific PAV genes involved in stress-response modules,eight,including one hub gene(Zm02G001910) were induced by at least one stress (Table S21).One representative example is the gene Zm05G021080, which participated in the tan module and was up-regulated under PEG treatment.This finding suggests that KA105-specific PAV genes may change their regulation pattern relative to that of B73 in response to stress.
3.5.Difference in transcriptional regulation between KA105 and B73
Comparing traits associated with kernel development between KA105 and B73 revealed differences in kernel composition and morphology (Figs.5A, S17).Accordingly, RNA-seq was performed with kernels from various DAPs in KA105 and B73 (Table S19).In at least 50% of samples for both genotypes, 48.7% of genes were expressed in kernel tissues.Of these expressed genes, 9219 were 1-to-1 orthologous genes with high expression variation(CV > 0.1) in kernels (Fig.5B).In total, 234,859 gene pairs were simultaneously differentially correlated in KA105 and B73.Of the orthologous genes, 93.4% (8610) were involved in the change of expression correlations in the two genotypes.These gene pairs could be divided into six categories based on their correlations,with the number of gene pairs in each pattern varying from 917 to 143,501 (Fig.S18).These six correlation change patterns represented different regulatory mechanisms.The appearance of‘‘switched” gene pairs also indicated that the molecular mechanisms involved in kernel development vary between KA105 and B73.
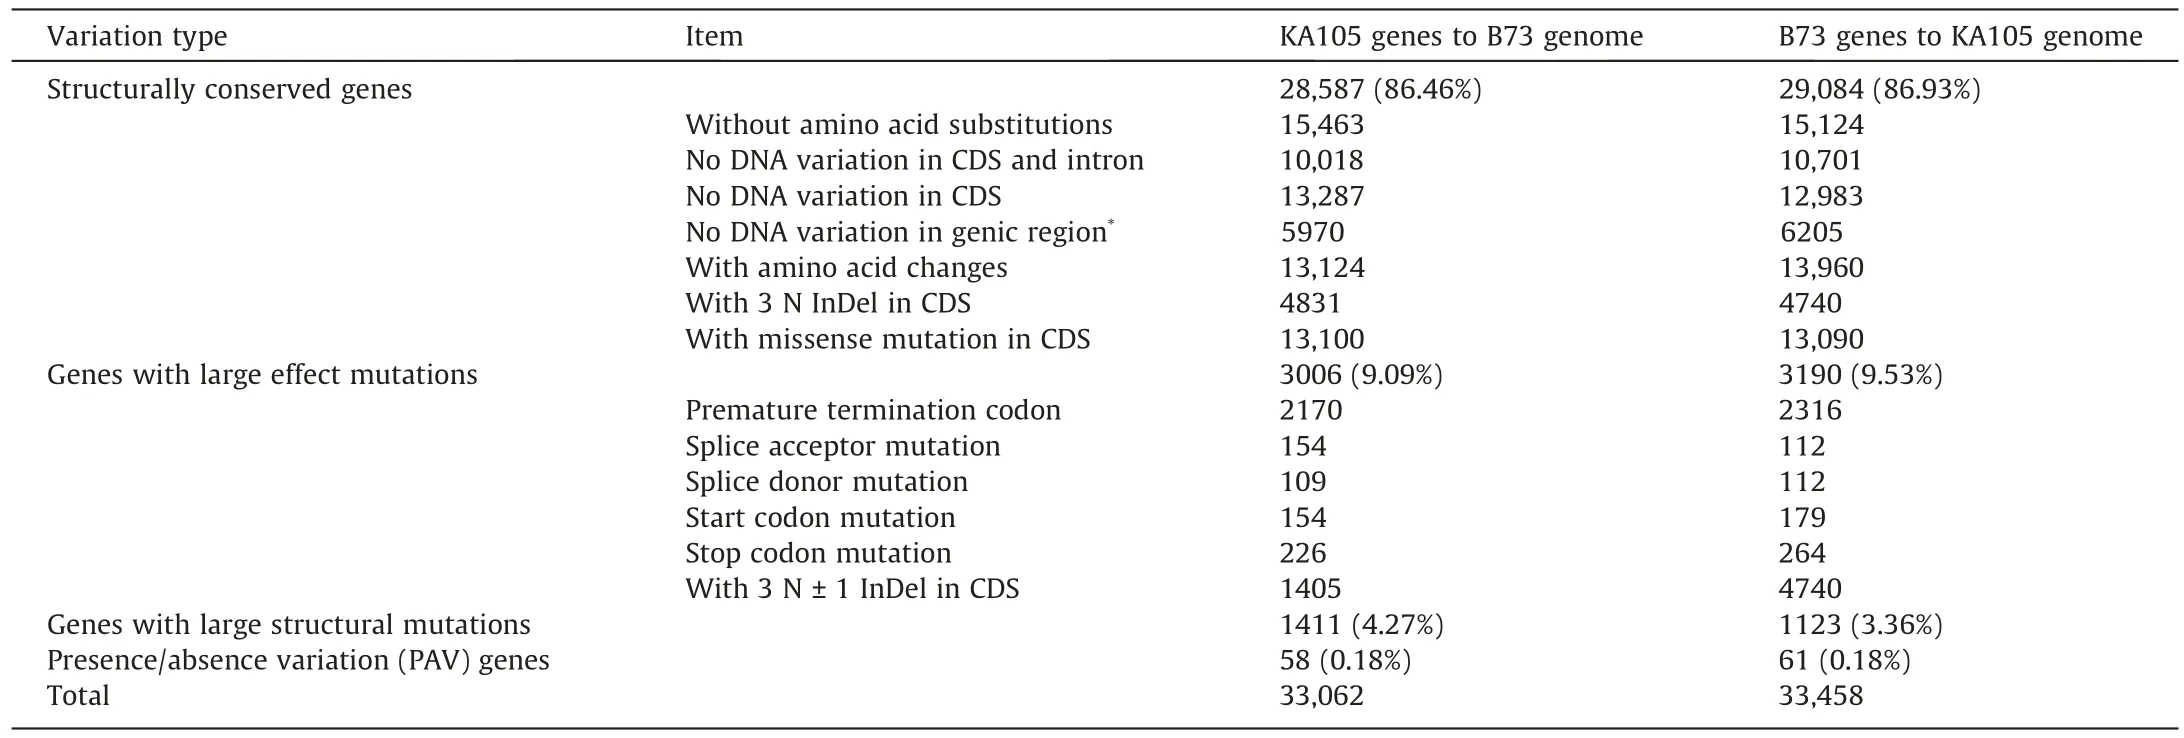
Table 2 Variation within genes compared between the KA105 and B73 genomes.

Fig.4.Stress-response transcriptome atlas of KA105.(A) Upset diagram shows the overlap of differentially expressed genes (DEGs) from four stress-treatment groups:polyethylene glycol(PEG),low nitrogen(LN),southern leaf blight(SLB),and southern corn rust(SCR).(B)Differential expression of KA105-specific presence/absence variation(PAV)genes relative to B73 after PEG,LN,SLB,and SCR,respectively.For each gene,log2(fold change)is shown.(C)The network of the top 200 edges with the highest weights for the tan, pink, blue, and midnightblue modules.The size of each node represents the within-module connectivity of the node to adjacent genes.Purple, orange, and red represent transcription factors(TFs),hub genes,and PAV genes.Green represents TFs identified as hub genes.(D)Significant Gene Ontology(GO)terms(top 5)of genes in the tan, pink, blue, and midnightblue modules.
For the KMC trait,a relative difference was observed in the variation between KA105 and B73 at several stages, including 28 and 63 DAP (Fig.5C).Focusing on two recently reported KMC-related genes (Zm00001eb397600 and Zm00001eb316620) [25,75], we also found different correlations within the same gene pairs in the two genotypes (Fig.S19A, B).The gene pair Zm00001eb397600 and Zm00001eb431340 belonging to pattern 1 showed a positive correlation in B73 but a negative correlation in KA105 (Figs.5D, S19A).We detected four ‘‘switched” gene pairs for Zm00001eb316620,with the strength of co-expression being changed in the gene pair of Zm00001eb316620 and Zm00001eb257850 between B73(r= -0.77) and KA105 (r = 0.96) (Figs.5D, S19B).For the kernel quality traits, a representative example is the gene Zm00001eb318740,which encodes a bZIP transcription factor and regulates 27-kD γzein gene transcription in the endosperm [76].This gene showed no correlation with Zm00001eb111640 in B73, but was positively correlated in KA105 (Figs.5D, S19C).For the kernel sizeassociated traits, a functional gene for kernel size, Zm00001eb344400 (ZmGRAS11) [77], showed no correlation with Zm00001eb131690 in B73, but was negatively correlated with Zm00001eb131690 in KA105 (Figs.5D, S19D).The TFs showed a lower frequency of the ‘‘switched” phenomenon than non-TFs(Fig.S20), suggesting that TFs may tend to be more stable in gene expression and regulation for different genotypes.Taken together,these analyses indicate an abundance of gene co-expression differences between KA105 and B73 genotypes during kernel development.
4.Discussion

Fig.5.Overview of kernel morphology and differential correlation analysis between KA105 and B73.(A)Kernel morphology of maize inbred lines KA105 and B73.Scale bar,5 mm.(B)Strategy for identifying gene pairs with differential correlations.(C)The kernel moisture content of kernel from different time points after pollination for KA105 and B73.(D) Visualization of differentially co-expressed gene pairs between KA105 and B73 for genes Zm00001eb397600, Zm00001eb316620, Zm00001eb318740, and Zm00001eb344400.The upper and lower plots display the correlations of gene expression (transcripts per million, TPM;gene expression was shown with log2(TPM+1))in KA105 and B73, respectively.
To handle future threats of food security and climate change,assembling high-quality reference genomes of diverse maize germplasm resources is vital to facilitate genomics-assisted breeding programs.The current research on maize genome sequencing is still insufficient[7,10–20], especially in terms of missing the complete genome of newly developed elite germplasms, which has been improved to fit the plastic environments.In this study, we generated a chromosome-level genome assembly for a new maize inbred line KA105, which showed genetic divergence with the widely used line B73 and has several desirable characteristics.The genome assembly of KA105 is valuable for enriching genomic diversity and improving maize genomic and breeding researches.
Firstly,the high-quality genome of KA105 allows us to discover genomic variations across the entire genome, particularly SVs,which contribute to the understanding of phenotypic diversity and breeding efforts.Previous studies have screened SVs using large-scale sequencing data of short reads, and several highquality genomes; however, there are still limitations to the comprehensiveness and accuracy of SVs [7,12].By aligning the widely used B73 genome to the newly assembled genome of KA105, we detected 58 KA105-specific PAV genes, 2933 translocations, 38 inversions, and 481 duplications in KA105.Compared with other maize genome maps published, 2869 large (> 100 kb) variations(Table S18)and 3678 KA105-specific genes(Table S22)were identified in the KA105 genome.These variations and specific genes are valuable for understanding the specific phenotypes of KA105.Integration of the newly assembled genome into existing ones improves the quality of the maize genome map, leading to better genetic and breeding research, as well as understanding of maize domestication and improvements at the population level.
Secondly, the high-quality genome of KA105 presents an extra resource for investigating the genetic basis of key traits to allow the acceleration of genetic improvements.Line KA105 carries several desirable traits,such as high yield and disease resistance,indicating that many favorable alleles were accumulated in KA105[78].Comparing the KA105 and B73 genomes revealed more expanded genes involved in DNA repair and peroxidase activity,and more RGA genes in KA105, which could be responsible for the disease resistance of KA105.Integrating the genome of KA105 with transcriptome data from multiple stresses showed that 13 KA105-specific PAV genes were responsive to at least one stress, and 156 co-DEGs were responsive to four types of stresses.Further analysis might facilitate the mining of new resistance genes/variations and multiple stress-resistance genes.We found many co-DEGs involved in both kernel development and stress response (Fig.S21), which were involved mainly in lignin biosynthetic and polysaccharide binding.This will provide more clues for the identification of genes regulating both kernel development and stress resistance.We constructed several RIL populations derived from KA105 and an association population consisting of inbred lines from the Shaan A and Shaan B groups.We are currently carrying out the genetic dissection of several key traits using these populations,such as grain dehydration rate and resistance to drought, Gibberella ear rot and Gibberella stalk rot.Preliminary results have revealed that KA105 has accumulated many favorable quantitative-trait loci and alleles.The high-quality KA105 genome provides a foundation for mining favorable natural variations of key traits.
Lastly, the high-quality genome of KA105 has applications in identifying breeding signatures and guiding breeding research.In our previous work, six inbred lines (KA115, KA215, KA325,KA205, KA023, and KA028) were developed by improving KA105,of which KA115, KA215, and KA325 have been used as parents for several commercial varieties, indicating the potential of KA105 in germplasm enhancement.However, breeding strategies involving the selection of visible phenotypes have limited the genetic gain of breeding efforts.We clarified the genomic characterization and composition of KA105 by integrating the complete pedigree with a high-quality genome, which helped us capture breeding signatures and identify improvement directions and strategies for maize breeding.Direct and rapid comparison of functional genes and variants has also contributed to the development and use of molecular markers to increase selection accuracy.KA105 carries favorable alleles of ChSK1 [79] and KNR6 [80] and lacks the low-frequency gene RppK for resistance against SCR[81].We could introduce RppK into KA105 to increase disease resistance.A breeding improvement procedure could be built using the high-quality genome of KA105, which will accelerate germplasm innovation and could also be used as a reference for other maize breeding programs.
CRediT authorship contribution statement
Ting Li:Data curation, Methodology, Software, Visualization,Writing–original draft.Shutu Xu:Conceptualization,Supervision,Validation, Writing – review & editing.Jiawen Zhao:Software,Methodology.Yapeng Wang:Software, Investigation.Jun Zhang:Investigation,Validation.Xin Wei:Investigation,Validation.Jianzhou Qu:Investigation,Validation.Ruisu Yu:Investigation,Validation.Xinghua Zhang:Supervision, Validation.Chuang Ma:Conceptualization, Supervision, Writing – original draft, Writing–review&editing.Jiquan Xue:Conceptualization,Funding acquisition, Project administration, Supervision, Writing – review &editing.
Declaration of competing interest
The authors declare that they have no known competing financial interests or personal relationships that could have appeared to influence the work reported in this paper.
Acknowledgments
This work was supported by the China Agriculture Research System(CARS-02–77),the Shaanxi Province Research and Development Project(2021LLRH-07),and the Yangling Seed Industry Innovation Center Project (YLZY-YM-01).We are grateful to Profs.Qin Yang and Xiaojun Nie of Northwest A&F University for their suggestions on manuscript improvement.We thank the Plant Protection Institute of Hebei Academy of Agriculture and Forestry Sciences for helping Puccinia polysora inoculation.We also thank the High-Performance Computing platform of Northwest A&F University (HPC of NWAFU) for providing computing resources.
Appendix A.Supplementary data
Supplementary data for this article can be found online at https://doi.org/10.1016/j.cj.2023.08.006.
- The Crop Journal的其它文章
- OsSPL10 controls trichome development by interacting with OsWOX3B at both transcription and protein levels in rice (Oryza sativa L.)
- Ectopic expression of OsNF-YA8, an endosperm-specific nuclear factor Y transcription-factor gene, causes vegetative and reproductive development defects in rice
- Mechanisms of autophagy function and regulation in plant growth,development, and response to abiotic stress
- ZmDRR206 functions in maintaining cell wall integrity during maize seedling growth and defense response to external stresses
- The plasmodesmata-associated β-1,3-glucanase gene GhPdBG regulates fiber development in cotton
- The MabHLH11 transcription factor interacting with MaMYB4 acts additively in increasing plant scopolin biosynthesis