
The Influence of Meridional Variation in North Pacific Sea Surface Temperature Anomalies on the Arctic Stratospheric Polar Vortex※
2023-12-26 09:12TaoWANGQiangFUWenshouTIANHongwenLIUYifengPENGFeiXIEHongyingTIANandJialiLUO
Advances in Atmospheric Sciences 2023年12期
Tao WANG, Qiang FU, Wenshou TIAN, Hongwen LIU, Yifeng PENG,Fei XIE, Hongying TIAN, and Jiali LUO
1College of Atmospheric Sciences, Lanzhou University, Lanzhou 730000, China
2Key Laboratory of Western China's Environmental Systems of the Ministry of Education, College of Earth and Environmental Sciences, Lanzhou University, Lanzhou 730000, China
3Department of Atmospheric Sciences, University of Washington, Seattle 98101, USA
4College of Global Change and Earth System Science, Beijing Normal University, Beijing 100875, China
ABSTRACT This study examines the dependence of Arctic stratospheric polar vortex (SPV) variations on the meridional positions of the sea surface temperature (SST) anomalies associated with the first leading mode of North Pacific SST.The principal component 1 (PC1) of the first leading mode is obtained by empirical orthogonal function decomposition.Reanalysis data,numerical experiments, and CMIP5 model outputs all suggest that the PC1 events (positive-minus-negative PC1 events),located relatively northward (i.e., North PC1 events), more easily weaken the Arctic SPV compared to the PC1 events located relatively southward (i.e., South PC1 events).The analysis indicates that the North PC1-related Aleutian low anomaly is located over the northern North Pacific and thus enhances the climatological trough, which strengthens the planetary-scale wave 1 at mid-to-high latitudes and thereby weakens the SPV.The weakened stratospheric circulation further extends into the troposphere and favors negative surface temperature anomalies over Eurasia.By contrast, the South PC1-related Aleutian low anomaly is located relatively southward, and its constructive interference with the climatological trough is less efficient at high latitudes.Thus, the South PC1 events could not induce an evident enhancement of the planetary-scale waves at high latitudes and thereby a weakening of the SPV on average.The Eurasian cooling associated with South PC1 events (positive-minus-negative PC1 events) is also not prominent.The results of this study suggest that the meridional positions of the PC1 events may be useful for predicting the Arctic SPV and Eurasian surface temperature variations.
Key words: Arctic stratospheric polar vortex, stratosphere–troposphere interactions, North Pacific sea surface temperature,
1.Introduction
Stratospheric circulations have wide ranging effects on tropospheric weather and climate (e.g., Baldwin and Dunkerton, 2001; Thompson et al., 2011; Zhang et al., 2016; Wang et al., 2020, 2022a; Rao and Garfinkel, 2021).An anomalous weak Arctic stratospheric polar vortex (SPV) and stratospheric sudden warming (SSW) events (e.g., Rao et al.,2019b) favor negative surface temperature anomalies and cold surges over Eurasia and North America (e.g., Kolstad et al., 2010; Garfinkel et al., 2017; Huang et al., 2017; Lu et al., 2021, 2022).On the other hand, an enhanced Arctic SPV tends to induce severe ozone loss, e.g., the unexpected severe ozone depletion and ozone hole events in 1997, 2011,and 2020 (e.g., Manney et al., 2011; Rao and Garfinkel,2020).Moreover, anomalous stratospheric signals have important implications for the improvement of extended range forecasts (e.g., Baldwin et al., 2003; Roff et al., 2011).Thus, it is important to understand the Arctic SPV variations.
The linkages between tropical anomalies and the Arctic have been widely reported (e.g., Garfinkel and Hartmann,2007; Xie et al., 2012; Kren et al., 2016; Rao and Ren,2016a, 2018; Kang and Tziperman, 2017; Polvani et al.,2017; Yang et al., 2017; Song and Son, 2018; Hu et al.,2019).As the most important climate variability in the tropics, the El Niño-Southern Oscillation (ENSO) and its influence on the Arctic SPV have received much attention (e.g.,Domeisen et al., 2015; Iza and Calvo, 2015; Richter et al.,2015; Rao and Ren, 2016b, 2017; Palmeiro et al., 2017; Weinberger et al., 2019).El Niño acts to enhance the Pacific/North American teleconnection (PNA) pattern (or Aleutian low) and planetary waves (e.g., Garfinkel and Hartmann,2008; Sung et al., 2014; Takemura and Maeda, 2016; Ren et al., 2017; Garfinkel et al., 2018), and the strengthened planetary waves further weaken the SPV (e.g., Ren et al., 2012,2019; Hegyi et al., 2014; Takemura and Maeda, 2016; Hu et al., 2017; Rao and Ren, 2018).The Arctic SPV responses to La Niña are to become cooler and stronger, but the magnitudes of those responses are smaller than the magnitudes of the responses to El Niño (e.g., Free and Seidel, 2009; Iza et al.,2016; Garfinkel et al., 2018; Domeisen et al., 2019).Additionally, the influence of ENSO on the SPV is nonlinear, and the effects of moderate El Niño and strong La Niña events on the Arctic SPV are larger than the effects of strong El Niño and moderate La Niña events, respectively (Rao and Ren, 2016b, c).
Recent studies have highlighted the role of extratropical SST anomalies in Arctic SPV variations (e.g., Jadin et al.,2010; Hurwitz et al., 2012; Li and Tian, 2017; Hu and Guan,2018; Li et al., 2018; Rao et al., 2019a, c).The leading mode of North Pacific SST anomalies, also called the Pacific Decadal Oscillation (PDO, Mantua et al., 1997), influences the Arctic SPV through affecting the Aleutian low and vertically propagating planetary waves (e.g., Mills and Walsh, 2013; Rao et al., 2019a, c).Using numerical simulations, Hurwitz et al.(2012) confirmed that the relatively cooler SSTs in the middle North Pacific induce a weak SPV and more SSW events in the Arctic stratosphere.Woo et al.(2015) found that a weak Arctic SPV occurs more frequently during positive (+) PDO winters than during negative (–)PDO winters.Based on a 200-yr control simulation using the Whole Atmosphere Community Climate Model(WACCM), Kren et al.(2016) further confirmed that a +PDO is marked by a weaker SPV.Rao et al.(2019a, c) investigated the combined effects of ENSO and the PDO on the Arctic SPV and found that the Arctic SPV response is stronger as El Niño/La Niña is configured with a +/–PDO.On a longer timescale, the North Pacific warming contributes to the cooling trend of the Arctic SPV in late winter and early spring during 1980–2009 (Garfinkel et al., 2015).In addition, the second mode of North Pacific SST anomalies(Bond et al., 2003) was also shown to modulate the Arctic SPV variations and stratospheric final warming (Hu et al.,2018; Li et al., 2018).
As mentioned above, previous studies have mainly investigated the relationship between the phase changes of the first leading mode of North Pacific SST and Arctic SPV variations.Note that the principal component 1 (PC1) of the first leading mode of North Pacific SST is obtained by empirical orthogonal function (EOF) decomposition in this study.On the other hand, a recent study has suggested that the meridional position of the PC1-linked SST anomalies also varies(Wang et al., 2022b), that is, the PC1-linked SST anomalies are located relatively northward in some winters but southward in other winters.But the effects of the position changes of PC1 events on the Arctic SPV have not been examined before.To further improve our understanding of Arctic SPV variations, this study focuses on the Arctic SPV responses to the PC1 events with different meridional positions and underlying physical mechanisms.The remainder of this paper is organized as follows.Section 2 describes the reanalysis datasets, numerical experiments, and model outputs from the phase 5 of the Coupled Model Intercomparison(CMIP5) that are used in this study.Section 3 analyzes the potential impacts of PC1 events with different positions on the Arctic SPV and the underlying mechanisms based on the reanalysis datasets.Section 4 uses CMIP5 model outputs and numerical experiments to further verify the results in section 3.Section 5 gives the conclusions and discussion.
2.Data, methods, and numerical experiments
2.1.Observational and reanalysis datasets
In this study, winter refers to the months from December of a year to February of the following year (DJF); e.g., the winter of 1950 refers to the period from December 1949 to February 1950.The SST data are obtained from the Hadley Centre Sea Ice and Sea Surface Temperature Data Set Version 1 (HadISST; Rayner et al., 2003) product at a horizontal resolution of 1° latitude × 1° longitude.Geopotential height(GH), temperature, and zonal and meridional wind data with a horizontal resolution of 2.5° latitude × 2.5° longitude are obtained from the National Centers for Environmental Prediction and the National Center for Atmospheric Research(NCEP–NCAR) Reanalysis products (Kalnay et al., 1996).The data used in this study cover the period from December 1949 to February 2016.
2.2.Methods
Because the first leading mode of North Pacific SST has a close relationship with ENSO (e.g., Alexander and Scott, 2008; Newman et al., 2016; Rao et al., 2019a), to focus on the climate impacts of North Pacific SST, ENSO signals in the various factors (SST, geopotential height, etc.)are removed by a linear regression method before analysis(Ren et al., 2017; Rao et al., 2019a).Then, following Mantua et al.(1997) and Ding et al.(2015), the first leading mode and corresponding PC1 of North Pacific SST (20.5°–65.5°N,124.5°E–100.5°W) in winter (DJF) are obtained by EOF decomposition, and the EOF1 mode is shown in Fig.1a.Note that for simplicity, we use the positive phase of PC1 to describe the anomalies composited by PC1 index hereafter.The PC1 events are selected based on the threshold of 1.0 standard deviation of PC1 indices, and the results are not sensitive to the choice of the threshold.The composite SST anomalies associated with PC1 events are shown in Fig.1b.We can see that the negative SST anomaly center has a welldefined elliptical shape, as denoted by the yellow contour in Fig.1b.Thus, the central latitude of the negative center is used to denote the position of a PC1 event.Because the SST anomalies less than –0.6 K are evident and significant, the–0.6-K contour is regarded as the border of the negative center.Note that Fig.1b denotes the difference between +PC1 and –PC1 events, and thus the border is –/+0.3 K for +/–PC1 events.The central latitude of the negative center is defined as the averaged latitude of the enclosed negative SST anomalies weighted by the SST anomalies and is calculated by the following formula (Wang et al., 2022b):

Fig.1.(a) Spatial pattern of the EOF1 mode of SST anomaly fields in the North Pacific (20.5°–65.5°N, 124.5°E–100.5°W) in winter, and the corresponding principal component 1 (PC1) is also obtained.(b) Differences in SST between +PC1 and –PC1 events.The yellow contour denotes the –0.6-K contour of the SST anomaly fields.(c) As in(a) but for differences between North +PC1 and North –PC1 events.(d) Differences in SST between South +PC1 and South –PC1 events.The green contour in (d) denotes the –0.6-K contour of the SST anomaly fields, and the yellow contour in (c) is superimposed on (d) to facilitate direct comparison.The SST data are from HadISST.The dotted regions are statistically significant at the 90% confidence level according to Student’s t-test.
where n is the total number of the grids within the border (i.e.,less/greater than –/+0.3 K for +/–PC1 events).SST(i) and Lat(i) are the SST anomaly and latitude of the ith grid cell.Latc denotes the central latitude of the negative center.
Based on Eq.(1), we obtained the central latitude of the negative SST anomalies of each PC1 event (Table 1).As shown in Table 1, the averaged central latitude of all PC1 events during 1950–2016 is 36.84°N.Then, the PC1 events are categorized into North +PC1 events, North –PC1 events,South +PC1 events, and South –PC1 events based on the phases and central latitudes of PC1 events.North +PC1/–PC1 events represent the +PC1/–PC1 events with central latitudes north of 36.84°N, while South +PC1/–PC1 events are those with central latitudes south of 36.84°N.These fourtype PC1 events are listed in Table 1.“North +PC1/–PC1 events” and “South +PC1/–PC1 events” are used in this study for simplicity, and this study does not intend to define new PC1 events.The composite SST anomalies associated with North and South PC1 events are shown in Figs.1c–d.We can see that North PC1-related negative SST anomalies(yellow contour) are located relatively northward compared to South PC1 events (green contour).Note that our results are not sensitive to the criterion of the –0.3-K contour versus–0.2-K contour to derive the central latitude of a PC1 event.
2.3.Numerical experiments
The model used for the numerical analyses in this study is the WACCM version 4 (WACCM4) (Marsh et al., 2013),and WACCM4 is part of the Community Earth System Model (CESM) framework developed by the NCAR (Vertenstein et al., 2012).This study used CESM version 1.2.0, and the case used is “FWSC”.WACCM4 has a well-resolved stratosphere with 66 vertical levels extending from the surface to approximately 140 km.The vertical resolution of this model is approximately 1 km in the tropical tropopause layer and the lower stratosphere.The model has a horizontal resolution of 1.9° × 2.5°, and the simulations performed for this study do not include interactive chemistry.
To analyze the effects of PC1 events with different central latitudes on the Arctic SPV, we conducted three timeslice experiments, including R0, R1, and R2.R0 is a control experiment that is forced by the climatologically(1950–2016) monthly mean SST.R1 used the same SST as R0 plus the SST anomalies composited by the North PC1 events over the North Pacific regions of 20°–65°N, 120°E–110°W (Fig.1c).R2 used the same SST as R0 plus the SST anomalies composited by the South PC1 events over the same North Pacific regions (Fig.1d).To alleviate the discontinuities due to added SST anomaly forcing at the boundary of the North Pacific region considered, SST anomalies at the boundary are added to the three grid points closest to the boundary with weights of 0.75, 0.50, and 0.25, respectively,moving away from the boundary (Zhou et al., 2018).To alleviate the discontinuities about time, annual cycle monthly SST anomalies composited from wintertime PC1 events were used.All the experiments were run for 34 years.The first four years are excluded for the model spin-up time, and the last 30 years are analyzed.Note that the SST forcing in the experiments is fixed, and thus the SST forcing in each model year is held constant.
2.4.Data from CMIP5
To verify the results obtained from the reanalysis data,the model outputs from CMIP5 are analyzed by using the last 100 years (1905/06–2004/05) of the first historical run.The simulations of the 100 years from CMIP5 models examine the robustness of the results by taking into account alarge variety of model simulated internal variabilities in the ocean and atmosphere.Because the low-top models simulate a worse state of the polar vortex than high-top models (Rao et al., 2022), the high-top models are used in this study.We analyzed the outputs from 20 high-top models available, i.e.,CanESM2, CMCC-CESM, CMCC-CM, CMCC-CMS,GFDL-CM3, GISS-E2-H, GISS-E2-H-CC, GISS-E2-R,GISS-E2-R-CC, HadGEM2-CC, IPSL-CM5A-LR, IPSLCM5A-MR, IPSL-CM5B-LR, MIROC-ESM, MIROCESM-CHEM, MPI-ESM-LR, MPI-ESM-MR, MPI-ESM-P,MRI-CGCM3, and MRI-ESM1.The tops of these models are equal or higher than 1 hPa.Similar to Rao et al.(2019c),PC1 events in CMIP5 model outputs are picked as follows:Firstly, the linear trends, seasonal climatology, and ENSO signals of the data are removed in each model to produce anomalies.Then, the data from the 20 high-top models are concatenated in a fixed order (i.e., from the first model, CanESM2,to the last model, MRI-ESM1) to construct a 2000-yr dataset.Finally, PC1 indices from the model data are obtained by performing EOF analysis for the 2000-yr dataset.

Table 1.North +PC1 events, North –PC1 events, South +PC1 events, and South –PC1 events during 1950–2016 based on HadISST.The averaged central latitude of all PC1 events is 36.84°N during 1950–2016.North/South PC1 events denote the PC1 events with central latitudes north/south of 36.84°N.

Fig.2.(a) Differences in zonal mean geopotential height in winter between North +PC1 and North –PC1 events.(b)As in (a) but for differences between South +PC1 and South –PC1 events.(c–d) As in (a–b), but for differences in geopotential height (colors) at 500 hPa.The contours in (c–d) represent climatological (1950–2016) 500-hPa geopotential height with zonal mean removed in winter, and the contour interval is 30 m.The solid and dashed contours represent positive and negative values, respectively.The dotted regions are statistically significant at the 90%confidence level according to Student’s t-test.The data are from NCEP–NCAR reanalysis dataset.
3.Effects of the PC1 meridional positions on the Arctic SPV
Figure 2 shows the stratospheric and tropospheric GH anomalies associated with North PC1 events and South PC1 events (+PC1 minus –PC1).Interestingly, as the PC1 events are located to the north, significant positive GH anomalies occur in the Arctic stratosphere (Fig.2a), corresponding to a weakened Arctic SPV.However, the Arctic stratospheric GH anomalies associated with South PC1 events are not positive but negative.Figures 2a–b suggest that the PC1-related Arctic SPV anomaly depends on the meridional positions of PC1 events, and North PC1 events are accompanied by a weakened Arctic SPV.Now a question arises as to what physical mechanisms are responsible for the different responses in the Arctic SPV to the PC1 events with different meridional positions.
Figures 2c–d display the North Pacific GH anomalies associated with North and South PC1 events.The North PC1-related anomalies share some similarities with those related to South PC1 events, i.e., both show a negative GH anomaly (i.e., Aleutian low anomaly) over the North Pacific,consistent with the findings of previous studies where the positive phase of PC1 events tends to deepen the Aleutian Low(e.g., Mantua and Hare, 2002; Jadin et al., 2010; Mills and Walsh, 2013; Kren et al., 2016; Rao et al., 2019c).However,the meridional positions of the North PC1-related anomalies differ from those related to South PC1 events.The North PC1-related Aleutian low anomaly is located over the northern North Pacific, and its border reaches approximately 70°N (colors; Fig.2c).The Aleutian low anomaly constructively interferes with the climatological trough (dashed contours; Fig.2c), deepening the climatological trough.Because the differences in wintertime (DJF) Arctic SPV between +PC1 and –PC1 events are mainly due to the differences in planetary-scale wave 1 as shown in the following mechanism part, we focus on the planetary-scale wave 1 hereafter.The deepened trough (Fig.2c) induces an anomalous planetary-scale wave 1 (colors; Fig.3a), which constructively interferes with the climatological planetary-scale wave 1 (contours) at mid-to-high latitudes and thus strengthens planetary-scale wave 1 (Figs.3a, c).The anomaly in Fig.3a is further averaged over the North Pacific (120°E–120°W), as shown in Fig.4a.Figure 4a clearly shows that the anomalous planetary-scale wave 1 (blue line) associated with North PC1 events is in phase with the climatological planetary wave 1 (red line) at mid-to-high latitudes, resulting in the enhanced planetary wave 1 at mid-to-high latitudes (black solid line; Fig.4c) compared to the climatological planetary wave 1 (red line; Fig.4a).To further analyze the propagation of planetary waves, Fig.5 displays the Eliassen–Palm (EP)flux (e.g., Andrews et al., 1987) anomalies associated with PC1 events.During North PC1 events, tropospheric waves are enhanced and propagate upward into the stratosphere(Fig.5a), which is dominated by wavenumber 1 (Fig.5c), consistent with Figs.3–4.The enhanced planetary-scale wave 1 converges in the Arctic stratosphere at mid-to-high latitudes(10–100 hPa, 50°–80°N; Fig.5c) and weakens the Arctic SPV (Fig.2a) (e.g., Garfinkel and Harman, 2008; Garfinkel et al., 2010; Lin et al., 2012; Ren et al., 2012, 2017; Woo et al., 2015; Rao et al., 2019c).
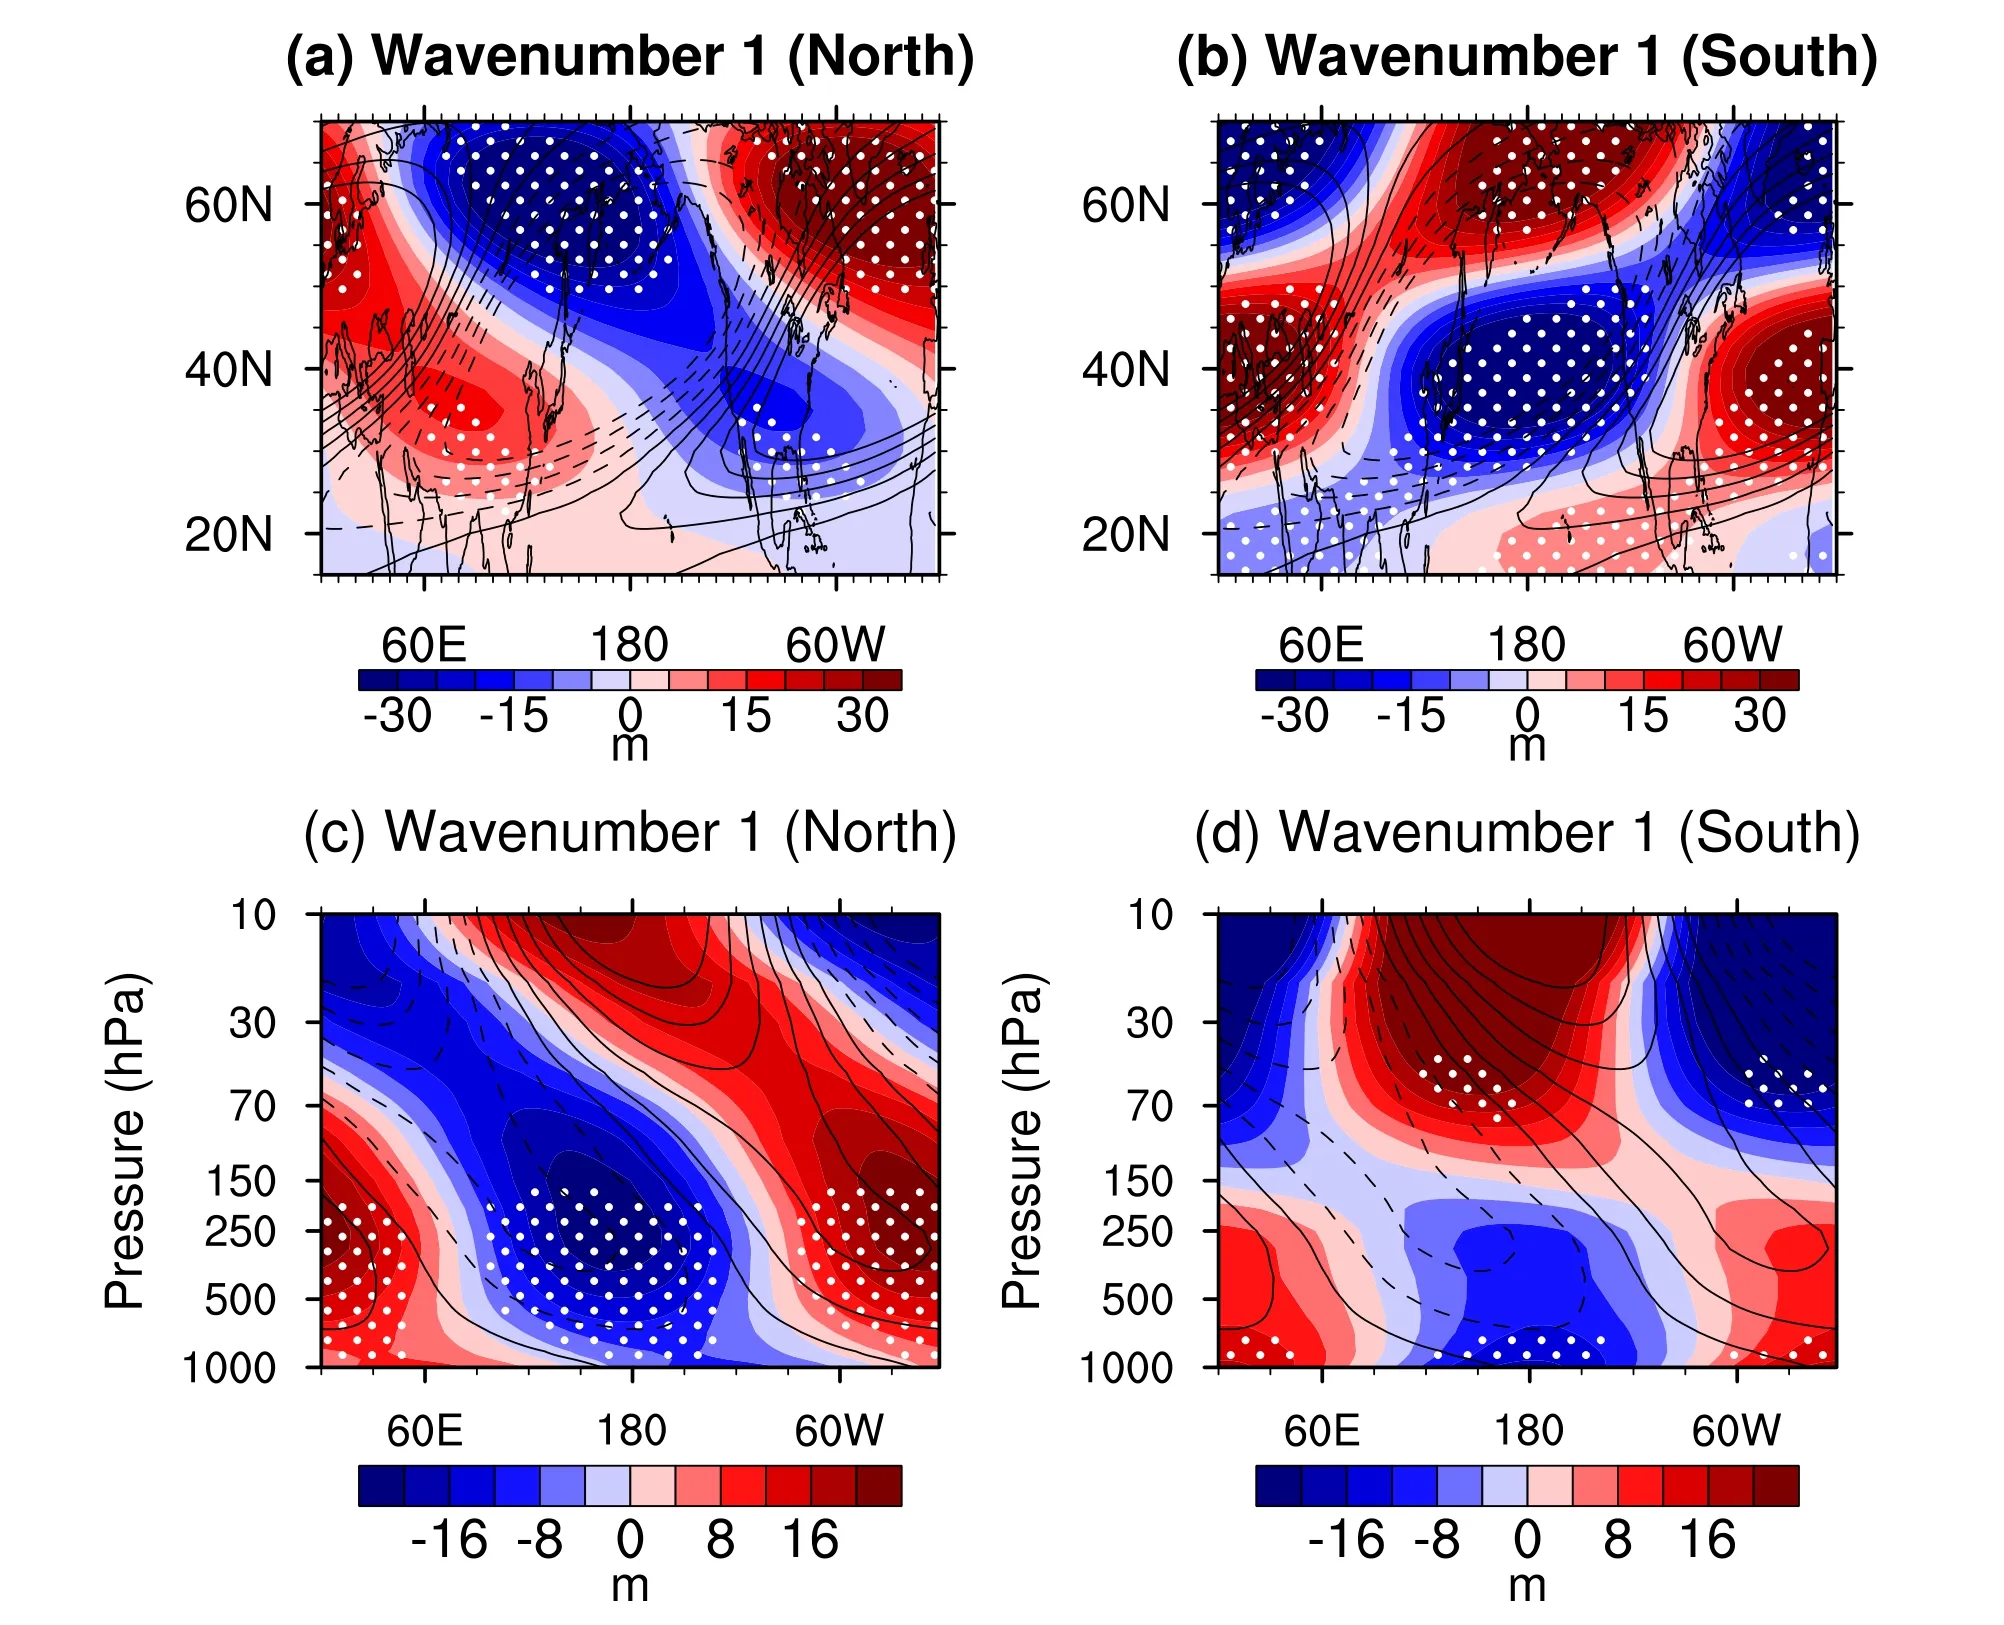
Fig.3.Differences in wintertime (a) wavenumber 1 component (colors) of geopotential height at 500 hPa and (c)wavenumber 1 component (colors) of geopotential height averaged over 30°–70°N between North +PC1 and North–PC1 events based on NCEP–NCAR reanalysis dataset.The contours in (a, c) denote corresponding climatological wavenumber 1 component of the geopotential height.The contour intervals in (a) and (c) are 10 m and 40 m,respectively.The solid and dashed contours represent positive and negative values, respectively.(b, d) As in (a, c),but for differences between South +PC1 and South –PC1 events.The dotted regions are statistically significant at the 90% confidence level according to Student’s t-test.
However, the border of the negative GH anomaly (Aleutian low anomaly) center associated with South PC1 is located relatively southward and only reaches approximately 55°N (colors; Fig.2d).The wavenumber 1 component of the GH anomaly is also located relatively southward (30°–50°N; Fig.3b).Figure 4b shows the South PC1-related wavenumber 1 component (averaged over the North Pacific)of the GH anomaly.The wavenumber 1 component of the GH anomaly is located relatively southward (30°–50°N;blue line in Fig.4b), and thus its constructive interference with the climatological wave 1 is less efficient at high latitudes(red line; Fig.4b).This does not favor the enhancement of planetary-scale wave 1 at mid-to-high latitudes (45°–80°N;dashed line in Fig.4c).Figure 4d further shows the difference in planetary-scale wave 1 averaged over the North Pacific between North and South PC1 events.This difference shows overall negative values at mid-to-high latitudes, and the climatological planetary-scale wave 1 is also negative at mid-to-high latitudes over the North Pacific (red line in Fig.4a).Thus, Fig.4d indicates that the trough of the planetary-scale wave 1 associated with South PC1 is weaker than that related to North PC1 at mid-to-high latitudes.Correspondingly, the upward planetary waves are not prominent in the stratosphere during South PC1 events (+PC1 minus –PC1)(Figs.5b, d), and the weakening of the Arctic SPV is also not apparent during South PC1 events (Fig.2b).An enhanced SPV even occurs during South PC1 events (+PC1 minus –PC1) (Fig.2b) due to positive GH anomalies over the Asia–North Pacific regions (45°–70°N, 110°E–180°;Fig.2d).The positive GH anomalies weaken the climatological trough at high latitudes (dashed contours; Fig.2d) and thus enhance the Arctic SPV (Fig.2b).

Fig.4.(a) Blue line: Differences in wavenumber 1 component (averaged over the North Pacific, i.e., 120°E–120°W)of wintertime geopotential height at 500 hPa between North +PC1 and North –PC1 events.Red line: Climatological wavenumber 1 component (averaged over 120°E–120°W) of wintertime geopotential height at 500 hPa.(b) Blue line:Same as the blue line in (a) but for differences between South +PC1 and South –PC1 events.Red line: Same as the red line in (a).(c) Black solid line is the sum of the red and blue lines in (a).Black dashed line is the sum of the red and blue lines in (b).(d) The black line is the difference between the solid line in (c) and the dashed line in (c).The bold lines in (a–d) denote statistically significant anomalies at the 90% confidence level.The data are from NCEP–NCAR reanalysis dataset.
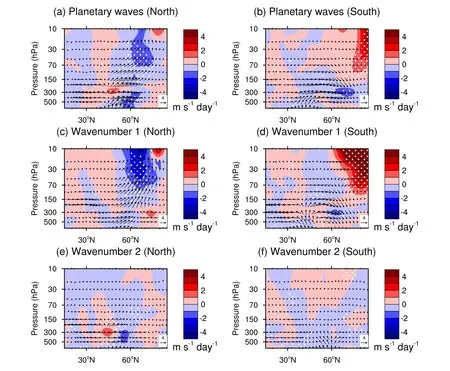
Fig.5.(a) Differences in wintertime EP flux (vectors, units of horizontal and vertical components are 1×10⁵ kg s–2 and 1×10³ kg s–2, respectively) and its divergence (colors) between North +PC1 and North –PC1 events.The EP flux is weighted by 1/ to show clearly in the stratosphere, where P is pressure (hPa).(b) As in (a) but for differences between South +PC1 and South –PC1 events.(c–d) As in (a–b) but for wavenumber 1 component of EP flux.(e–f)As in (a–b) but for wavenumber 2 component of EP flux.The data are from NCEP–NCAR reanalysis dataset.The dotted regions are statistically significant at the 90% confidence level according to Student’s t-test.
Furthermore, we estimated the fraction of how often the North and South +/–PC1 events weaken/strengthen the Arctic SPV.The polar cap height (PCH) index is used to measure the strength of the SPV; it is defined as the area-averaged GH anomaly in the Arctic stratosphere (10–50 hPa and 60°–90°N) and is normalized by the standard deviation.Generally, +PC1 events favor a weakened Arctic SPV (+PCH anomaly) and vice versa (e.g., Kren et al., 2016; Rao et al.,2019a, c).Thus, if the PCH index of a PC1 event has the same sign as the PC1 index and the absolute value of the PCH index is larger than 0.5, this PC1 event is treated as an event that weakens/strengthens the Arctic SPV.The fraction of how often the +/–PC1 events correspond to a weakened/strengthened SPV is 80.0% (eight out of ten events) during North PC1 events, while it is 8.3% (one out of 12 events) during South PC1 events.These results suggest that the North+/–PC1 events weaken/strengthen the Arctic SPV more frequently compared to South PC1 events.
4.The dependence of Arctic SPV variations on the PC1 meridional positions based on modeling results
To verify the results obtained from the reanalysis data,outputs from CMIP5 high-top models are analyzed, which provide a total of 597 PC1 events based on the threshold of 1.0 standard deviation of PC1 index.The averaged central latitude of the 597 PC1 events is 36.49°N, and the PC1 events with central latitudes north/south of 36.49°N are defined as North/South PC1 events.We obtain 139 North +PC1, 161 North –PC1, 159 South +PC1, and 138 South –PC1 events.Figure 6 shows SST and GH anomalies associated with North and South PC1 events.Indeed, negative SST anomalies associated North PC1 appear in the northern North Pacific(30°–50°N, 130°E–140°W) (Fig.6a) while those associated with South PC1 are located relatively southward (20°–45°N,120°E–140°W) (Fig.6b).Correspondingly, the negative GH anomaly (Aleutian low anomaly) related to North PC1 is also located relatively northward (Fig.6c) compared to that associated with South PC1 (Fig.6d).Thus, the North PC1-related Aleutian low anomaly effectively constructs with the climatological trough (dashed contours) at mid-tohigh latitudes (Fig.6c), deepening the trough and thereby enhancing planetary-scale wave 1 at mid-to-high latitudes(Figs.7a, c and 8a, c).The enhanced planetary-scale wave 1 further weakens the Arctic SPV associated with North PC1 events (Fig.8e).
However, the South PC1-related Aleutian low anomaly shifts relatively southward (Fig.6d) compared to North PC1(Fig.6c).Thus, its constructive interference with the climatological trough is less efficient at mid-to-high latitudes, leading to a relatively small anomaly in planetary-scale wave 1 at mid-to-high latitudes (Figs.7b, d and 8b–c).Figure 8d further displays the difference in planetary-scale wave 1 averaged over the North Pacific between North and South PC1 events.This difference shows overall negative values at mid-tohigh latitudes (Fig.8d), meaning that the South PC1-related planetary-scale wave 1 anomaly is smaller in magnitude than that associated with North PC1 at mid-to-high latitudes,consistent with Fig.8c.The small planetary wave 1 anomaly (Figs.7b, d and 8c–d) further results in a relatively small response in the Arctic SPV (Fig.8f) compared to North PC1 (Fig.8e).In addition, note that the PC1 index anomaly during North PC1 events (PC1 index anomaly=3.2; Fig.8e) is similar to that associated with South PC1 events (PC1 index anomaly=3.0; Fig.8f), suggesting that the different responses in the SPV to North and South PC1 events are mainly due to their different meridional positions.
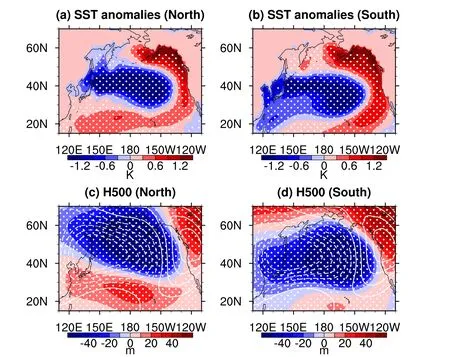
Fig.6.Differences in wintertime (a) SST and (c) geopotential height at 500 hPa (colors) between North +PC1 and North –PC1 events based on CMIP5 model outputs.The contours in (c) represent climatological 500-hPa geopotential height with zonal mean removed in winter, and the contour interval is 30 m.The solid and dashed contours represent positive and negative values, respectively.(b, d) As in (a, c), but for differences between South +PC1 and South –PC1 events.The dotted regions are statistically significant at the 90% confidence level according to Student’s t-test.
To further compare the North PC1-related SPV anomaly with those associated with South PC1, PCH anomaly is used, which is defined as the area-averaged GH anomaly in the Arctic stratosphere (10–50 hPa and 60°–90°N).Note that a positive PCH anomaly indicates an anomalous weakened SPV.Figure 9 displays PCH anomalies associated with PC1 events.For +PC1 events, the difference in averaged PCH anomalies between North +PC1 (59.7 m; red line in Fig.9a) and South +PC1 (13.7 m; blue line in Fig.9a)events is 46 m (Figs.9a, c), which is statistically significant at the 95% confidence level.For –PC1 events, the averaged PCH anomaly related to North –PC1 (–56.8 m; red line in Fig.9b) is also evidently larger in magnitude than that associated with South –PC1 (–1.4 m; blue line in Fig.9b), and their difference is –55.4 m (statistically significant at the 95%confidence level).Therefore, these results indicate that the North PC1-related Arctic SPV anomaly is significantly larger in magnitude than that associated with South PC1 events.
The above results suggest that the North PC1 events favor greater weakening of the Arctic SPV compared to the South PC1 events.We further verify these results by numerical experiments.Figures 10a and b show the anomalous SST forcing used in experiments R1 and R2, respectively.R1 and R2 are forced by the SST anomalies associated with North and South PC1 events, respectively.Figures 10c and d show the stratospheric responses induced by the SST anomalies associated with North and South PC1 events, respectively.The numerical experiments indicate that the North PC1-related SST anomalies induce positive GH anomalies in the Arctic stratosphere, i.e., a weakened Arctic SPV(Fig.10c), consistent with the results of previous studies where a positive phase of the PC1 weakens the Arctic SPV(e.g., Kren et al., 2016; Rao et al., 2019c).However, the South PC1-related SST anomalies could not induce an evident weakening of the Arctic SPV (Fig.10d).Overall, the numerical simulations also support that the North PC1 events tend to weaken the Arctic SPV while the South PC1 events could not induce an evident weakening of the SPV.
5.Conclusions and discussions
This study investigates the dependence of Arctic SPV variations on the meridional positions of the SST anomalies associated with the first leading mode (PC1) of the North Pacific SST.The reanalysis data, numerical experiments,and CMIP5 model outputs all suggest that Arctic SPV variations are closely related to the meridional positions of PC1 events.When PC1 events are located relatively northward (+PC1 minus –PC1), significantly positive geopotential height(GH) anomalies occur in the Arctic stratosphere, indicating a weakened Arctic SPV.However, when PC1 events are located relatively southward (+PC1 minus –PC1), the weakening of the Arctic SPV is not prominent on average.
Our analysis reveals that the North PC1-related negative GH anomaly (Aleutian low anomaly) is located over the northern North Pacific and thereby efficiently constructs with the climatological trough at mid-to-high latitudes, enhancing planetary-scale wave 1 at mid-to-high latitudes.The enhanced planetary-scale wave 1 further propagates into the Arctic stratosphere and weakens the Arctic SPV.However, the South PC1-related Aleutian low anomaly is located relatively southward, and its constructive interference with the climatological trough is less efficient at mid-to-high latitudes.Thus,the South PC1 events could not induce an evident enhancement of the planetary-scale waves and thereby a weakening of the SPV on average.
The above results are supported by CMIP5 model outputs.The large samples from CMIP5 indicate that the Arctic SPV response to the North PC1 is significantly larger in magnitude than that to the South PC1 due to the Aleutian low anomaly located relatively northward.Our numerical experiments also suggest that the North PC1-related SST anomalies induce significant positive GH anomalies in the Arctic stratosphere, i.e., a weakened SPV, but the response to the South PC1-related SST anomalies is relatively small.
Note that the South PC1 (+PC1 minus –PC1)-related positive GH anomalies over the Asia–North Pacific regions (45°–70°N, 110°E–180°) at high latitudes (colors; Fig.2d) and the enhancement of the SPV (Fig.2b) may be related to the relatively small sample sizes in the reanalysis data.The reanalysis data have six North +PC1, four North –PC1, six South +PC1, and six South –PC1 events, and their averaged PC1 indices are 1.35, –1.46, 1.77, and –1.43, respectively.However, the large sample sizes from CMIP5 high-top models do not show large positive GH anomalies associated with South PC1 events over the region of 45°–70°N, 110°E–180°(colors; Fig.6d) and thus do not show an enhanced SPV(Fig.8f).There are 139 North +PC1, 161 North –PC1, 159 South +PC1, and 138 South –PC1 events from CMIP5 outputs, and their averaged PC1 indices are 1.56, –1.64, 1.56,and –1.45, respectively.Overall, the reanalysis data, CMIP5 model outputs, and numerical experiments all support that North PC1 events (+PC1 minus –PC1) weaken the Arctic SPV while South PC1 events (+PC1 minus –PC1) could not induce an apparent weakening of the SPV.South PC1 events even induce an enhanced SPV in some cases due to the positive GH anomalies over the Asia–North Pacific regions at high latitudes.

Fig.10.(a) Wintertime SST anomaly forcing used in experiment R1, i.e., the differences in SST between R1 and R0.The forcing region is the North Pacific region (20°–65°N, 120°E–110°W).This SST anomaly in the North Pacific is the same as that in Fig.1c, which denotes SST anomalies associated with North PC1 events.The SST forcing is constructed from HadISST.(b) As in (a) but for R2, which is the same as that in Fig.1d and denotes SST anomalies related to South PC1 events.(c–d) Differences in zonal mean geopotential height in winter between experiments (c)R1 and R0, (d) R2 and R0 based on modeling data.The dotted regions in (c–d) are statistically significant at the 90%confidence level according to Student’s t-test.
Previous studies have found that Arctic SPV variations have important effects on the surface weather and climate (e.g., Baldwin and Dunkerton, 2001; Rao et al., 2021; Lu et al.,2022).Thus, we will also briefly discuss the potential impacts of the SPV anomalies due to North and South PC1 events on the surface conditions.Figure 11 shows the tropospheric circulation and temperature anomalies associated with North and South PC1 events.The weakened Arctic SPV associated with North PC1 (Figs.2a, 11a) extends into the troposphere via stratosphere–troposphere dynamical coupling (e.g., Hoskins et al., 1985; Haynes et al., 1991;Ambaum and Hoskins, 2002; Song and Robinson, 2004)and induces a tropospheric negative Arctic Oscillation(–AO)-like circulation anomaly (Fig.11c).The –AO anomaly further leads to an anomalous cooling over Eurasia at mid-to-high latitudes (Fig.11e), consistent with the findings of previous studies (e.g., Broccoli et al., 2001; Cohen and Barlow, 2005; Kolstad et al., 2010; Huang et al., 2017).However, the South PC1-related SPV anomaly is weak and does not extend into the troposphere (Fig.11b), and thus the tropospheric –AO anomaly and Eurasian cooling are not prominent (Figs.11d, f).Although there are positive surface temperature anomalies over Eurasia associated with South PC1 events (Fig.11f), they may be related to the local tropospheric positive GH (anticyclonic circulation) anomalies(Fig.11d) instead of having a stratospheric origin (Fig.11b).Therefore, Fig.11 suggests that the North PC1 events favor a weakened Arctic SPV and thereby a tropospheric –AO anomaly and cooling over Eurasia (Figs.11a, c, e).However, South PC1 events could not induce an apparent weakening of the SPV, and hence, there is no evident cooling over Eurasia (Figs.11b, f).In addition, North PC1-related surface temperature anomalies over North America are overall similar to those associated with South PC1 (Figs.11e–f), which are related to the PNA-like teleconnections over the North Pacific–North America regions (Figs.11c–d).These results imply that the meridional positions of PC1 events may be useful for predicting Arctic SPV and Eurasian surface temperature variations.

Fig.11.(a) Differences in zonal mean geopotential height in winter between North +PC1 and North –PC1 events.The dotted regions are statistically significant at the 90% confidence level according to Student’s t-test.(b) As in (a)but for differences between South +PC1 and South –PC1 events.(c–d) As in (a–b) but for geopotential height (colors)and horizontal wind (vectors) at 850 hPa.(e–f) As in (a–b) but for surface temperature.The data are from NCEP–NCAR reanalysis dataset.
Acknowledgements.This work is supported by the National Natural Science Foundation of China (Grant Nos.42130601,42075060, and 41875046).We thank the scientific teams at NCEP and NCAR for providing the reanalysis data.We acknowledge the ESGF for providing the CMIP5 data.We thank the Met Office Hadley Centre for providing the SST data.We appreciate the computing support provided by the Lanzhou University Supercomputing Center.
 Advances in Atmospheric Sciences2023年12期
- Advances in Atmospheric Sciences的其它文章
- The Arctic Sea Ice Thickness Change in CMIP6’s Historical Simulations※
- A Parameterization Scheme for Wind Wave Modules that Includes the Sea Ice Thickness in the Marginal Ice Zone※
- Influence of Surface Types on the Seasonality and Inter-Model Spread of Arctic Amplification in CMIP6※
- Evaluation of the Arctic Sea-Ice Simulation on SODA3 Datasets※
- Simulations and Projections of Winter Sea Ice in the Barents Sea by CMIP6 Climate Models※
- Arctic Sea Level Variability from Oceanic Reanalysis and Observations※