
LncRNA IDH1-AS1 sponges miR-518c-5p to suppress proliferation of epithelial ovarian cancer cell by targeting RMB47
2024-02-23 05:51JuanZhouYiranXuLuyaoWangYuCongKeHuangXinxingPanGuangquanLiuWenquLiChenchenDaiPengfeiXuXuemeiJia
Juan Zhou, Yiran Xu, Luyao Wang, Yu Cong, Ke Huang, Xinxing Pan, Guangquan Liu,Wenqu Li, Chenchen Dai, Pengfei Xu, Xuemei Jia,✉
1Department of Gynecology, Women's Hospital of Nanjing Medical University, Nanjing Maternity and Child Health Care Hospital, Nanjing, Jiangsu 210004, China;
2Nanjing Maternity and Child Health Medical Institute, Women's Hospital of Nanjing Medical University, Nanjing Maternity and Child Health Care Hospital, Nanjing, Jiangsu 210004, China.
Abstract Long noncoding RNA (lncRNA) IDH1 antisense RNA 1 (IDH1-AS1) is involved in the progression of multiple cancers, but its role in epithelial ovarian cancer (EOC) is unknown.Therefore, we investigated the expression levels of IDH1-AS1 in EOC cells and normal ovarian epithelial cells by quantitative real-time PCR (qPCR).We first evaluated the effects of IDH1-AS1 on the proliferation, migration, and invasion of EOC cells through cell counting kit-8, colony formation, EdU, transwell, wound-healing, and xenograft assays.We then explored the downstream targets of IDH1-AS1 and verified the results by a dual-luciferase reporter, qPCR, rescue experiments,and Western blotting.We found that the expression levels of IDH1-AS1 were lower in EOC cells than in normal ovarian epithelial cells.High IDH1-AS1 expression of EOC patients from the Gene Expression Profiling Interactive Analysis database indicated a favorable prognosis, because IDH1-AS1 inhibited cell proliferation and xenograft tumor growth of EOC.IDH1-AS1 sponged miR-518c-5p whose overexpression promoted EOC cell proliferation.The miR-518c-5p mimic also reversed the proliferation-inhibiting effect induced by IDH1-AS1 overexpression.Furthermore, we found that RNA binding motif protein 47 (RBM47) was the downstream target of miR-518c-5p, that upregulation of RBM47 inhibited EOC cell proliferation, and that RBM47 overexpressing plasmid counteracted the proliferation-promoting effect caused by the IDH1-AS1 knockdown.Taken together,IDH1-AS1 may suppress EOC cell proliferation and tumor growth via the miR-518c-5p/RBM47 axis.
Keywords: lncRNA, IDH1-AS1, epithelial ovarian cancer, miR-518c-5p, RBM47
Introduction
Ovarian cancer is the deadliest cancer of the female reproductive system[1], and epithelial ovarian cancer(EOC) is the most common subtype, accounting for 90% of ovarian cancer cases.EOC has a high incidence with a high mortality rate[2].Although great efforts have been made to treat EOC patients with cytoreductive surgery and chemotherapy as well as targeted therapies, EOC still has high rates of recurrence with a poor prognosis[3].As the pathogenesis of EOC remains unclear, it is urgent to explore the pathogenesis of this disease to identify additional targets for the treatment of EOC.
With the development of human genome sequencing technologies, various nonprotein-coding transcripts have been discovered.Those transcripts with more than 200 nucleotides in length are termed long noncoding RNAs (lncRNAs)[4].It has been widely reported that lncRNAs participate in multiple biological processes, including the regulation of transcriptional and posttranscriptional gene expression.Antisense lncRNAs originating from complementary strands of the protein-coding genes have been reported to participate in the pathogenesis of various diseases, including cancer[5].For example,lncRNAHIF1A-AS1induced gemcitabine resistance in patients with pancreatic cancer by upregulating hypoxia-inducible factor-1 alpha (HIF-1α) expression and enhancing glycolysis[6].LncRNATRAF3IP2-AS1suppressed the progression of NONO-TFE3 translocation in renal cell carcinoma by promoting thePARP1mRNA decay[7].LncRNANR2F1-AS1regulated NR2F1 translation and ΔNp63 transcription to induce lung metastatic dormancy in breast cancer patients[8].
LncRNAIDH1antisense RNA 1 (IDH1-AS1) was first discovered to be correlated with the functions of HIF-1α and c-Myc through IDH1 to regulate the Warburg effect, an essential metabolic mechanism for providing energy to maintain the high proliferation of cancer cells[9].IDH1-AS1has also been reported to promote cell proliferation and suppress apoptosis of prostate cancer cellsviaautophagy induced by ATG5[10].Additionally,IDH1-AS1has been demonstrated to inhibit cell proliferation and tumorigenesis in glioma by altering IDH1 enzymatic activities[11].Because the role ofIDH1-AS1in EOC has not been reported to date, we conducted a strategy combining bioinformatics analysis and experiments to investigate whetherIDH1-AS1participates in EOC development, which may assist in identifying new targets for the treatment of EOC.
Materials and methods
Cell culture
The human EOC cell lines (3AO, A2780, and OVCAR3) were purchased from Shanghai Mingjin Biotech Co., Ltd.(Shanghai, China).SKOV3,CAOV3, and HEK293T cells were obtained from the Cell Bank of the Chinese Academy of Sciences(Shanghai, China).The normal ovarian epithelial cell line IOSE-386 was provided by Prof.Jin Zhu (General Hospital of Eastern Theater Command, Nanjing,Jiangsu, China).CAOV3, A2780, HEK293T, and IOSE-386 cells were maintained in Dulbecco's modified Eagle's medium (DMEM; KeyGEN, Jiangsu,China).Specifically, 3AO and OVCAR3 cells were incubated in RPMI-1640 medium (KeyGEN), and SKOV3 cells were cultured in McCoy's 5A medium(KeyGEN).Each culture medium contained 10% fetal bovine serum (FBS; Thermo Fisher Scientific,Waltham, MA, USA), except for the medium used to culture OVCAR3 cells, which contained 20% FBS.
Transient transfection
Lipofectamine 3000 transfection reagent(Invitrogen, Carlsbad, CA, USA) was utilized to transfect cells with short interfering RNAs (siRNAs),plasmids, microRNA (miRNA) mimics, or miRNA inhibitors according to the manufacturer's instructions.The siRNAs targetingIDH1-AS1, including si-IDH1-AS1(1), si-IDH1-AS1(2), and si-IDH1-AS1(3), as well as negative control siRNA (si-NC), were purchased from RiboBio Co., Ltd.(Cat.Nos.stB0019366A, stB0019366B, stB0019366C, and siN0000001-1-5, Guangzhou, Guangdong, China).TheIDH1-AS1-overexpressing plasmid (pc-IDH1-AS1) and the negative empty vector plasmid (pc-DNA3.1) were constructed by Genecreate Biological Engineering Co., Ltd.(Wuhan, Hubei, China).The miR-518c-5p mimic, miR-518c-5p inhibitor, NC mimic, and NC inhibitor were obtained from RiboBio Co., Ltd.(Cat.Nos.miR10002847, miR20002847,miR1N0000001-1-5, and miR2N000001-1-5).
Stable transfection
We obtained theIDH1-AS1-overexpressing (LVIDH1-AS1) and negative control (LV-NC)recombinant lentiviruses from GenePharma Co., Ltd.(Shanghai, China).SKOV3 cells were seeded into a 24-well plate and incubated overnight, and the cells were transfected, when the cellular confluence reached 30%.The original medium was replaced with 500 μL serum-containing medium with 10% lentivirus fluid, and cells were cultured in the lentiviral solution for 24 h.After the lentivirus-free medium was continuously incubated for 48 h, a concentration of 1 μg/mL puromycin was added to the medium to obtain stably transfected cells.
RNA extraction and quantitative real-time PCR(qPCR)
Tissue and cell RNAs were extracted according to the instruction of Thermo Scientific GeneJET RNA Purification Kit (Thermo Fisher Scientific), and RevertAid First Strand cDNA Synthesis Kit (Thermo Fisher Scientific) was used to obtain cDNA.The PARIS Kit protein and RNA isolation system(Invitrogen, Carlsbad, CA, USA) was utilized to divide cellular RNA into cytoplasmic and nuclear components.The qPCR assays were performed using SYBR Green dye (Thermo Fisher Scientific) and the following thermocycler program: 5 min at 95 ℃; 15 s at 95 ℃ for 40 cycles; and 1 min at 60 ℃.The relative expression levels of different genes were calculated using the 2−ΔΔCTmethod.ACTB,GAPDH, andU6were utilized as internal controls.The primer sequences are listed inTable 1.miRNA-specific stemloopU6primers were constructed from RiboBio Co.,Ltd.(Cat.#MQPS0000002-1-100).
Cell counting kit-8 (CCK-8) assay
After cell transfection for 24 h, approximately 2 000 to 3 000 cells in 100 μL of medium were added to each well of a 96-well plate.After allowing the cells to adhere for 4 to 6 h, 10 μL of CCK-8 solution(KeyGEN) was added to each well of the plate followed by incubation for 2 h.The absorbance was read at 450 nm using a BioTek Synergy H4 (BioTek,Winooski, Vermont, USA), which was considered the 0-h time point.The same process was performed on additional cells at the same time in the next three days,representing the 24-h, 48-h, and 72-h time points.
Colony formation assay
SKOV3 and A2780 cells were seeded and transfected with siRNAs, overexpression plasmid, or miRNA mimics in six-well plates.After the cells were digested and counted, 2 000 to 3 000 cells were recultured in new six-well plates.The cells were allowed to adhere and grow for 7 days to 2 weeks.Cells were then fixed with 1 mL of paraformaldehyde for 30 to 60 min and stained with crystal violet solution for approximately 30 min.The number of colonies was photographed and counted using ImageJ software (National Institutes of Health, Bethesda, MD,USA).
EdU assay
SKOV3 cells (1.5 × 10⁴) or A2780 cells (3 × 10⁴)were seeded in each well of a 96-well plate and cultured for 24 h.Cell-Light EdU DNA Apollo In Vitro Kit (RiboBio) was applied to perform the EdU assay.The cells were labeled with 50 mmol/L EdU solution for 2 h, and stained with Apollo and Hoechst 33342 Dye Solution (RiboBio) in sequence after been fixed with 4% paraformaldehyde.Axio Observer D1 fluorescence microscope (Carl Zeiss, Jena, Germany)was used to take photographs of the stained cells.
Transwell assay
Medium (600 μL) containing 20% FBS was added to the lower chamber of the Transwell (Corning Inc.,Corning, NY, USA), and 200 μL of serum-free medium was added to the upper chamber.SKOV3 cells (3 × 10⁴) or A2780 cells (5 × 10⁴) were seeded into Transwell chambers without or with Matrigel(BD Biosciences, San Jose, CA, USA) (60 μL/well;medium/Matrigel ratio, 7∶1) to conduct migration or invasion assays, respectively.Following 24 to 72 h of cultivation, the chamber was fixed with 4%paraformaldehyde (BioSharp, Hefei, Anhui, China)and then stained with 0.1% crystal violet solution(BioSharp).Cells were wiped away from the upper surface of the chamber using a cotton swab, and images of the lower surface of the chamber were acquired for randomly selected areas using an Axio Observer D1 fluorescence microscope (Carl Zeiss).
Wound-healing assay
SKOV3 and A2780 cells were cultured in six-well plates with medium containing 10% FBS.When thecellular confluence reached more than 95%, horizontal lines were made on the backside of the plate, and longitudinal lines were scratched in the cell bed using 200 μL pipette tips.The FBS-containing medium was then replaced with a serum-free medium.Images were acquired at 0, 24, and 48 h after the wound was generated using an EVOS XL Core digital microscope(Thermo Fisher Scientific) and analyzed by ImageJ software.
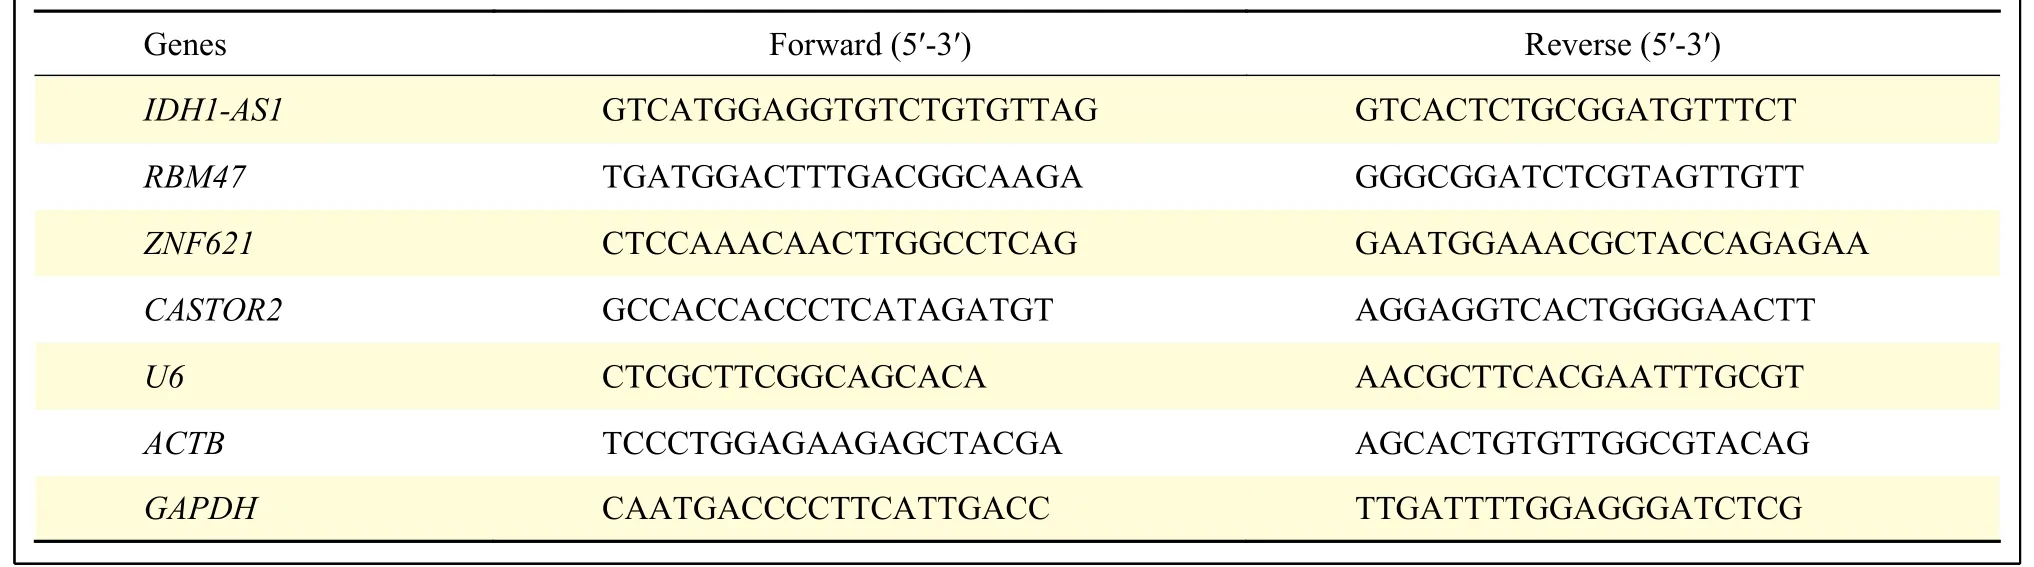
Table 1 Primer sequences for quantitative real-time PCR
Xenografts in nude mice
Ten female BALB/c nude mice aged 6 weeks were purchased from the Model Animal Research Center of Nanjing University (Nanjing, Jiangsu, China).The nude mice were kept in a specific pathogen-free environment and randomly and equally divided into the LV-IDH1-AS1group and the LV-NC group (n= 5 for each group).SKOV3 cells (9 × 10⁶) transfected with LV-IDH1-AS1or LV-NC in 200 μL of PBS solution were subcutaneously injected into the left axilla of the LV-IDH1-AS1group or the LV-NC group nude mice, respectively.The tumor size was measured every 2 to 3 days using manual calipers, and the tumor volume was calculated according to the following formula: Tumor volume = 0.5 × length ×width2.The tumors were resected 25 days after injection of cells.All animal protocols were approved by the Animal Ethical and Welfare Committee of Nanjing Medical University (Approval No.IACUC-1911022).
Dual-luciferase reporter assay
Bioinformatics tools were utilized to predict the binding site betweenIDH1-AS1and miR-518c-5p.The wild type (WT) and mutant type (MT) plasmids ofIDH1-AS1were inserted into the pmirGLO plasmid.A total of 250 ng of pmirGLO-IDH1-AS1-WT or pmirGLO-IDH1-AS1-MT and 250 ng of miR-518c-5p mimics or NC mimics were cotransfected into HEK293T cells with 2.5 μL of Lipofectamine 3000 and 0.5 μL of P3000 (Invitrogen) for 48 h.Luciferase activities of Firefly and Renilla were measured using the Dual-Luciferase Reporter Gene Assay Kit (Promega, Madison, WI, USA) and detected by the GloMax 96-well fluorescence detector(Promega) according to the manufacturer's instructions.The ratio of firefly to Renilla luciferase activity was calculated as the relative luciferase activity.To verify the targeting relevance between miR-518c-5p and the 3′ UTR ofRBM47, the same procedure was used but with different plasmids,respectively.
Western blotting analysis
Total protein was isolated by lysing cells with RIPA lysis buffer (Servicebio, Wuhan, Hubei, China),and the protein concentration was measured using a BCA Protein Assay Kit (Beyotime, Shanghai, China).Protein samples were separated by SDS-PAGE and transferred onto PVDF membranes (Millipore,Boston, MA, USA).After blocking the membranes with 5% skim milk, the membranes were incubated with the following primary antibodies at 4 ℃overnight: anti-β-actin antibody (1∶2 000 dilution;Cat.No.GB15003, Servicebio) and anti-RBM47 antibody (1∶5 000 dilution; Cat.No.ab167164,Abcam, Cambridge, UK).The membranes were then incubated with the secondary antibody for 2 h at 37 ℃.Protein bands were visualized by using the FluuroChem M imaging system (Protein Simple Inc.,San Jose, CA, USA) according to the manufacturer's instructions.
Immunohistochemistry
Tissue specimens were paraffin-embedded and sliced into sections that were dewaxed with xylene and dehydrated with gradient alcohol.The slices were heated in citrate buffer, followed by blocking with 3%H2O2, and sealed with goat serum.The sections were incubated with primary antibody overnight at 4 ℃,including anti-RBM47 antibody (1∶100 dilution;Cat.No.ab167164, Abcam), anti-Ki67 antibody(1∶300 dilution; Cat.No.NB500-170, Novus Biologicals, Littleton, CO, USA), and then incubated with HRP-labeled secondary antibody (1∶500 dilution; Cat.No.abs20040ss, Absin Bioscience,Shanghai, China).The slices were treated with 3,39-diaminobenzidine tetrahydrochloride reagent to develop color, and re-stained with hematoxylin.Each section was photographed under the microscope (Carl Zeiss) at 400× magnification.Integrated optical density summation of RRBM47 and Ki67 protein expression was calculated by Image-Pro Plus software(Media Cybernetics, Silver Spring, MD, USA).
Bioinformatics analysis
The association betweenIDH1-AS1and the prognosis of EOC patients was analyzed using the GEPIA database (http://gepia.cancer-pku.cn).The clinical data of EOC patients were obtained from The Cancer Genome Atlas (TCGA) database (http://cancergenome.nih.gov), and theIDH1-AS1expression data of EOC patients were acquired from the Atlas of non-coding RNA in Cancer (TANRIC) database(http://ibl.mdanderson.org/tanric/_design/basic/index.html).The downstream miRNA targets ofIDH1-AS1were searched from the RNA22 (https://cm.jefferson.edu/rna22/), miRDB (http://www.mirdb.org/), and LncRNASNP2 (http://bioinfo.life.hust.edu.cn/lncRNA SNP/) databases.The downstream gene targets of miR-518c-5p were screened from the miRWalk(http://mirwalk.umm.uni-heidelberg.de/) database.RNAHybrid (v2.2) software (https://bibiserv.cebitec.uni-bielefeld.de/rnahybrid/) was used to predict binding sites betweenIDH1-AS1and miR-518c-5p as well as between miR-518c-5p and the 3′ UTR ofRBM47.
Statistical analysis
The data of cellular experiments were presented as the mean ± standard deviation of three independent experiments, and the data of animal tests were presented as mean ± standard error of the mean.The Chi-square (χ2) test was applied to compare the rates (%) of the two groups.The Cox proportional hazards regression model was used to analyze the association between clinical data and survival of EOC patients.Two-tailed Student'st-test and two-way analysis of variance (ANOVA) followed by Dunnett's tests were applied to compare the data between two or more groups by using GraphPad Prism 7 (GraphPad Software, La Jolla, CA, USA).P< 0.05 was considered statistically significant.
Results
IDH1-AS1 was decreased in EOC cells and associated with the prognosis of EOC
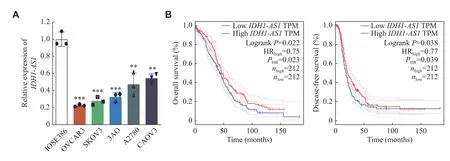
Fig. 1 IDH1-AS1 was downregulated in EOC cells and was associated with the prognosis of EOC.A: Relative expression of IDH1-AS1 in one normal ovarian epithelial cell line and five EOC cell lines was measured by qPCR assay.ACTB was used as an internal reference gene.B: Correlation between the level of IDH1-AS1 and the prognosis of EOC patients according to the GEPIA database.The low expression group and high expression group were defined according to the median of IDH1-AS1 level.Data were obtained from three independent experiments.Values are presented as mean ± standard deviation.Two-tailed Student's t-test was performed to indicate significance.**P < 0.01 and ***P < 0.001.Abbreviations: EOC, epithelial ovarian cancer; qPCR, quantitative real-time PCR; GEPIA, Gene Expression Profiling Interactive Analysis.
To identify the potential effects ofIDH1-AS1on EOC, we first investigated the expression levels ofIDH1-AS1in EOC cell lines.The abundance ofIDH1-AS1was lower in EOC cells (OVCAR3, SKOV3,3AO, A2780, and CAOV3) than in normal ovarian epithelial cells (IOSE386) (Fig.1A).Because SKOV3 and A2780 cells were the commonly used EOC cells,we selected them for further investigation.We next detectedIDH1-AS1expression in EOC cells from the patients included in the GEPIA, TCGA, and TANRIC databases.HighIDH1-AS1expression was associated with an increased overall survival (OS) and diseasefree survival in EOC patients according to the GEPIA database (Fig.1B).Furthermore, we downloaded clinical information of EOC patients from TCGA and the expression data ofIDH1-AS1from the TANRIC database.Patients with incomplete primary clinical data or lackingIDH1-AS1expression data were excluded.A total of 410 EOC patients were included in this analysis.TheIDH1-AS1expression levels were not associated with the Federation International of Gynecology and Obstetrics (FIGO) stage, grade,lymph node invasion or neoplasm status of EOC, but with age and race (Table 2).According to univariate and multivariate Cox regression analyses,IDH1-AS1expression level may be an independent predictor for OS of EOC patients (Tables 3and4).Taken together,these results indicated that the expression levels ofIDH1-AS1were decreased in EOC cells and that lowIDH1-AS1expression was associated with a poor prognosis in EOC patients.
IDH1-AS1 inhibited the proliferation of EOC cells in vitro
Given the effect ofIDH1-AS1on the prognosis of EOC, we further investigated the influence ofIDH1-AS1on cellular proliferation, migration, and invasion by knocking down or overexpressingIDH1-AS1in EOC cells with siRNAs or overexpressing plasmid,respectively (Fig.2Aand2B).The CCK-8 assay results demonstrated that the downregulation ofIDH1-AS1promoted EOC cell viability, while the overexpression ofIDH1-AS1significantly suppressed EOC cell viability (Fig.2Cand2D).Moreover, both the colony formation and the EdU assays were utilized to evaluate cell proliferation, and the trends were similar to those in the CCK-8 assays (Fig.2Eand2F).Transwell assays and wound-healing assays indicated thatIDH1-AS1had no significant effect on the invasion and migration of EOC cells(Supplementary Fig.1Aand1B, available online).Together, these results indicated thatIDH1-AS1inhibited EOC cell proliferationin vitro.
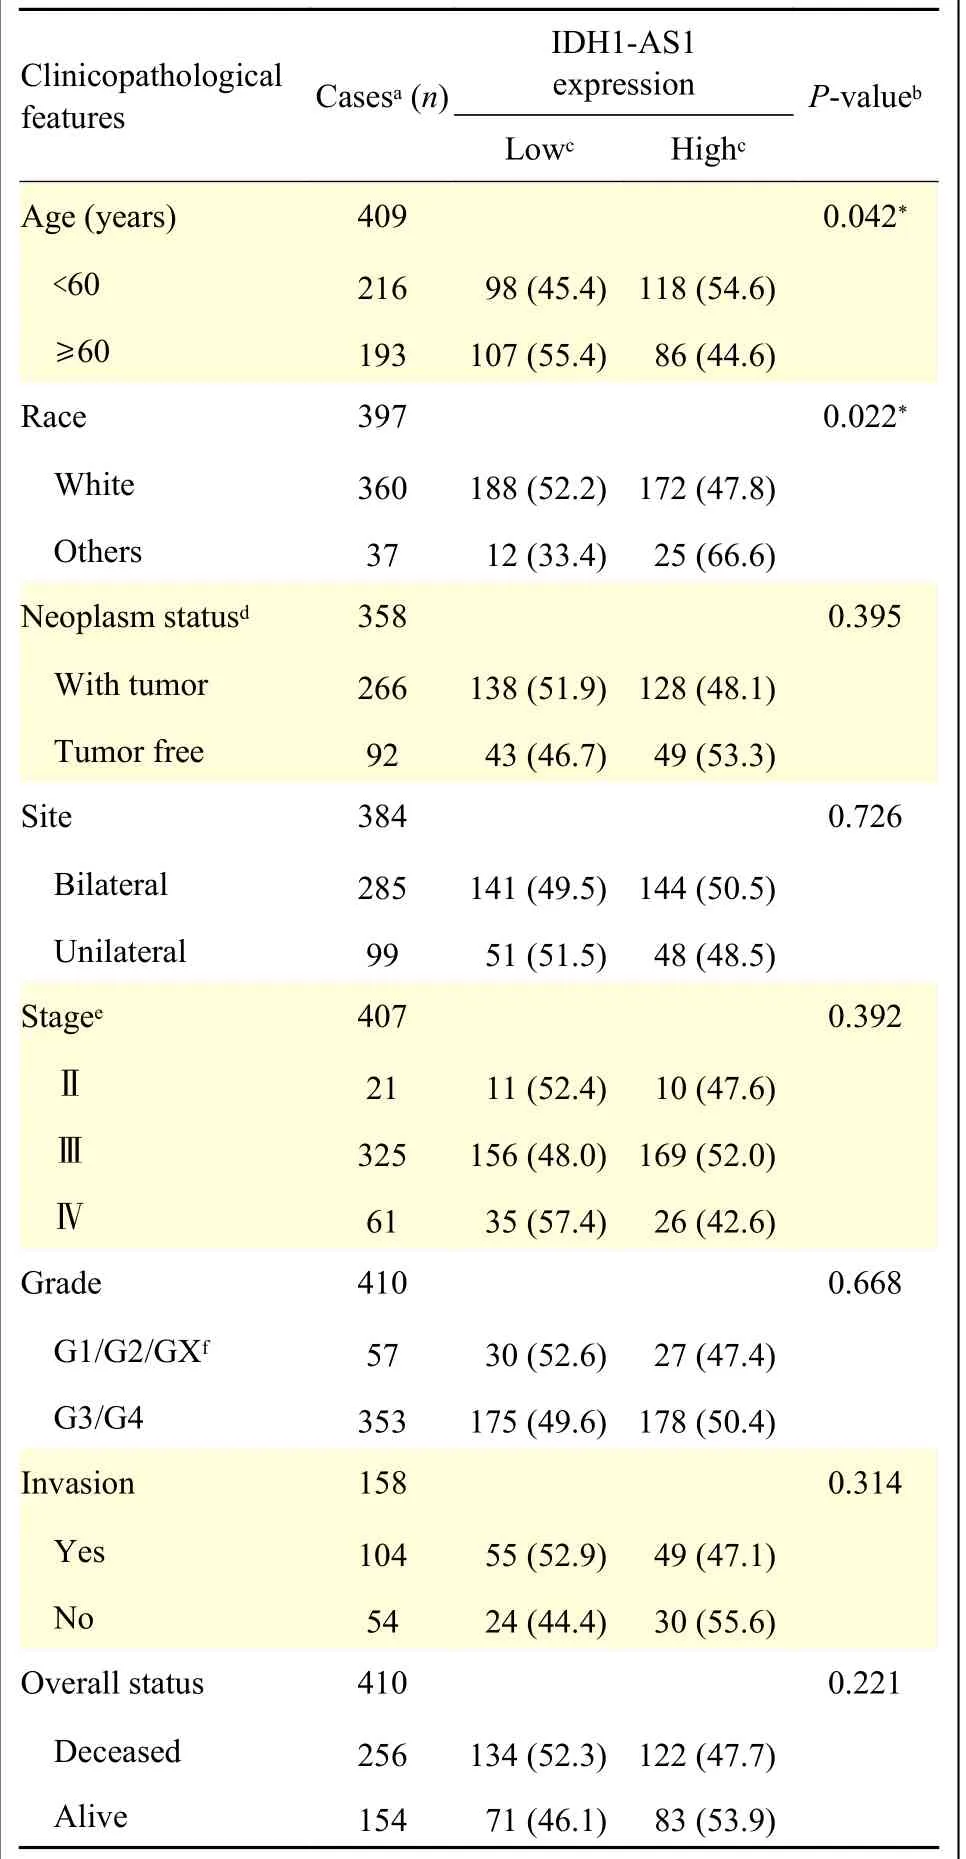
Table 2 Correlation between IDH1-AS1 expression and clinicopathological features in patients with epithelial ovarian cancer
IDH1-AS1 acted by sponging miR-518c-5p in EOC cells
To investigate the mechanism ofIDH1-AS1in EOC cells, the nuclear and cytoplasmic RNA isolation assay was applied to define its cellular location.IDH1-AS1was confirmed to be distributed mainly in the cytoplasm of EOC cells (Fig.3A).The databases of RNA22, miRDB, and LncRNASNP2 were then utilized to screen downstream miRNA targets, which identified miR-518c-5p, miR-1301-5p, and miR-3907(Fig.3B).The number of consecutive binding sites betweenIDH1-AS1and miR-518c-5p was predicted to be the largest among these miRNAs by RNAhybrid software (Fig.3C), which indicated their greatest binding possibility.Dual-luciferase reporter analysis and qPCR assays were performed to verify the correlation betweenIDH1-AS1and miR-518c-5p.The results showed that miR-518c-5p upregulation suppressed the luciferase activity ofIDH1-AS1-WT but did not affect the luciferase activity ofIDH1-AS1-MT (Fig.3D).The expression level of miR-518c-5p was increased afterIDH1-AS1knockdown but decreased afterIDH1-AS1overexpression in EOC cells (Fig.3E).Subsequently, transfection of miR-518c-5p mimic into SKOV3 and A2780 cells(Fig.3F) promoted cell viability and colony formation in EOC cells (Fig.3Gand3H).Rescue experiments of the EdU assay further indicated that the miR-518c-5p mimic reversed the proliferation inhibiting effect induced by overexpression ofIDH1-AS1in EOC cells (Fig.3I).Thus, these findings suggest thatIDH1-AS1may serve as a suppressor by sponging miR-518c-5p in EOC cells.
IDH1-AS1 affected EOC cells by targeting the miR-518c-5p/RBM47 axis
To identify the putative targets of miR-518c-5p, we used the miRWalk website, including the miRDB and miTarBase databases, and identified eight shared genes (Fig.4A).Because previous studies have reported that RNA binding motif protein 47 (RBM47),zinc finger protein 621 (ZNF621), and cytosolic arginine sensor for mTORC1 subunit 2 (CASTOR2)function as tumor suppressors, we selected these genes for further verification.The qPCR analysis showedthat only the mRNA level ofRBM47was significantly decreased afterIDH1-AS1knockdown in EOC cells(Fig.4B).The mRNA expression ofRBM47was also inhibited after miR-518c-5p overexpression (Fig.4C).Next, we predicted the binding sites between 3′ UTR ofRBM47and miR-518c-5p by the RNAhybrid software (Fig.4D).A dual-luciferase reporter assay revealed that the luciferase activity ofRBM47-WT was significantly decreased when cotransfected with the miR-518c-5p mimic, but this change did not occur in the luciferase activity ofRBM47-MT (Fig.4E).Furthermore, Western blotting analysis indicated the protein level of RBM47 was decreased afterIDH1-AS1suppression or miR-518c-5p overexpression, but increased after miR-518c-5p suppression in EOC cells(Fig.4F).Furthermore,RBM47overexpression (Fig.4G) inhibited cell viability and colony formation in EOC cells (Fig.4Hand4I).Rescue experiments of the EdU assay revealed that theRBM47overexpressing plasmid counteracted the proliferationpromoting effect caused by theIDH1-AS1knockdown in EOC cells (Fig.4J).Taken together, these results demonstrate thatIDH1-AS1may inhibit the proliferation of EOC cellsviathe miR-518c-5p/RBM47 axis.
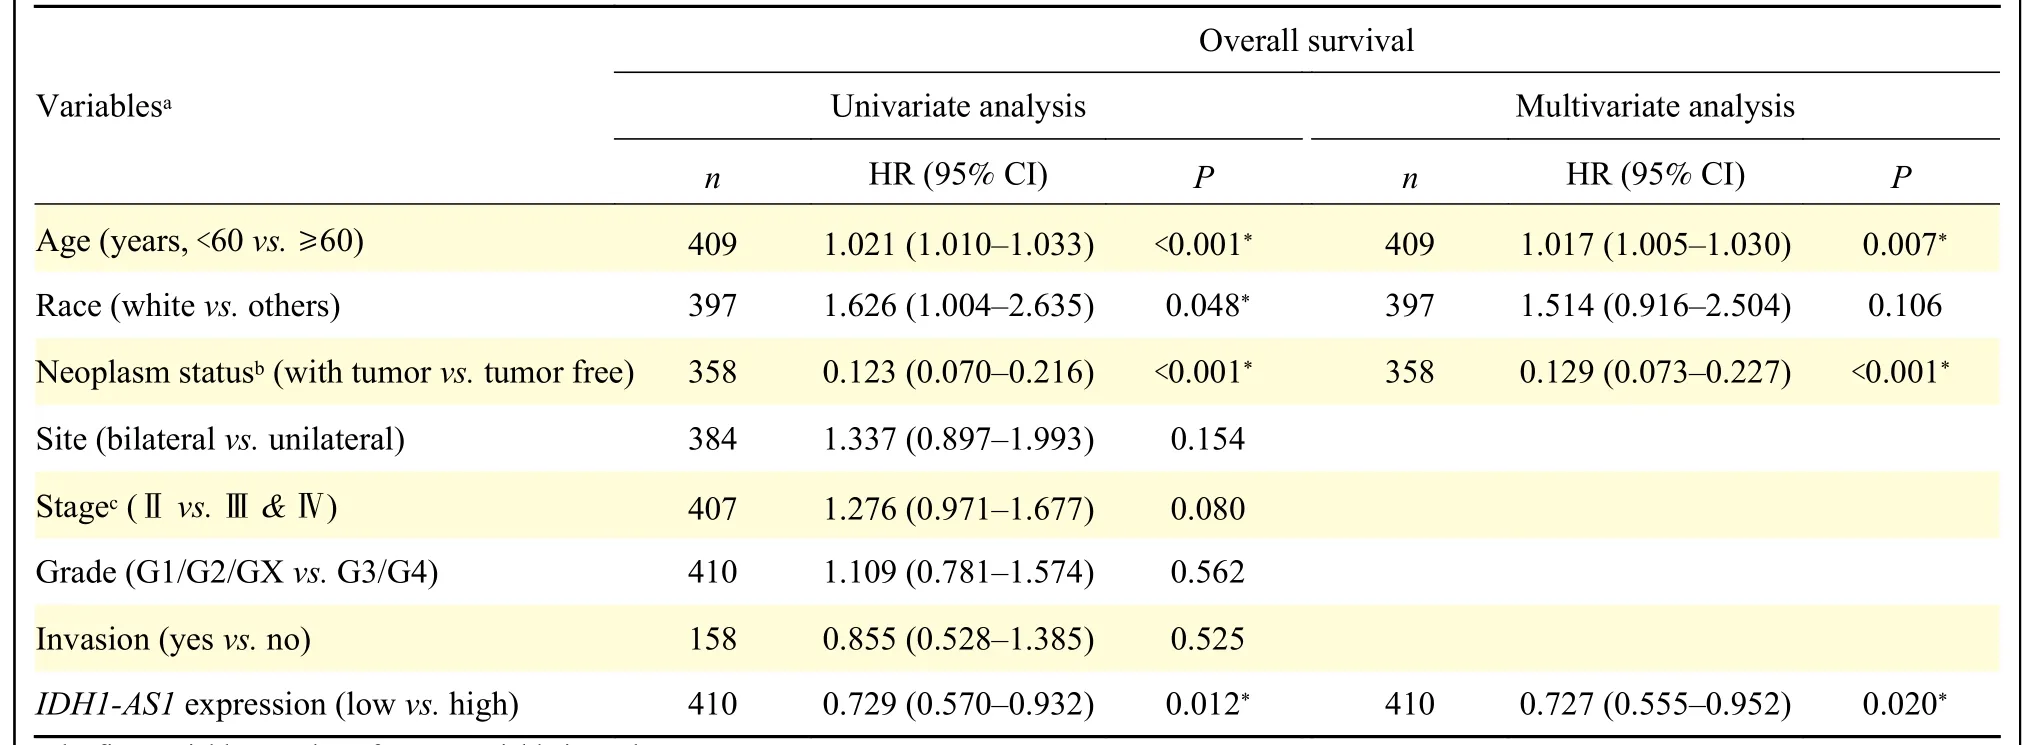
Table 3 Univariate and multivariate Cox regression analyses of overall survival in patients with epithelial ovarian cancer
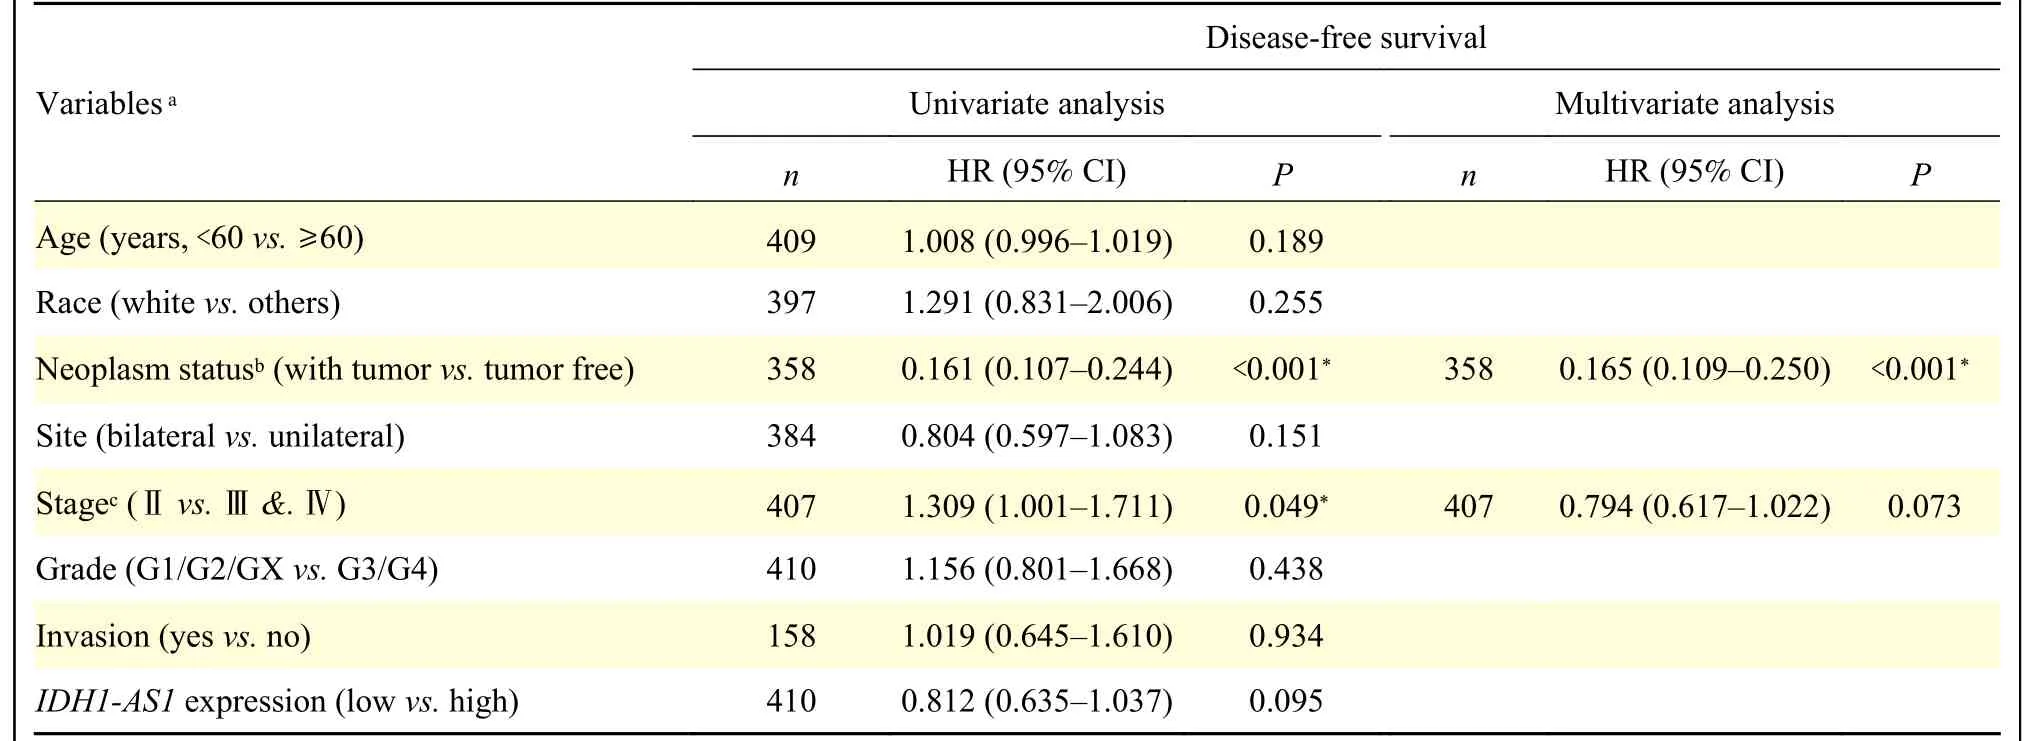
Table 4 Univariate and multivariate Cox regression analyses of disease-free survival in patients with epithelial ovarian cancer
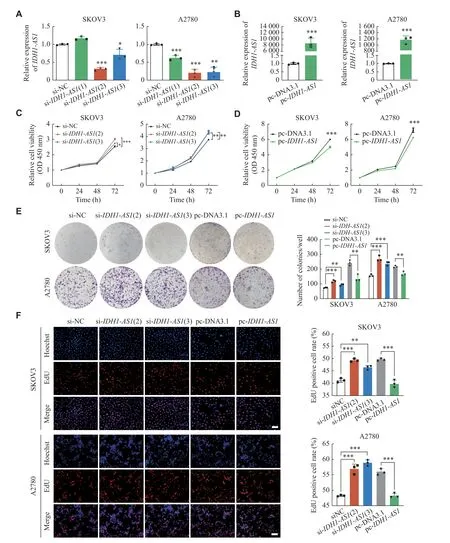
Fig. 2 IDH1-AS1 inhibited the proliferation of EOC cells in vitro.A and B: Transfection efficiency of IDH1-AS1 siRNAs and overexpressing plasmid in SKOV3 and A2780 cells according to qPCR analysis. ACTB was used as an internal reference gene.C and D: SKOV3 and A2780 cell viability after transfection of IDH1-AS1 siRNAs and overexpressing plasmid according to CCK-8 assay.E and F: SKOV3 and A2780 cell proliferation after transfection of IDH1-AS1 siRNAs and overexpressing plasmid evaluated by colony formation assay and EdU assay.The proliferating cells were labeled with EdU (red), while cell nuclei were stained with Hoechst (blue).Scale bar:100 μm.Data are presented as mean ± standard deviation from three independent experiments.Two-tailed Student's t-test was performed to indicate significance, except that statistical analysis for C was performed by two-way ANOVA followed by Dunnett's tests, and D was performed by two-way ANOVA.*P < 0.05, **P < 0.01, and ***P < 0.001.Abbreviations: EOC, epithelial ovarian cancer; siRNA, short interfering RNA; CCK-8, cell counting kit-8; EdU, 5-ethynyl-2′-deoxyuridine; ANOVA, analysis of variance.
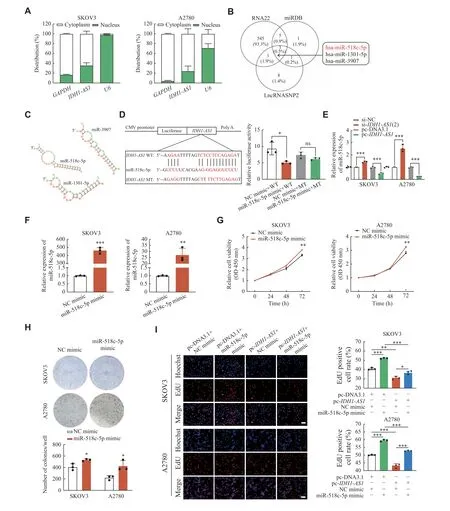
Fig. 3 IDH1-AS1 acted by sponging miR-518c-5p in EOC cells.A: Nuclear and cytoplasmic RNA isolation of IDH1-AS1 in SKOV3 and A2780 cells.B: The downstream three miRNAs of IDH1-AS1 were predicted from the RNA22, miRDB, and LncRNASNP2 databases.C:The binding sites between IDH1-AS1 and the three miRNAs were predicted by RNAhybrid (v2.2).D: The interaction between IDH1-AS1 and miR-518c-5p was verified by dual-luciferase reporter assay.E: The expression correlation between IDH1-AS1 and miR-518c-5p was confirmed by qPCR analysis.F: The transfection efficiency of the miR-518c-5p mimic in SKOV3 and A2780 cells was evaluated by qPCR analysis.Stem-loop U6 was used as an internal reference gene (E and F).G and H: Cell viability and proliferation of SKOV3 and A2780 cells after transfection of miR-518c-5p mimics according to CCK-8 assay and colony formation assay.I: Rescue experiment of EdU assay after cotransfection of the NC mimic or miR-518c-5p mimic and empty vector plasmid or IDH1-AS1 overexpressing plasmid in EOC cells.The bar represents 100 μm.Data were obtained from three independent experiments.Values are presented as mean ± standard deviation.Two-tailed Student's t-test was performed to indicate significance, except that statistical analysis for G, which was performed by two-way ANOVA.*P < 0.05, **P < 0.01, and ***P < 0.001.Abbreviations: ns, not significant; EOC, epithelial ovarian cancer; miRNA, microRNA;qPCR, quantitative real-time PCR; CCK-8, cell counting kit-8; EdU, 5-ethynyl-2′-deoxyuridine; ANOVA, analysis of variance.
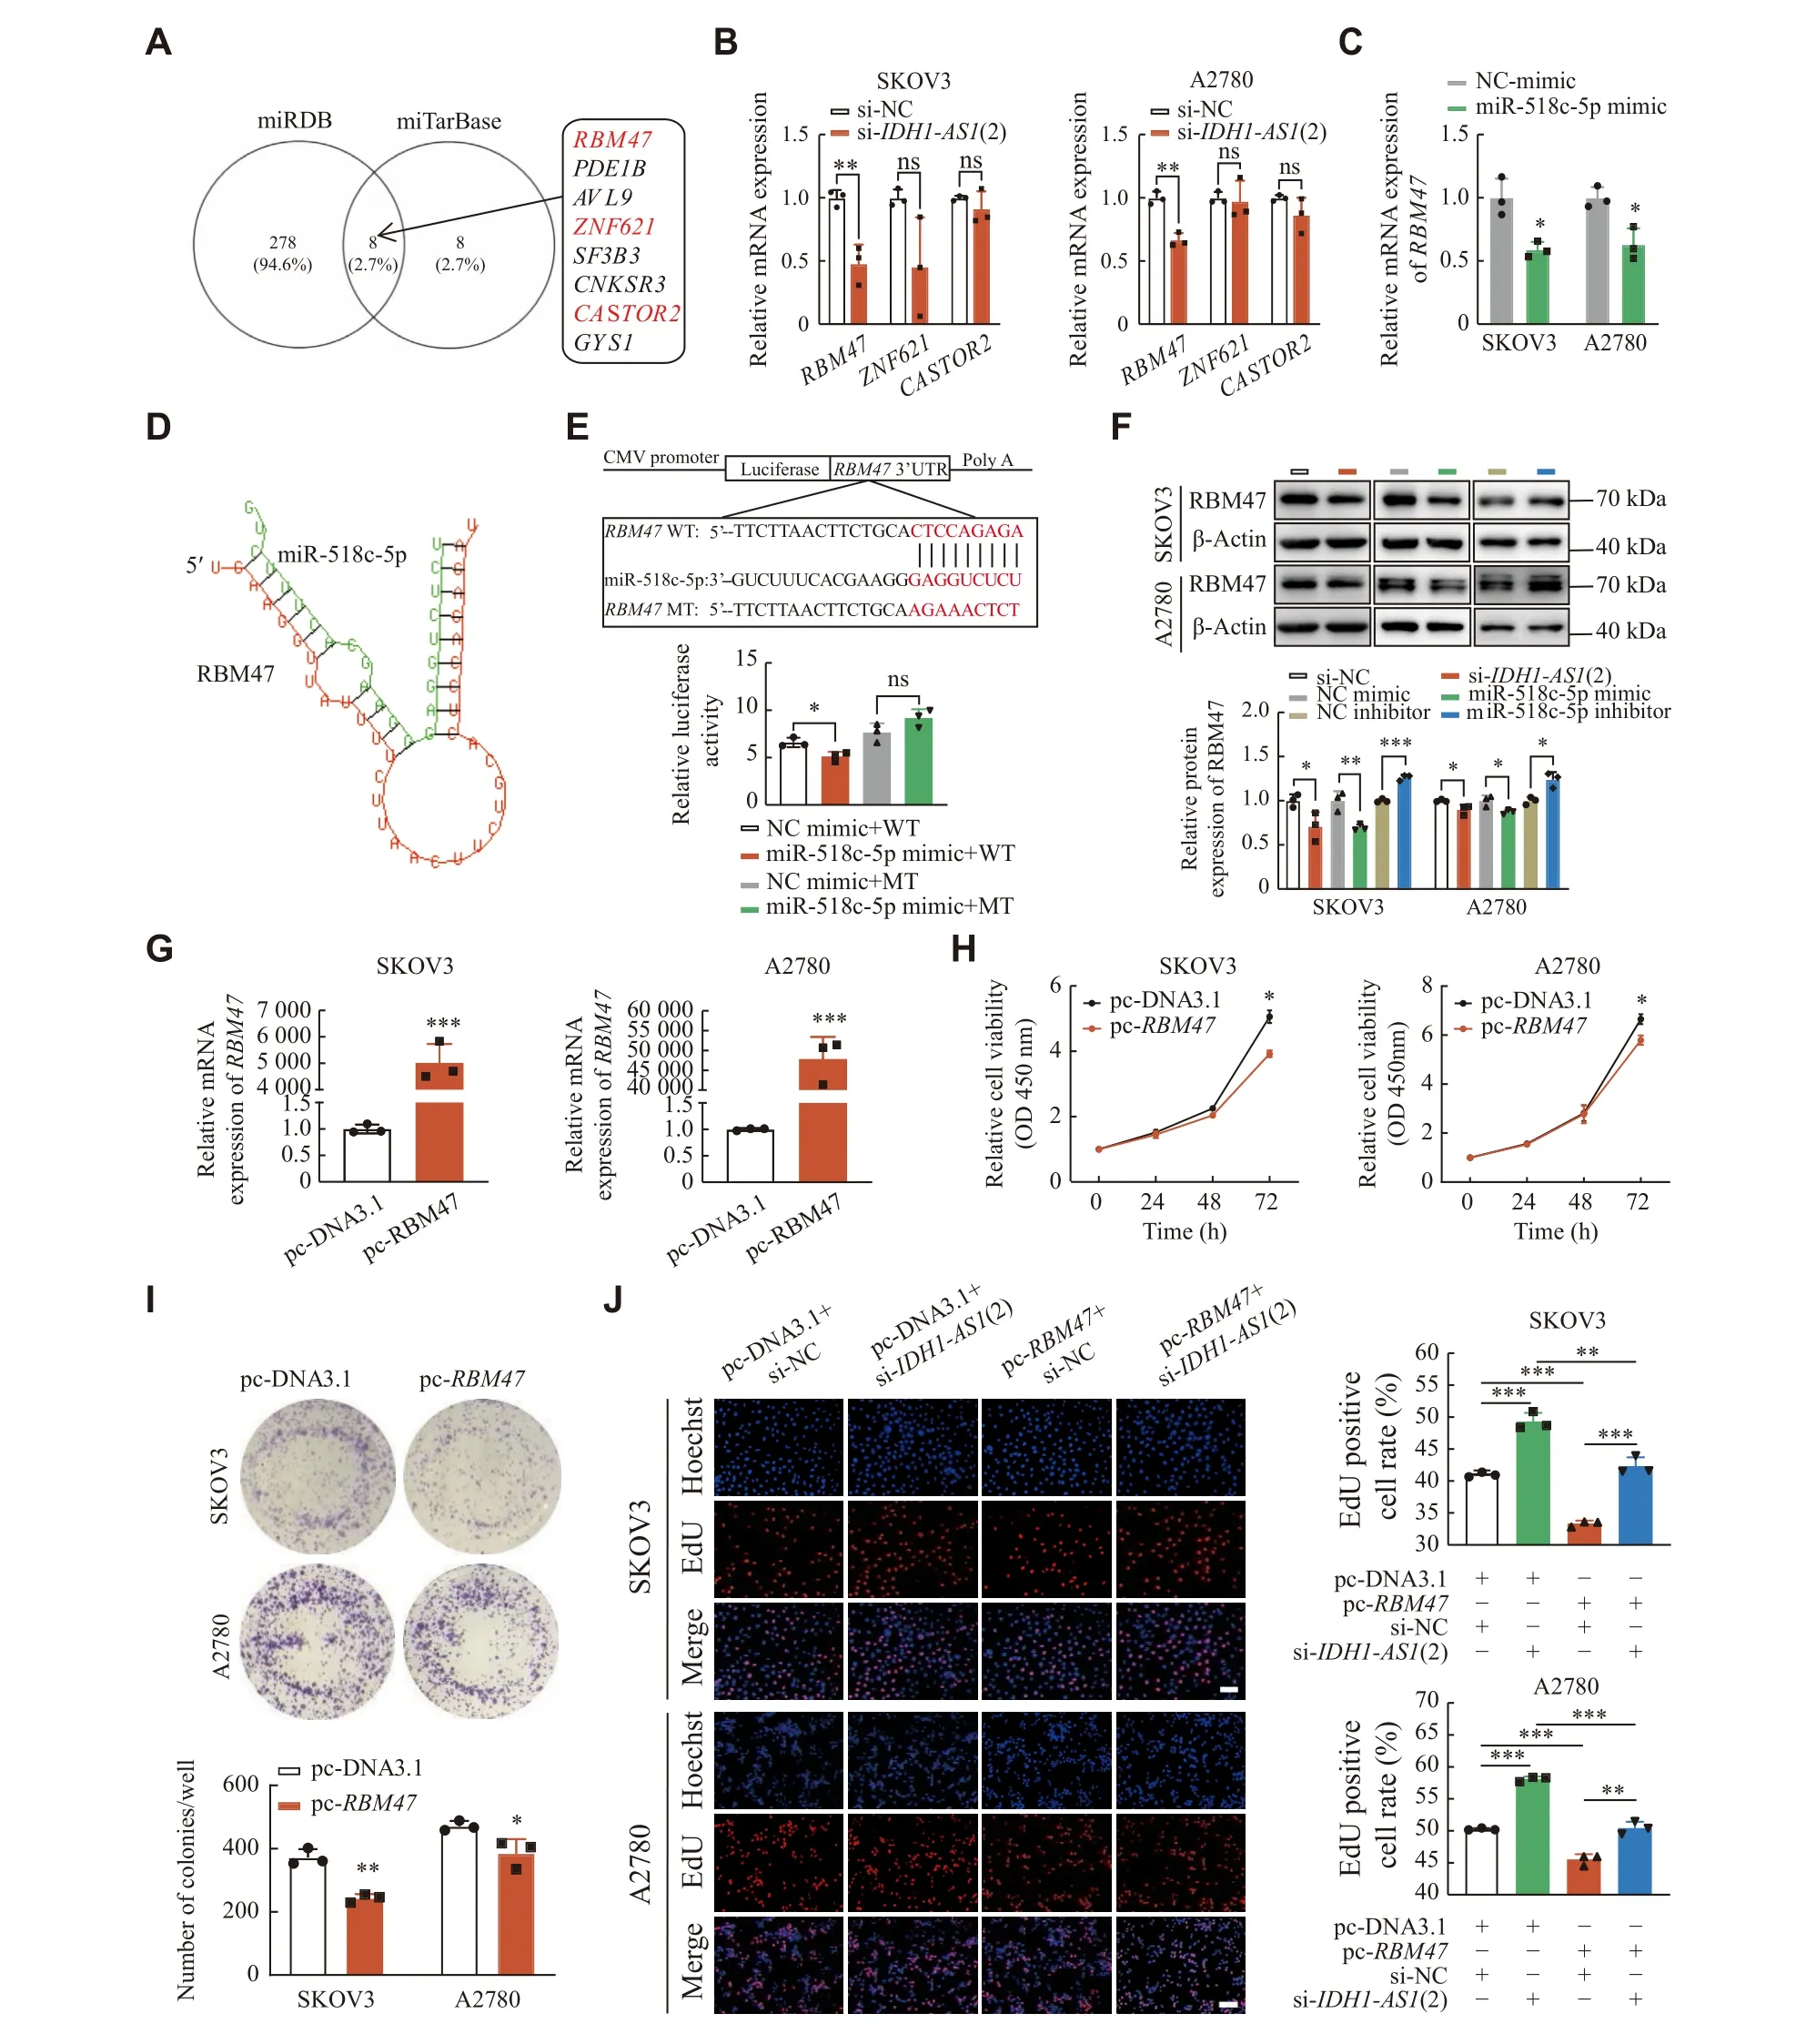
Fig. 4 IDH1-AS1 affected EOC cells by targeting the miR-518c-5p/RBM47 axis.A: Selection of miR-518c-5p target genes from the miRWalk website by miRDB and miTarBase databases.Tumor suppressor genes were marked in red.B: Relative mRNA expressions of the selected three tumor suppressor genes were assessed by qPCR analysis after IDH1-AS1 siRNA transfection in SKOV3 and A2780 cells.C:Relative mRNA expression of RBM47 was evaluated by qPCR analysis after miR-518c-5p mimic transfection in SKOV3 and A2780 cells.D: The binding sites between RBM47 and miR-518c-5p were predicted by RNAhybrid (v2.2).E: The binding between RBM47 and miR-518c-5p was verified by dual-luciferase reporter assay.F: Western blotting analysis of the relative protein expression of RBM47 after transfection of IDH1-AS1 siRNA, miR-518c-5p mimic or miR-518c-5p inhibitor in SKOV3 and A2780 cells.G: qPCR analysis of the transfection efficiency of the RBM47 overexpressing plasmid in SKOV3 and A2780 cells.ACTB was used as an internal reference gene (B,C, and G).H and I: SKOV3 and A2780 cell viability and proliferation after transfection of RBM47 overexpressing plasmid according to CCK-8 assay and colony formation assay.J: Rescue experiment of EdU assay after cotransfection of empty vector plasmid or RBM47 overexpressing plasmid and NC siRNA or IDH1-AS1 siRNA in EOC cells.Scale bar: 100 μm.Data are presented as mean ± standard deviation from three independent experiments.Two-tailed Student's t-test was performed to indicate significance, except that statistical analysis for H, which was performed by two-way ANOVA.*P < 0.05, **P < 0.01, and ***P < 0.001.Abbreviations: ns, not significant; EOC,epithelial ovarian cancer; siRNA, short interfering RNA; CCK-8, cell counting kit-8; EdU, 5-ethynyl-2′-deoxyuridine; ANOVA, analysis of variance.
IDH1-AS1 suppressed tumor growth of EOC cells in vivo
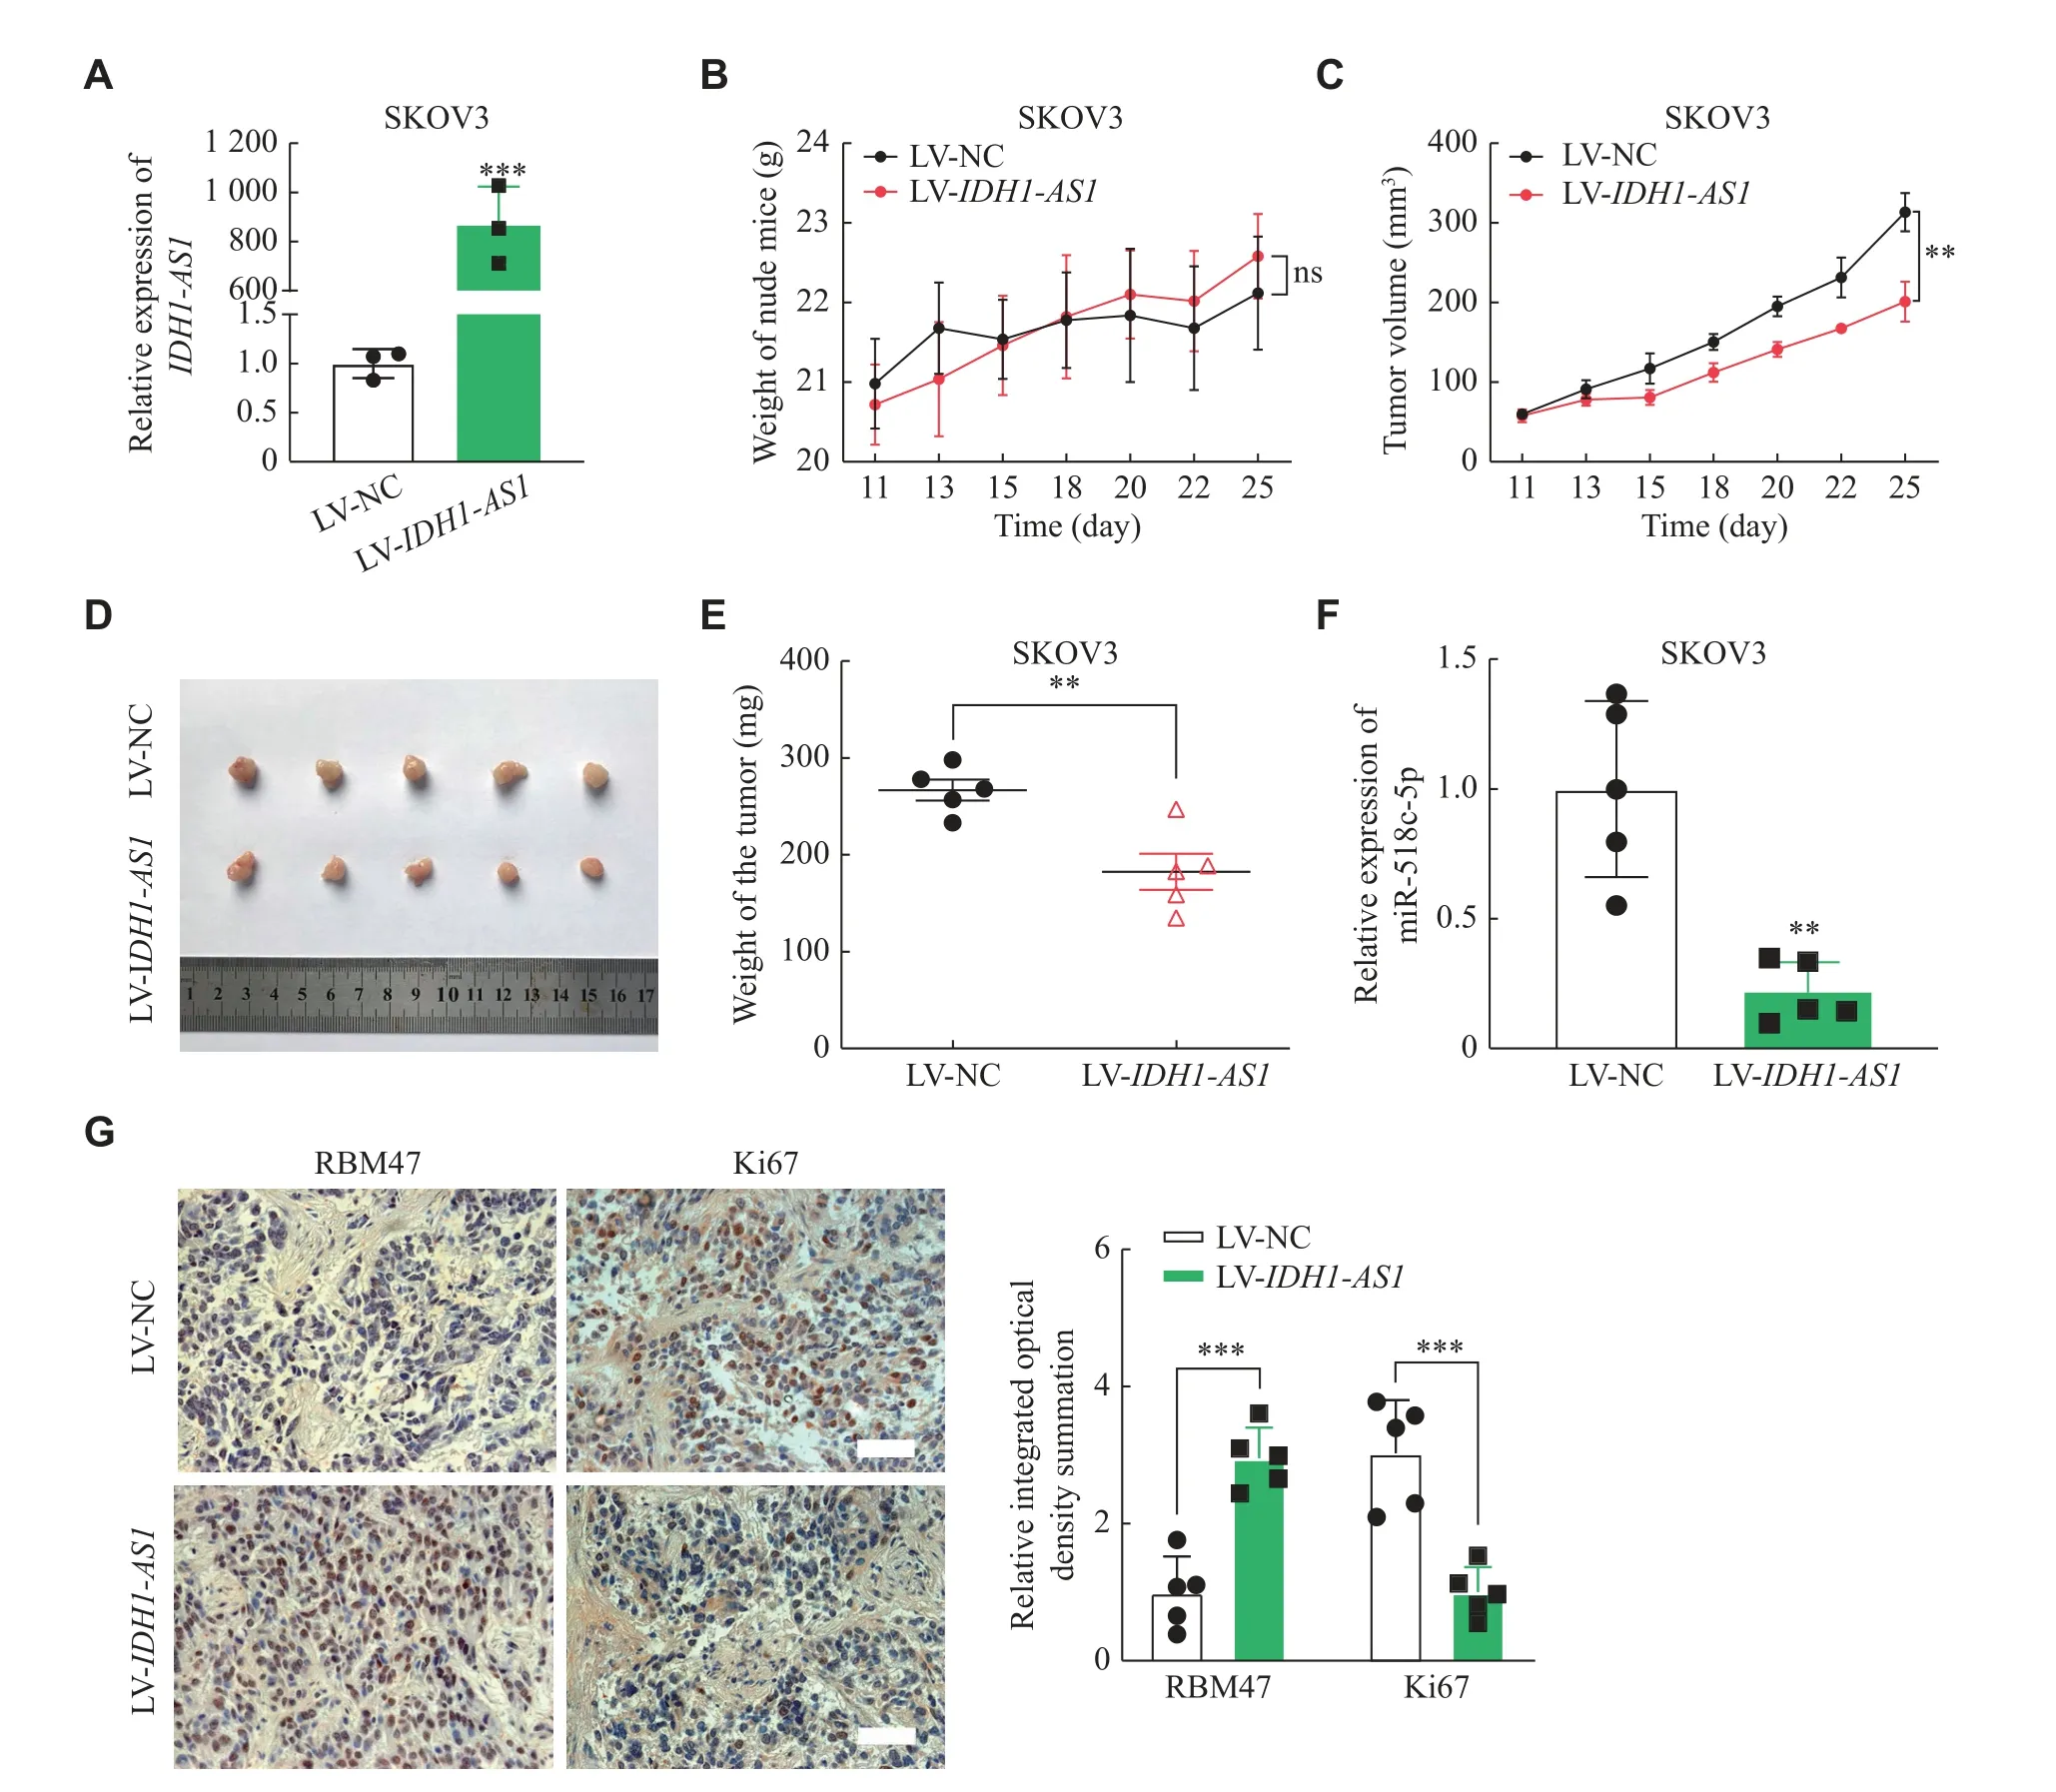
Fig. 5 IDH1-AS1 suppressed tumor growth of EOC in vivo.A: The expression of IDH1-AS1 after LV-IDH1-AS1 transfection in SKOV3 cells was evaluated by qPCR analysis (n = 3).ACTB was used as an internal reference gene.B: The weight growth curve of nude mice after SKOV3 cell injection in the LV-NC group and LV-IDH1-AS1 group (n = 5 for each group).C: The tumor growth curve of nude mice was based on tumor volume in the nude mice of the two groups (n = 5).D: Photographs of subcutaneous tumors resected from each group of nude mice (n = 5).E: The subcutaneous tumor weight of nude mice was compared between the two groups (n = 5).F: qPCR analysis of the expression of miR-518c-5p in subcutaneous tumor tissues of the two groups (n = 5).Stem-loop U6 was used as an internal reference G:RBM47 and Ki67 protein expression was assessed in the form of integrated optical density summation in tumor tissues of the two groups by immunohistochemistry assay (n = 5).Scale bar: 50 μm.Data are presented as mean ± standard error of the mean, except for values in A presented as the mean ± standard deviation.Two-tailed Student's t-test was performed to indicate significance, except that statistical analyses for B and C were performed by two-way ANOVA.*P < 0.05, **P < 0.01, and ***P < 0.001.Abbreviations: EOC, epithelial ovarian cancer; LVIDH1-AS1, IDH1-AS1-overexpressing lentivirus; qPCR, quantitative real-time PCR; LV-NC, negative control lentivirus; ANOVA, analysis of variance.
Considering the suppressive effects ofIDH1-AS1on EOCin vitro, we further investigated its functionin vivo.The qPCR confirmed that the expression ofIDH1-AS1was significantly higher in SKOV3 cells transfected with LV-IDH1-AS1, compared with the control cells (Fig.5A).There was no significant difference in the weight of nude mice after SKOV3 cell injection in the LV-NC group and LV-IDH1-AS1group (Fig.5B).The tumor growth curve showed that the tumor volume of nude mice was significantly lower in the LV-IDH1-AS1group than in the control group (Fig.5C).Subcutaneous tumors were dissected from nude mice after cells injection for 25 days (Fig.5D), and the tumor weight was significantly lower in the LV-IDH1-AS1group than in the control group(Fig.5E).The qPCR also showed that the expression of miR-518c-5p was obviously lower in subcutaneous tumors of the LV-IDH1-AS1group (Fig.5F).Then,immunohistochemistry was performed to detect RBM47 and Ki67 protein expression in tumor tissues,identifying that RBM47 protein was highly expressed,while Ki67 protein was lowly expressed inIDH1-AS1-overexpressing tumor tissues (Fig.5G).These results suggested thatIDH1-AS1suppressed xenograft tumor growth of EOC cellsin vivo.
Discussion
Accumulating evidence indicates that lncRNAs participate in the progression of EOC[12].IDH1-AS1is an antisense lncRNA derived from the complementary strand of theIDH1gene.IDH1-AS1has recently been demonstrated to affect cell proliferation and tumorigenesis of cervical cancer, prostate cancer, and glioblastoma[9–11], but it remains unknown whetherIDH1-AS1plays a role in the pathogenesis of EOC cells.
In the present study, we identified that low expression ofIDH1-AS1was an independent predictor for a shorter OS in EOC patients based on the analyses using TCGA and TANRIC data.Moreover,an increasing age was associated with an increased risk of EOC progression, which was consistent with the previous reports[13–14].The present results also indicated that the FIGO stage, grade, and lymph node invasion were not indicators of OS and disease-free survival in EOC.Although the grade was considered a controversial prognostic marker[13–14], the FIGO stage and lymph node invasion have been indicated as significant prognostic factors of EOC[15–18].These differences may be due to the fact that the clinical information provided by the databases used in the present study was only from serous EOC patients, and the clinical data were incomplete, especially the data on lymph node metastasis.Therefore, it is necessary to perform further analysis to precisely clarify the association betweenIDH1-AS1and clinical features.
Similar to the study conducted by Xianget al[9]in HeLa cells, we demonstrated that silencingIDH1-AS1enhanced EOC cell proliferation, while overexpressingIDH1-AS1attenuated EOC cell growth.Wang Jet al[11]also reported thatIDH1-AS1suppressed glioblastoma cell proliferation and tumorigenesis.However, Zhanget al[10]revealed thatIDH1-AS1knockdown promoted cell apoptosis in addition to inhibiting cell proliferation and tumor growth in prostate cancer.These studies indicate that different effects ofIDH1-AS1may result from different mechanisms in various cancers.
IDH1-AS1has been demonstrated to participate in the progression of multiple cancers by regulating the IDH1 activity[9,11,19].In the present study, we found thatIDH1-AS1was mainly distributed in the cytoplasm of EOC cells.It is possible thatIDH1-AS1functions in EOC through some other pathways, and some evidence suggests that different subcellular localizations may present distinct biological functions of lncRNAs[20–21].The ceRNA hypothesis is the widely accepted mechanism for cytoplasmic lncRNAs that are suggested to compete against protein-coding mRNAs for the miRNA binding[12].Currently,lncRNA-miRNA-mRNA interactions attract much attention, because they play an extensive role in the pathogenesis of EOC[22–24].In the present study, we demonstrated thatIDH1-AS1suppressed EOC cell proliferation and tumor growth by sponging miR-518c-5p.
miR-518c-5p is a member of the miR-515 family that belongs to the largest human miRNA cluster on chromosome 19, known as C19MC, encoding as many as 59 mature miRNAs[25].miR-518c-5p has been reported to be involved in the progression of bladder cancer in a multivariate Cox regression analysis[26].A reported miRNA microarray analysis has indicated that miR-518c-5p is also upregulated in retinoblastoma and related to tumorigenesis[27].In addition, miR-518c-5p has been suggested to participate in the growth and metastasis of oral cancer by targeting the SDF-1/CXCR4 system[28].In line with these findings, miR-518c-5p may promote EOC cell proliferation in the present study as an oncomiR[25].However, another study has reported that hsa_circ_0007843 promotes the progression of colon cancer by sponging miR-518c-5p to regulate MMP2 expression[29].As the above-mentioned functions of miR-518c-5p range from oncomiR to tumor suppressor, our findings have suggested that the effect of miR-518c-5p is determined by the cellular context in which it is activated.
As an RNA-binding motif protein, RBM47 is a conserved RNA-binding protein in vertebrates and proved to be essential for the viability and growth of vertebrate embryo[30].RBM47 significantly regulates mRNA transcription, RNA splicing, and RNA transportation[31].It is widely accepted that RBM47 functions as a tumor suppressor in multiple cancers.Sakurai Tet al[32]demonstrated that RBM47 suppressed tumor growth of lung adenocarcinoma by inhibiting Nrf2 function.Guoet al[33]reported that RBM47 acted as a DNA/RNA modulator to inhibit the progression of hepatocellular carcinoma.Qinet al[34]found that RBM47 suppressed cell proliferation and activated autophagy in papillary thyroid carcinoma.Shenet al[35]revealed that RBM47 stabilizedAXIN1mRNA to suppress Wnt/β-catenin signaling and inhibited tumor proliferation and metastasis in nonsmall cell lung cancer.Consistent with these investigations, the present study showed that RBM47 suppressed EOC cell proliferation, and thus we concluded thatIDH1-AS1inhibited EOC cell proliferation and tumor growth by upregulating RBM47 mediated by miR-518c-5p.
In conclusion, the present findings reveal thatIDH1-AS1is downregulated in EOC cells and suppresses EOC cell proliferation and tumor growth.IDH1-AS1regulates RBM47 expression levels by a miR-518c-5p-dependent mechanism (Fig.6).Thus,these results indicate thatIDH1-AS1suppresses cell proliferation in EOC by regulating the miR-518c-5p/RBM47 axis.

Fig. 6 A mechanism schematic of the role of IDH1-AS1 in EOC.IDH1-AS1 is transported from the nucleus to the cytoplasm after transcription where it competitively binds to miR-518c-5p, which promotes the mRNA and protein expression of RBM47, ultimately inhibiting cell proliferation and tumor growth of EOC.Abbreviation: EOC, epithelial ovarian cancer.
However, there were still some deficiencies in the present study.Most EOC patients were in an advanced stage without paracancerous tissues, resulting in a lack of comparison of theIDH1-AS1expression in EOC tissues and paracancerous control tissues.In addition,most of the EOC patients from the TCGA database were white, and may not represent the expression ofIDH1-AS1in Chinese.We have been collecting samples of EOC patients from Chinese, and when the sample size is sufficient, we will conduct clinical data analysis ofIDH1-AS1in these samples.Taken together, once confirmed by other investigators, theIDH1-AS1/miR-518c-5p/RBM47 regulatory axis may be a new treatment target for EOC in the future.
Fundings
The present study was financially supported by the National Natural Science Foundation of China (Grant Nos.81572556 and 81402139).
Acknowledgments
We acknowledge and appreciate our institutional colleagues for their experimental technical support.
 THE JOURNAL OF BIOMEDICAL RESEARCH2024年1期
- THE JOURNAL OF BIOMEDICAL RESEARCH的其它文章
- Untoward immune effects of modern medication
- Irisin/BDNF signaling in the muscle-brain axis and circadian system: A review
- Germ cell-specific deletion of Pex3 reveals essential roles of PEX3-dependent peroxisomes in spermiogenesis
- Effect of remimazolam vs.propofol on hemodynamics during general anesthesia induction in elderly patients: Single-center,randomized controlled trial
- Tofacitinib combined with local low-dose ixekizumab injection benefits those with peripheral psoriatic arthritis