
Assessing the conservation impact of Chinese indigenous chicken populations between ex-situ and in-situ using genome-wide SNPs
2024-03-12 13:31WentingLiChaoqunGaoZhaoCaiSensenYanYanruLeiMengyaWeiGuirongSunYadongTianKejunWangXiangtaoKang
Wenting Li ,Chaoqun Gao ,Zhao Cai ,Sensen Yan ,Yanru Lei,Mengya WeiGuirong Sun,Yadong Tian,Kejun Wang#,Xiangtao Kang#
1 College of Animal Science and Technology, Henan Agricultural University, Zhengzhou 450002, China
2 The Shennong Laboratory, Zhengzhou 450002, China
Abstract Conservation programs require rigorous evaluation to ensure the preservation of genetic diversity and viability of conservation populations. In this study,we conducted a comparative analysis of two indigenous Chinese chicken breeds,Gushi and Xichuan black-bone,using whole-genome SNPs to understand their genetic diversity,track changes over time and population structure. The breeds were divided into five conservation populations(GS1,2010,ex-situ;GS2,2019,ex-situ;GS3,2019,in-situ;XB1,2010,in-situ;and XB2,2019,in-situ) based on conservation methods and generations. The genetic diversity indices of three conservation populations of Gushi chicken showed consistent trends,with the GS3 population under in-situ strategy having the highest diversity and GS2 under ex-situ strategy having the lowest. The degree of inbreeding of GS2 was higher than that of GS1 and GS3. Conserved populations of Xichuan black-bone chicken showed no obvious changes in genetic diversity between XB1 and XB2. In terms of population structure,the GS3 population were stratified relative to GS1 and GS2. According to the conservation priority,GS3 had the highest contribution to the total gene and allelic diversity in GS breed,whereas the contribution of XB1 and XB2 were similar. We also observed that the genetic diversity of GS2 was lower than GS3,which were from the same generation but under different conservation programs (in-situ and ex-situ). While XB1 and XB2 had similar levels of genetic diversity. Overall,our findings suggested that the conservation programs performed in ex-situ could slow down the occurrence of inbreeding events,but could not entirely prevent the loss of genetic diversity when the conserved population size was small,while in-situ conservation populations with large population size could maintain a relative high level of genetic diversity.
Keywords: genome-wide SNPs,conservation,genetic diversity,ex-situ,in-situ
1.Introduction
Chickens were domesticated by humans in Southeast Asia,South Asia and East Asia about 10,000 years ago(Lawal and Hanotte 2021;Peterset al.2022),with China being one of the earliest domesticated regions of the world (Wanget al.2020). China has a rich diversity of chicken breeds with 115 native breeds,which are wellknown for their high-quality meat and eggs (Xiaoet al.2019),excellent disease resistance,and adaptability to harsh environmental conditions (Zhanget al.2019b).Domestic chickens are the most widely distributed poultry species in the world,providing a stable source of highquality protein (meat and eggs) for humans (Malomaneet al.2019). Additionally,chickens are also valuable research materials for life science research. This study focuses on the genetic resources of local chickens in Henan Province,aiming to evaluate the conservation effect,establish a dynamic monitoring system,and provide insights into their utilization and development.
The effectiveness of a conservation program can be directly assessed by evaluating the dynamics of genetic diversity across successive generations (Zhanget al.2018). DNA markers are efficient tools for estimating genetic diversity within and between conserved populations (Boettcheret al.2010). Various DNA marker methods have been used to evaluate the genetic diversity of chickens,such as mtDNA (Yanget al.2022),microsatellites (Cortéset al.2016),and amplified fragment length polymorphisms (AFLPs) (Kumaret al.2022).SNP markers,which are widely distributed throughout the genome,have also been used to accurately quantify genetic diversity and population structure (Ablondiet al.2020;Cendronet al.2020;Zhang Let al.2020). For example,Cendronet al.(2021) used a 600K genomewide SNP array to analyze the genetic diversity and population structure of eight Italian local chicken breeds.Linet al.(2022) and Sunet al.(2022) also used SNP markers to estimate genetic diversity in black goats and four Chinese indigenous duck breeds,respectively.Most previous studies have used observed/expected heterozygosity (Ho/He),polymorphism information content (Pp),allele richness (AR),inbreeding coefficient,gene frequency differentiation index (FST),and Nei’s minimum genetic distance (DNei) as criteria for assessing genetic diversity (López-Corteganoet al.2019). Using gene diversity and allelic diversity as the measurement,the contribution of each subpopulation is the components of subpopulations in a simulated synthetic pool when the expected heterozygosity of the pool composed of subpopulations reached a peak.
Another accepted technique for identifying the loss of genetic diversity among breeds is the run of homozygosity (ROH) (Ablondiet al.2020). ROHs were brought by identical-by-descent haplotypes that are shared among ancestors or among other evolutionary processes (Ceballoset al.2018). As a result,ROH has become a useful source of data for describing genomic inbreeding (FROH) (Peripolliet al.2017;Onzimaet al.2018).FROHcaptures variation compared to pedigreebased inbreeding due to Mendelian sampling and linkage during gamete formation (Howardet al.2017),as shown by previous studies (Sørensenet al.2008;Schurinket al.2012). In addition,linkage disequilibrium decay and effective population size analysis can reflect the loss of genetic diversity in a conservation population as generations progress (Zhanget al.2018). The slower the LD decay,the higher the degree of linkage on the genome,the lower the genetic diversity. A lower effective population size also means lower genetic diversity.
In the present work,we conducted a comprehensive analysis of genetic diversity and tracked changes over time in five Chinese indigenous chicken conservation populations using genome-wide SNPs. Our findings can serve as a reference for improving ongoing conservation efforts.
2.Material and methods
2.1.Samples and data preparation
In this experiment,89 Gushi chickens and 60 Xichuan black-bone chickens were used to collect 2 mL blood for each individual from the wing vein. After heparin anticoagulant treatment,they were stored in a refrigerator at–20°C (Table 1).

Table 1 Breeds information
Initially,a total of 149 individuals from Gushi chickens and Xichuan black-bone chickens were used for extracting genomic DNA from blood or tissue DNA extraction kits(QIAGEN,Germany,Cat.No.69506). The concentration and purity of DNA samples were evaluated by detecting 1.0 μL of each sample using the NanoDrop2000 spectrophotometer,ensuring that the OD260/OD280ratio was between 1.8–2.2,and the OD260/OD230ratio was ≥2.0 to confirm the absence of protein and RNA contamination.Additionally,the integrity of DNA was verified by 1%agarose gel electrophoresis (150 V,20 min). All DNA samples have passed quality control and can be used for subsequent sequencing library construction.
The qualified DNA samples were randomly fragmented into 500 bp fragments using a Covaris ultrasonic disruptor. The whole library was constructed using paired-end,A-tailing at the 3´ end,ligation of sequencing adapters,purification,and recovery of DNA fragments of appropriate size,followed by PCR amplification. The constructed library was initially quantified using Qubit2.0 and then diluted to 1 ng μL–1. The size of the library fragments was verified using Agilent 2100 Bioanalyzer(Agilent Technologies,Palo Alto,California),and after confirming the fragment size met expectations,the library was quantified using qPCR.
Each DNA library was subjected to double-end whole genome resequencing (PE150) using the BGI-seq500 high-throughput sequencing platform. The average insert length of the library was 500 bp,and 150 bp at both ends were sequenced. The resequencing was performed by BGI. The average depth of each sample was estimated to be 10×,and the amount of data was approximately 11G.
2.2.Genotyping and data filtering
The original image data obtained from the BGI-seq500 platform sequencing was converted into sequence data by base calling,resulting in raw data for resequencing. To ensure data quality,the data underwent a quality control process,filtering out connector information,low-quality bases,and unmeasured bases (10% N bases),resulting in clean data. The output data amount and quality were also evaluated. Subsequently,the clean data was aligned to the chicken reference genome (GRCg6a) using BWAMEN (Li 2013),SAMTOOLS (Liet al.2009) and GATK(McKennaet al.2010) pipeline. Duplicate reads were removed,and SNP calling was performed. The ratio of resequencing to the reference genome,genome coverage,and sequencing depth were calculated.
After SNP calling with GATK,a total of 19,488,937 SNPs were obtained. These SNPs were further filtered using PLINK v1.9 (Purcellet al.2007) based on the following criteria: SNP missing rate<0.01 and minor allele frequency (MAF)>0.05. A total of 10,264,966 SNPs passed the filtering process and were retained for subsequent analysis.
2.3.Evaluation of conservation efficiency of conservation population
To evaluate the effectiveness of conservation efforts on a population,it is important to measure genetic diversity within that population. Several indicators can be used to quantify genetic diversity,including expected heterozygosity (He),observed heterozygosity (Ho),the proportion of polymorphic markers (Pp),allelic richness(AR),nucleotide diversity (Pi),and average Nei’s distance between individuals (DNei). In this study,He,Ho,and Pp were calculated using PLINK software,while AR and DNeiwere calculated using metapop2 software (López-Corteganoet al.2019),and Pi was calculated using VCFTOOLs v1.13 software (Daneceket al.2011).
The inbreeding coefficient of the population can also be calculated using three indexes:FHOM,FES,andFROH.FHOMis calculated based on the difference between observed and expected numbers of homozygous genotypes using PLINK software.FESis based on the mating system of the conservation population and the relationship between the inbreeding coefficient Ft of the t generation and the inbreeding coefficient increment is calculated asFt=1–(1–ΔF)t,assuming that the initial population has an inbreeding coefficient of zero.FROHis calculated based on ROH and is equal to the ratio of the total length of ROH fragments in the genome to the total size of the normal genome (the autosome size of GRCg6a is about 959,762,775 bp).
2.4.Analysis of population structure and genetic diversity
Before estimating population structure,we conducted“pruning” of linkage disequilibrium (LD) using PLINK(arguments: --indep-pairwise 50 5 0.2) to remove redundant genetic information. We then used PLINK to calculate principal component analysis (PCA),and extracted the first two feature vectors (PC1/PC2) as the horizontal and vertical coordinates. To explore the evolutionary relationship between different conservation populations,we used vcf2phylip (Ortiz 2019) and fastTree(GTR model) (Priceet al.2010) to construct a phylogenetic tree of all populations,which was visualized using iTOL(Letunic and Bork 2019). We analyzed the correlation between populations using ADMIXTURE v1.3 (Pattersonet al.2012),with a data set of K=9. Hierfstat (Goudet 2005) and metapop2 (López-Corteganoet al.2019) were used to calculate pairwise population differentiation index(FST) and Nei’s minimum genetic distance (DNei) of all populations to estimate genetic differentiation between populations.
To obtain more accurate genetic diversity information,we treated the five conservation populations as a metapopulation and eliminated them one by one to evaluate the acquisition and loss of genetic diversity (– and+,respectively) and assess conservation efficiency.Metapop2 was used for this calculation,dividing genetic diversity into total gene diversity (HT) and allelic diversity(AT) for comparison. HT was divided into average gene diversity within a population (HS) and average gene diversity between populations (DG). HS was determined as 1 minus the average of intra-population co-ancestries,and DG was calculated as the average Nei’s genetic distance between populations. Similarly,AT was divided into intra-population (AS) and inter-population (DA)diversity. AS was obtained directly from the average allelic richness of the population,while DA was derived as the average number of unique alleles in a conservation population compared to other conservation populations,averaged over all possible conservation populations pairs. We also used Metapop2 to simulate changes in the expected heterozygosity (H) of synthetic populations to identify the point at which the maximum expected heterozygosity was reached,based on the proportion of individuals in each subgroup. This proportion represented the contribution of each subgroup to the synthetic population.
2.5.Runs of homozygosity
The ROH of each individual were estimated using PLINK.The following detection parameters were used: (1) a minimum ROH fragment length of 300 kb;(2) a maximum of 5 deletions and 3 heterozygous genotypes;(3) at least 50 consecutive SNPs;(4) a SNP density of 0.05 SNP kb–1;and (5) a maximum interval of 1 Mb between continuous homozygous SNPs. ROH fragments were categorized into six groups based on their length: 0.3–1,1–2,2–4,4–8,8–10,and over 10 Mb (Talebiet al.2020).
2.6.Linkage disequilibrium decay and effective population size
To calculate and visualize the linkage disequilibrium decay for all groups,we employed PopLDdecay (Zhanget al.2019a) with the parameters -bin1 500,-bin2 1100,and -break 2000. Historical effective population size (Ne)was predicted using SMC++(Terhorstet al.2017),with a generation time (g) of 1 year and an annual mutation rate(u) of 1.91×10⁻⁹(Wanget al.2020). To account for the high recombination rate of small chromosomes,Ne was estimated based on large chromosomes (GGA1–GGA5)for the different conservation populations (Zhanget al.2018).
3.Results
3.1.Overview of whole-genome re-sequencing data
Through the use of whole genome resequencing technology,the BGI-seq500 sequencing platform was employed to conduct double-end (pair-end 150 bp) sequencing.After the removal of low-quality data,the resulting clean sequencing data amounted to 1.65 TB,with Q20 and Q30 values of >96% and >93%,respectively. The GC content of the samples ranged from 41 to 43%. The statistical results indicated that the sequencing quality was of high quality,the GC distribution of the samples was normal,and the sequencing process was successful.
To compare the clean data with the chicken reference genome,BWA was utilized,which resulted in a comparison rate of >99%,a comparison error rate of<0.05%,and an average coverage of 10× . As a result,the reads comparison outcomes for subsequent analysis demonstrated high accuracy and reliability. A total of 19,488,937 high-quality SNPs were identified in 149 individuals of Gushi chicken and Xichuan black-bone chicken. The distribution of SNPs on chromosomes is shown in Fig.1-A,which indicates that the mutation sites are evenly distributed on chromosomes (Fig.1-B).Larger chromosomes have more SNPs,whereas smaller chromosomes have fewer SNPs. The number of SNPs is positively correlated with chromosome length.
3.2.Genome genetic diversity estimation
The population genetic parameters,including Ho,He,Pi,Pp,AR,and DNei,were statistically analyzed based on the variation site information of Gushi chicken and Xichuan black-bone chicken,as shown in Fig.2. Overall,the conservation populations of both Gushi chicken and Xichuan black-bone chicken maintained high genetic diversity,with GS3 exhibiting the highest genetic diversity. The genomic genetic diversity indexes of Gushi chicken native populations (GS3,Ho=0.296,He=0.299,Pi=0.00330,Pp=0.799,AR=0.946,DNei=0.152) were higher than those of the same generation of alien populations(GS2,Ho=0.234,He=0.238,Pi=0.00260,Pp=0.484,AR=0.758,DNei=0.121). For GS2 and GS1 (Ho=0.253,He=0.251,Pi=0.00277,Pp=0.548,AR=0.822,DNei=0.125),the Gushi population showed a trend of decreasing genetic diversity with the advancement of conservation generation.

Fig. 1 Number of SNP within 1 Mb window (A) and number of SNP on each chromosome (B).

Fig. 2 Genetic diversity parameters of five conservation populations. Ho,observed heterozygosity;He,expected heterozygosity;Pi,nucleotide diversity;Pp,the proportion of polymorphic markers;AR,allelic richness;DNei,average Nei’s distance between individuals.
Both conservation populations of Xichuan blackbone chickens (XB1,Ho=0.289,He=0.297,Pi=0.301,Pp=0.755,AR=0.946,DNei=0.152;XB2,Ho=0.297,He=0.299,Pi=0.304,Pp=0.761,AR=0.949,DNei=0.151)were preserved in the origin,and the genetic diversity index showed a slight fluctuation with the passage of the conservation generation. In general,the genetic diversity ofin-situpopulations (GS3,XB1 and XB2) was higher than that ofex-situpopulations (GS1 and GS2). The results of different generations ofex-situconservation populations showed that the genetic diversity showed a significant downward trend with the extend of conservation generations (GS1 and GS2),while the genetic diversity of conserved populationsin-situfrom different generations showed slight fluctuations but remained at a high level(XB1 and XB2).
3.3.lnbreeding coefficient
To assess the extent of inbreeding between Gushi chicken and Xichuan black-bone chicken,we employed three inbreeding coefficients (FHOM,FES,andFROH) to estimate the inbreeding level of different conservation populations(Fig.3). Results indicated that,under the same conservation method (i.e.,Gushi conservation population underexsitustrategy),the inbreeding coefficient increased as the conservation generation advanced (GS1:FHOM=–0.00757,FES=0.0954,FROH=0.226;GS2:FHOM=0.0202,FES=0.121,FROH=0.252). Moreover,the inbreeding coefficient of the original conservation population was lower than that of the off-site conservation population in the same period (GS3:FHOM=0.0115,FES=0.0207,FROH=0.0583).
Regarding the average inbreeding coefficient(F-average),the GS1 population had the highestF-average(0.105),whereas the GS3 population had the lowest(0.0187). The inbreeding coefficient ofin-situconservation populations was lower than that ofex-situconserved stock.For GS1 (F-average=0.105) and GS2 (F-average=0.131),the genomic inbreeding coefficient decreased as the conservation generation advanced but did not reach a significant level. For XB1 (F-average=0.0500) and XB2(F-average=0.0450),the genomic inbreeding coefficient fluctuated within a small range.
3.4.Population structure and gene and allelic diversity
Population structure and population divergence analysisPCA was conducted on 149 chicken individuals from various populations. The contribution rate of each principal component (PC) was calculated using eigenvector. According to the first two eigenvectors (PC1,32.25%;PC2,11.67%),Gushi chicken and Xichuan blackbone chicken were clearly separated into two groups(Fig.4-A). Theex-situconservation populations of Gushi chicken (GS1 and GS2) and thein-situconservation population (GS3) were also separated into two groups.However,there was no clear grouping observed for Xichuan black-bone chicken. These results suggest that population stratification occurred between theex-situandin-situconservation populations from Gushi chicken,but not in thein-situpopulations of Xichuan black-bone chickens from two different generations. It is worth noting that three individuals from the XB2 population were mixed with the GS3 population.

Fig. 3 Inbreeding coefficients of five conservation populations. FHOM,based on the homozygous genotypes;FES,based on the mating system of the conservation population;FROH,based on runs of homozygosity.
In the ADMIXTURE analysis,the K value of the ancestral population was set from 2 to 9. The results are shown in Fig.5-A,and when K=2,GS1 and GS2 could be separated from thein-situpopulations of the two varieties (GS3,XB1 and XB2),while GS3 was in a unified subgroup with XB1 and XB2. When K=3,the analysis divided the populations into three groups: GS1 and GS2,GS3,and XB1 and XB2. K=3 was found to be the optimal K value based on the results (Fig.5-A). As the K value increased,the groups from different generations were further divided into independent subgroups (Fig.5-B). It is evident from the population structure analysis that the subgroups of different varieties and conservation methods showed independent genetic backgrounds.
In order to estimate the genetic differentiation between three subgroups of Gushi chicken and two conservation populations of Xichuan black-bone chicken,we calculated the genetic differentiation index (FST,lower region) and Nei’s genetic distance (DNei,upper region) between different conservation populations (Fig.6). The results showed that the Xichuan black-bone chicken had obvious genetic differentiation (FST>0.10) from the Gushi chickenex-situconservation population (GS1 and GS2),and had a close genetic relationship with thein-situconservation population (GS3),which was consistent with the results of the population structure analysis. There was obvious genetic differentiation between GS3 and its same generation ofex-situpopulation GS2 (FST=0.1,DNei=0.19).Gushi conserved population (GS1 and GS2) did not show differentiation under the same conservation method.Similarly,no differentiation was observed between XB1 and XB2 (FST<0.05). We further calculated the genetic distance between populations. As shown in the upper half of Fig.6,the genetic distance between different populations is consistent withFSTresults.
Contribution of the different conservation populations to gene and allelic diversitiesThe contribution of each population was evaluated (Fig.7-A). Removal of GS3,XB1,and XB2 resulted in a loss of total gene diversity(GS3: HT=1.90%;XB1: HT=2.04%;XB2: HT=2.12%).However,theex-situconservation populations (GS1 and GS2) had a negative contribution to the total gene diversity (GS1: HT=–1.17%;GS2: HT=–0.98%). Notably,GS1 and GS2 had the highest contribution to interpopulation gene diversity (GS1: DG=1.03%;GS2:DG=1.89%) among meta-populations,but also the highest negative contribution to gene diversity intra-population(GS1: HS=–2.01%;GS2: HS=–3.06%). In addition,HS reflects the inbreeding degree of population.
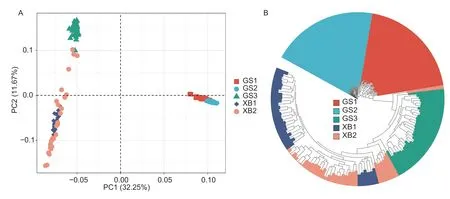
Fig. 4 Principal component analysis (PCA) analysis (A) and phylogenetic tree of the five indigenous breeds (B).
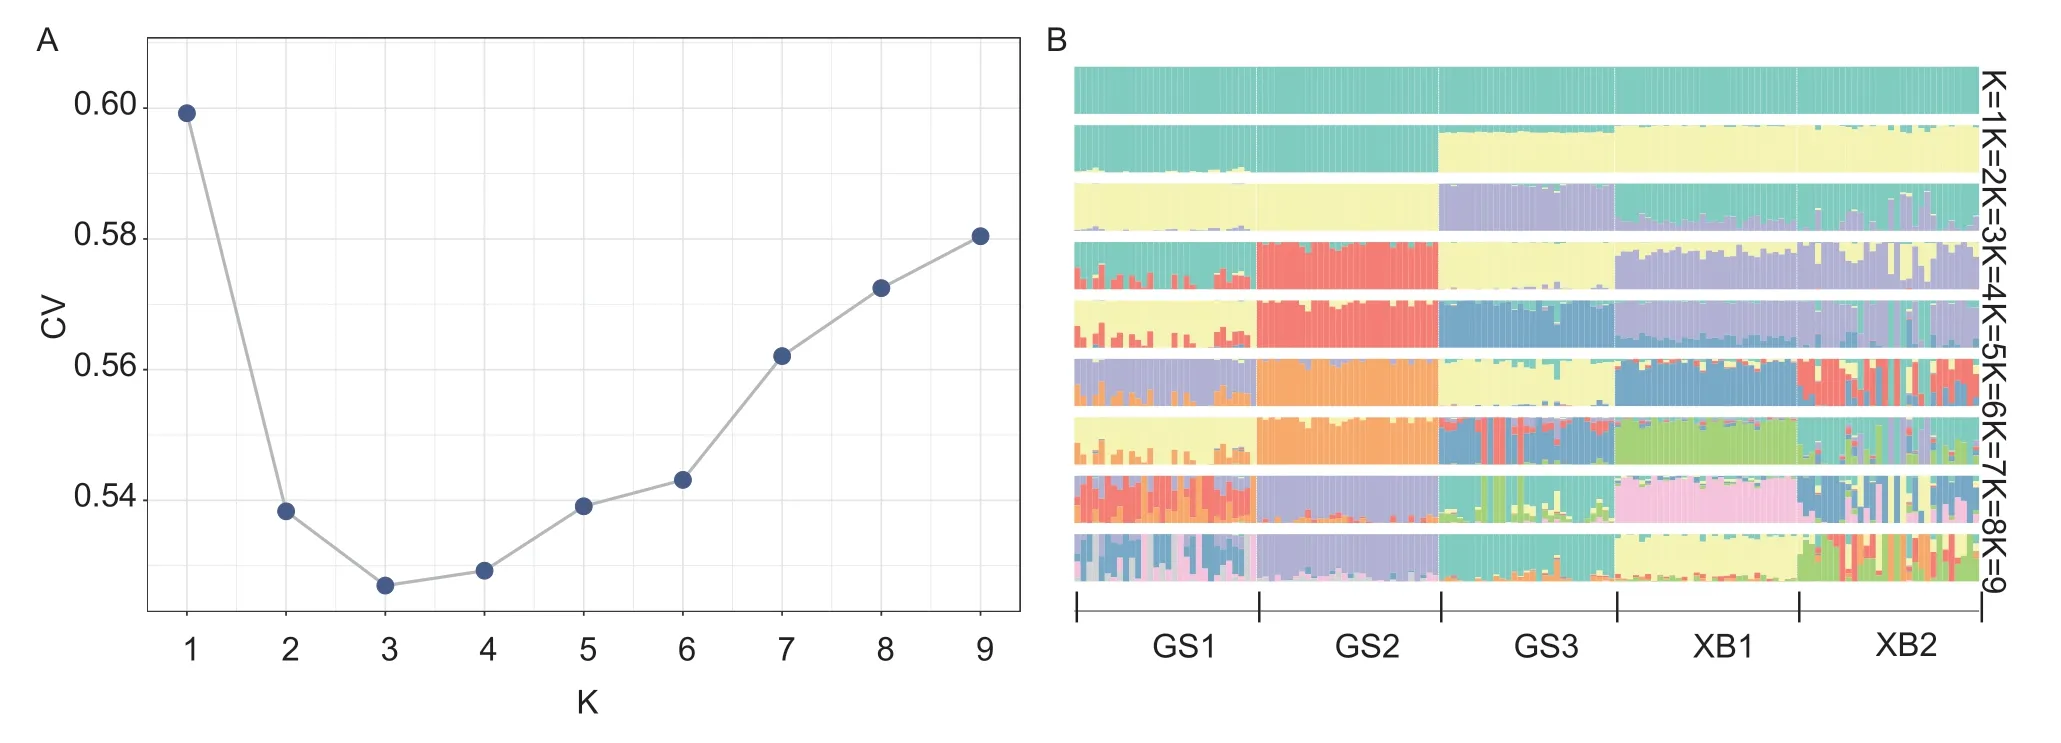
Fig. 5 Cross-validation (CV) error rate (A) and population structure of the five indigenous breeds (B).

Fig. 6 Heatmap plot of genetic differentiation index FST (lower)and Nei’s minimum genetic distance DNei (upper).
The results of allele diversity analysis in Fig.7-B were consistent with those of genetic diversity. The removal of GS3,XB1,and XB2 resulted in a loss of total allelic diversity (GS: AT=1.35%;XB1: AT=1.65%;XB2:AT=1.69%). Theex-situconservation populations had negative contributions to allelic diversity (AT=–0.95% and AT=–1.41% for GS1 and GS2,respectively).
Next,we simulated the contributions of the populations to the synthetic pool and computed their proportion at the maximum value of expected heterozygosity (Fig.7-C).The contribution of populations to the synthetic pool was ranked as follows: GS3 (31.9%),XB2 (26.6%),XB1(20.9%),GS1 (13.7%),and GS2 (6.9%).
3.5.Runs of homozygosity
In this study,we identified ROH across the entire genome of five populations and analyzed a total of 221,250 ROH fragments,with the longest fragment reaching 13.58 Mb.The distribution and detailed statistics of ROH are shown in Fig.8-A and B. Fig.8-C provides a more detailed visualization of individual-basedFROHdata to better understand inbreeding. The results showed that the GS2 population had the most ROH events,with longer ROH fragments,while the GS3 population had the least ROH events with shorter fragments,indicating that inbreeding events for GS3 may have occurred in the Gushi chicken population in modern times (Fig.8-C).
Furthermore,we compared and analyzed the XB1 and XB2 populations and found that XB2 had a higher frequency of ROH events with longer ROH fragments than XB1,suggesting that some inbreeding events may have occurred within the population from 2010 to 2019(Fig.8-C). Finally,we compared the conservation effect among the three conservation populations (GS2,GS3,and XB2) of the same 2019 generation and found that the conservation effect of thein-situpopulation (GS3 and XB2) was better than that of theex-situpopulation (GS2).
3.6.Linkage disequilibrium decay and effective population size
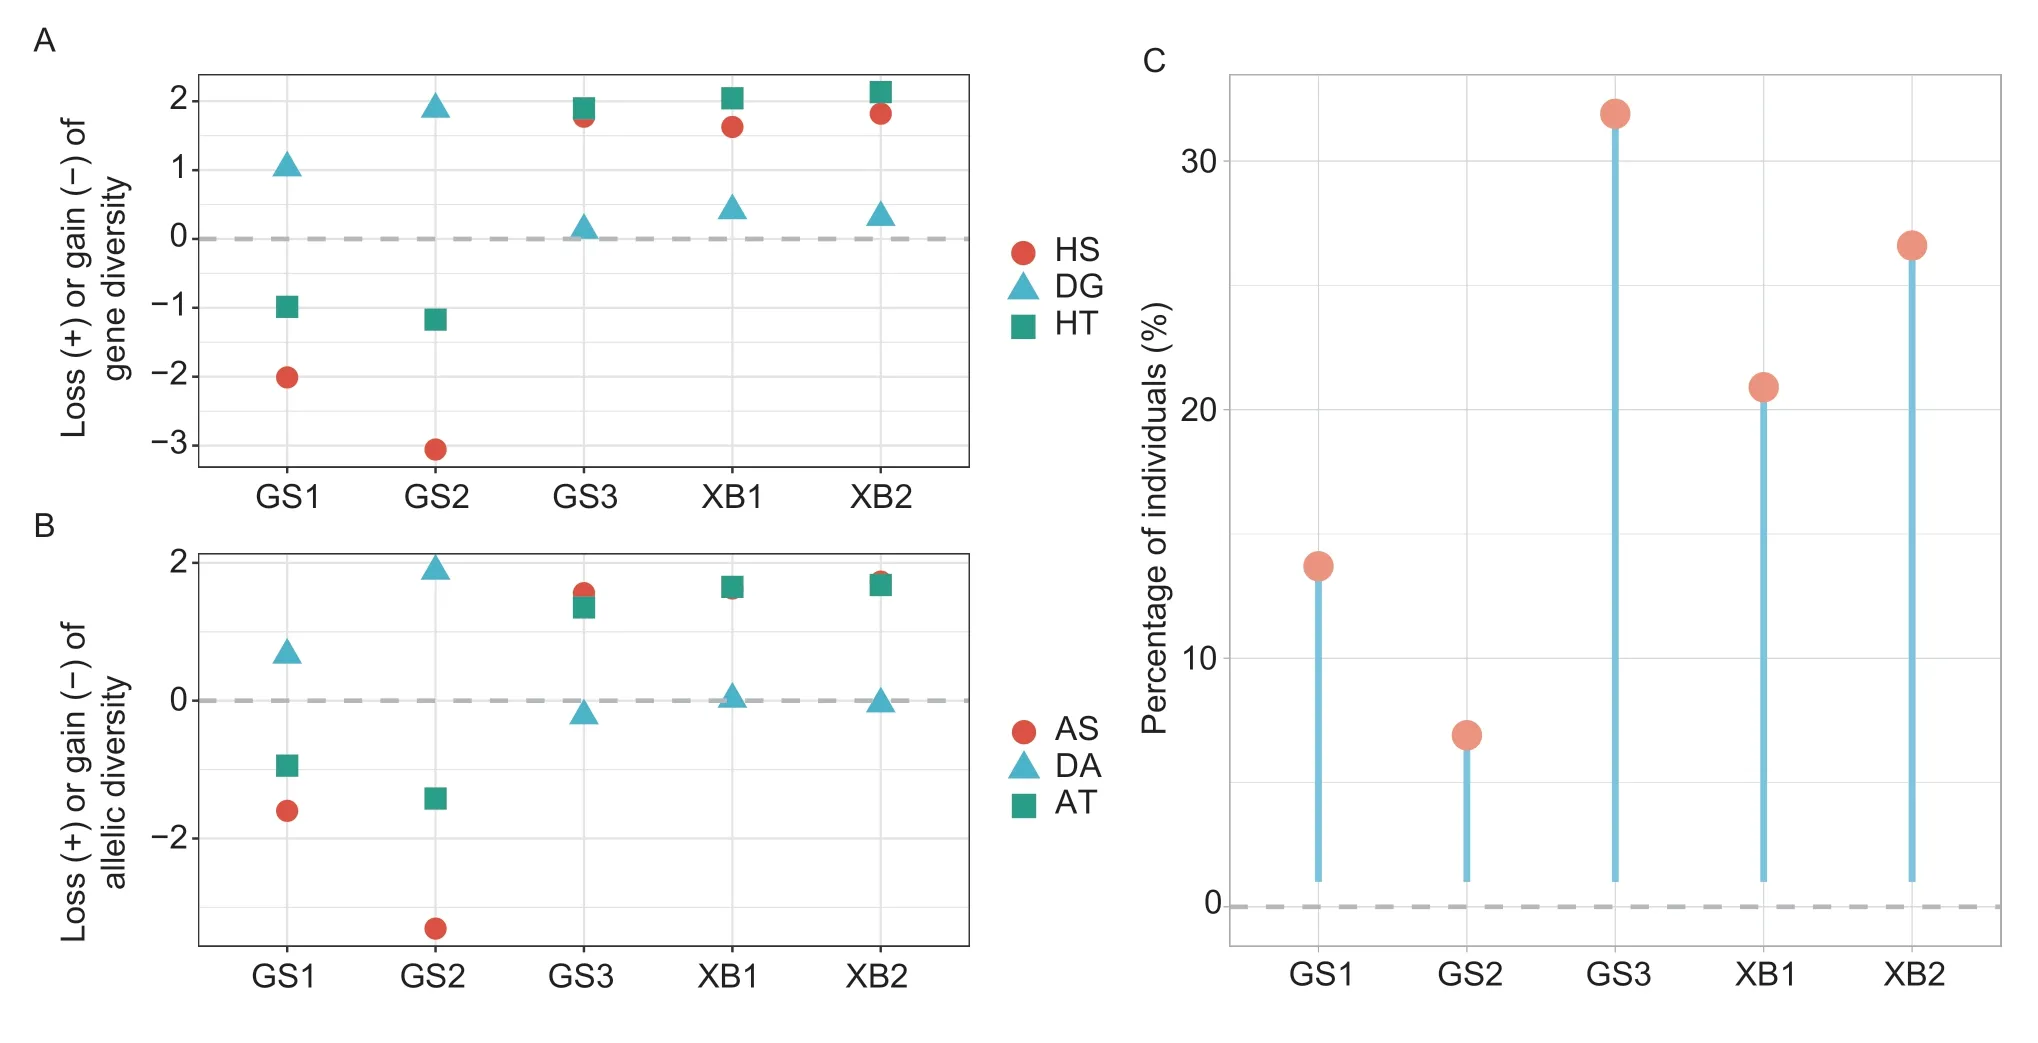
Fig. 7 Contribution of the five-conservation population to genetic diversity. A,loss (+) or gain (–) of genetic diversity after sequential removal of each breed. HS is the gene diversity intra-breed,DG is the gene diversity inter-breed,and HT is the total loss or gain of gene diversity. B,loss (+) or gain (–) of allelic diversity after sequentially removal of each breed. AS is allelic diversity intra-breed,DA is allelic diversity inter-breed,and AT is the total loss or gain of allelic diversity. C,contribution of individuals from each breed to pools with the greatest proportion of expected heterozygosity (H).
In this study,the LD decay between different physical distances was examined in different populations (Fig.9-A).The results showed that the order of LD decay distance was GS2>GS1>XB2>XB1>GS3. When comparing the different populations (GS2,XB2,and GS3) of the same generation,it was observed that the LD decay distance ofin-situconservation populations was shorter,indicating thatex-situconservation populations experienced a more significant loss of genetic diversity. Furthermore,when comparing different conservation populations (GS1 and GS2,XB1 and XB2) under the same conservation method,it was found that this distance showed an increasing trend with the conservation generations extension,suggesting that there was a decrease in genetic diversity over time with the increasing of conservation generations.
Fig.9-B illustrates that the Ne of GS1 and GS2 decreased rapidly across generations,while the Ne of GS3,XB1,and XB2 remained relatively stable in recent generations. Additionally,for the conservation populations of Gushi chicken and Xichuan black-bone chicken,in-situconservation populations had a higher Ne thanex-situconserved stocks.
I wish that a spark of fire would fall on my net, whispered he; and the next minute a great log fell forward into the midst of the tent, causing every one to spring backwards11
4.Discussion
China has established a relatively complete protection system for livestock and poultry genetic resources(Chen 2019),within-situandex-situmethods being the primary conservation approach for native chicken genetic resources (Zhanget al.2018;Zhang Met al.2020).However,most of the indigenous chicken populations in China are conserved in small populations,which increases the risk of extinction and loss of favorable alleles due to genetic drift or selection (Boichardet al.2015). Therefore,effective conservation programs and accurate evaluation of conservation efficiency are essential for the protection and utilization of genetic resources.
Currently,many researchers utilize molecular markers to monitor genetic diversity in indigenous chicken conservation populations. Chenet al.(2008) analyzed the genetic diversity of 15 Chinese indigenous chicken breeds using microsatellite markers for conservation strategies and utilization. Chenet al.(2019) used SNP array to evaluate the genetic diversity and population structure for efficient conservation programs for Jiangxi chicken breeds. Zhanget al.(2018) assessed the conservation status of three Chinese chicken breeds based on GBSseq simplified genome sequencing. According to Luoet al.(2020),SNP markers in genomics provide a more comprehensive evaluation of population genetic diversity than other molecular markers. As sequencing technology continues to develop and sequencing costs decrease (Gianiet al.2020),using whole genome data to explore genetic diversity,population structure,population evolution,and population history is becoming the most important method for studying conservation genomics. In this study,we used whole genome resequencing technology to capture genome-wide SNPs data and monitor the genomic genetic diversity of indigenous chicken breeds (Gushi chicken and Xichuan black-bone chicken) in Henan Province.We also evaluated the conservation efficiency of current conservation strategy in native chicken.
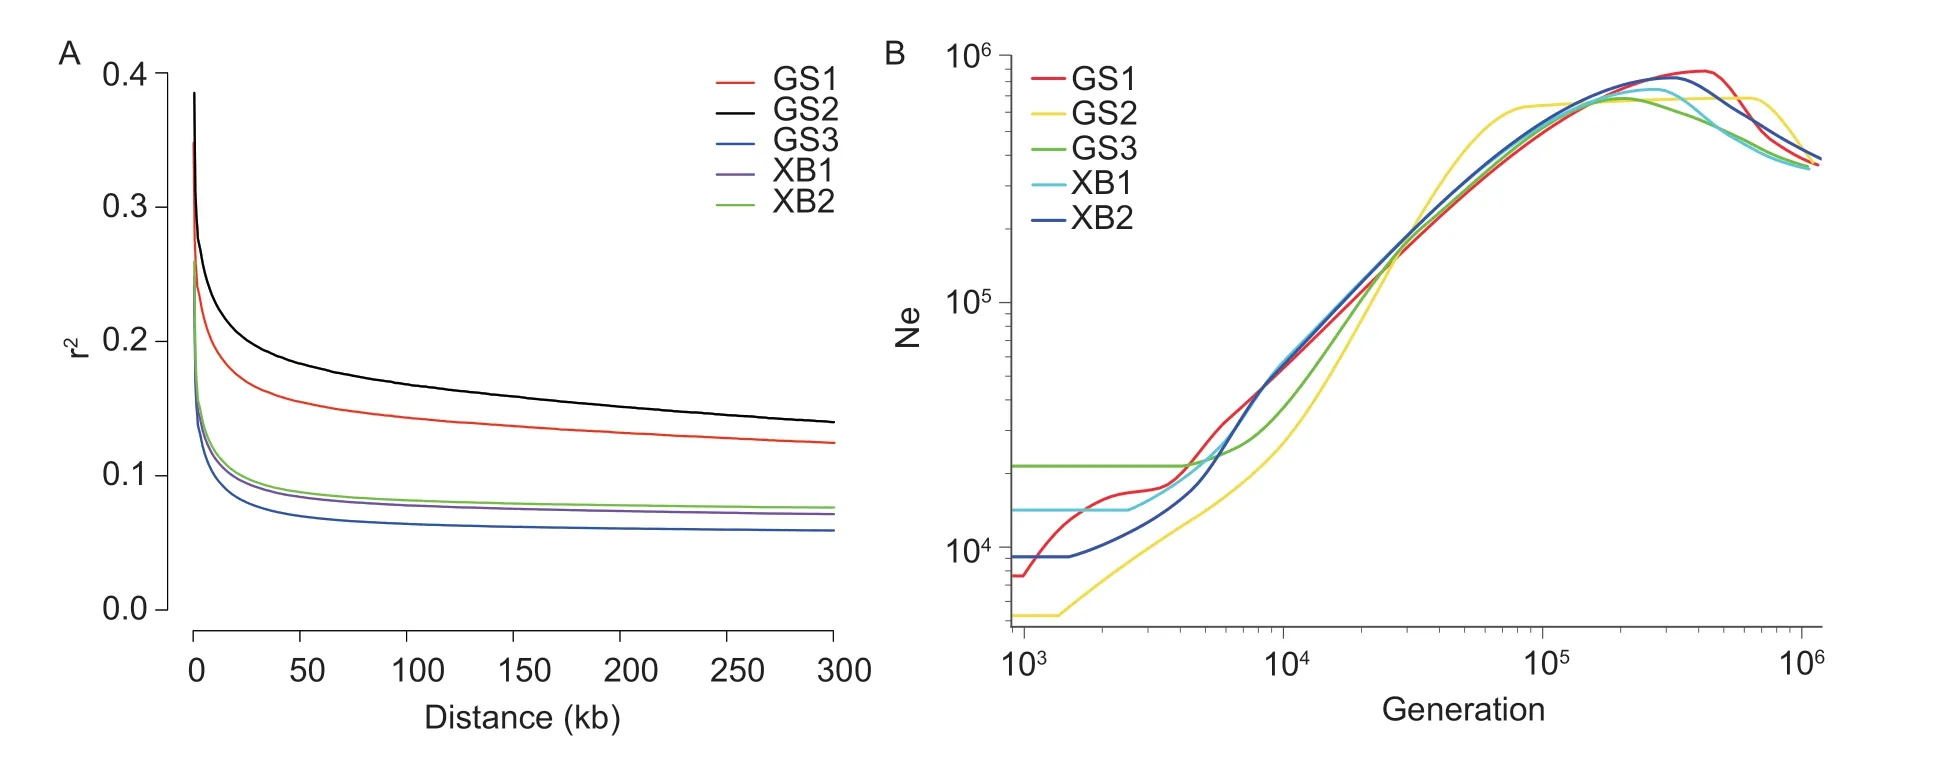
Fig. 9 A,linkage disequilibrium (LD,r2) decay for the five conservation populations,genetic distance is measured in kilo base pair(kb). B,historical trace of the effective population size (Ne) from the genomic data.
In this study,the average observed heterozygosity ranged from 0.234 to 0.297,while the allele abundance ranged from 0.758 to 0.949. The proportion of polymorphic loci ranged from 0.484 to 0.799,indicating that the genomic genetic diversity of each conservation population,except for GS2,was relatively high. However,an analysis of two Gushi chicken conservation populations using the sameex-situconservation method showed a significant decrease in genetic diversity. In contrast,the genetic diversity of the two Xichuan black-bone chicken populations under the same conservation method of origin only fluctuated slightly. When comparing the same generations ofin-situandex-situconservation populations,it was found that the genetic diversity of thein-situconservation population of Gushi chicken was higher than that of theex-situconservation population. The equal selection for each family is more effective in maintaining genetic diversity than random selection. However,in our study,even after 40 years ofin-situandex-situconservation using the most effective selection scheme (small population size,equal selection for each family),theex-situconservation still had a lower genetic diversity thanin-situconservation with random selection (large population size,no artificial intervention). This indicates that as long as the population size is large enough,genetic drift and inbreeding can be effectively reduced,thereby maintaining genetic diversity of the population. Population structure analysis,including PCA,phylogenetic tree,and ADMIXTURE,revealed stratification between different generations of the same conservation method for both Gushi chicken and Xichuan black-bone chicken populations,which was consistent with the population structure previously analyzed using PAV(Wanget al.2021). Furthermore,genetic stratification was observed between conservation populations with the same origin (GS1 and GS2,GS3),suggesting that conservation methods influence the genetic structure of the population.TheFSTbetween different conservation populations of Gushi chicken and Xichuan black-bone chicken ranged from 0.04 to 0.12,and DNeiranged from 0.09 to 0.22,indicating moderate differentiation among conservation populations of the same breed but under different conservation methods. However,there was no genetic differentiation observed among conservation populations of the same breed and under the same conservation methods but different generations.
Further,we evaluated the conservation effect by assessing the gene and allele diversity of five conservation populations. These methods have been successfully applied in previous studies on genetic diversity in Taihu pigs (Zhaoet al.2021) and Tibetan pigs(Shanget al.2020) in China. Our findings indicate that the contribution of GS1 and GS2 to total gene and total allelic diversity was lower than that of GS3. Specifically,the contribution rate ofin-situconservation populations exceeded 20% (GS3=31.9%,XB1=26.6%,XB2=20.9%)when the expected heterozygosity of the synthetic population was at its largest,while the contribution rate ofex-situconservation populations was less than 20%(GS1=13.7%,GS2=6.9%). These results suggest that genetic diversity inex-situconservation populations decreased gradually over generations.
ROH analysis is a useful tool for measuring the inbreeding and genome-wide SNPs are particularly suitable for detecting genomic regions with reduced heterozygosity(Bortoluzziet al.2018). The length of the ROH fragment can reflect the history of animal inbreeding,with shorter ROH fragments indicating inbreeding in distant generations and longer ROH fragments indicating inbreeding in recent generations (Peripolliet al.2017;Ablondiet al.2020).FROH,calculated from ROH analysis,is considered to be one of the most effective methods for detecting inbreeding and has been validated in cattle (Kimet al.2013),pigs (Bosseet al.2015),and goats (Onzimaet al.2018). Higher levels of inbreeding result in a greater number and length of ROH fragments in the genome. Our results showed that inbreeding from GS1 to GS2 gradually increased,resulting in a loss of genetic diversity. Similarly,the slow LD decay of GS1 and GS2,along with Ne values lower than those of GS3,also suggest a loss of genetic diversity. LD between markers tends to decay as physical distance increases,with greater decay associated with higher levels of SNP linkage and lower genetic diversity (Al-Mamunet al.2015).Additionally,reductions in Ne are associated with a loss of genetic diversity in the population (Hohenloheet al.2021). These findings indicate that the genetic diversity of GS3 is higher than that of GS1 and GS2. In summary,our study demonstrates that conservation populations using thein-situconservation method has experienced small fluctuations in genetic diversity,whileex-situconservation populations have shown a gradual loss of genetic diversity over time.
5.Conclusion
Based on the aforementioned research,we assessed conservation status of Gushi and Xichuan blackbone chicken from different generations under different conservation strategies,made it possible to comprehensively estimate the effectiveness of current conservation strategies (in-situandex-situ). The results showed that every population maintained relatively high genetic diversity no matter underin-situorex-situ. The optimal conservation strategy (R:F) forex-situsmall population could effectively slow down the occurrence of inbreeding events,but it is impossible to avoid the loss of genetic diversity. The genetic diversity forinsituconserved population was higher than that ofex-situpopulation,which indicates that as long as the population size was large enough,the occurrence of genetic drift and inbreeding events can be effectively reduced,thus maintaining the genetic diversity of the population.
Acknowledgements
This work supported by the Key Research Project of the Shennong Laboratory,Henan Province,China (SN01-2022-05),the National Natural Science Foundation of China (32272866),the Young Elite Scientists Sponsorship Program by CAST (2021QNRC001) and the Starting Foundation for Outstanding Young Scientists of Henan Agricultural University,China (30500664&30501280).
Declaration of competing interest
The authors declare that they have no conflict of interest.
Ethical approval
Animal care and experiments were conducted with the approval by the Institutional Animal Care and Use Committee (IACUC) of Henan Agricultural University,China (Permit Number: HNND2020030118).
 Journal of Integrative Agriculture2024年3期
- Journal of Integrative Agriculture的其它文章
- Molecular mechanisms of stress resistance in sorghum: lmplications for crop improvement strategies
- Artificial selection of the Green Revolution gene Semidwarf 1 is implicated in upland rice breeding
- Dynamics and genetic regulation of macronutrient concentrations during grain development in maize
- The NAC transcription factor LuNAC61 negatively regulates fiber development in flax (Linum usitatissimum L.)
- The underlying mechanism of variety–water–nitrogen–stubble damage interactions on yield formation in ratoon rice with low stubble height under mechanized harvesting
- Rice canopy temperature is affected by nitrogen fertilizer