
Irrigation and nitrogen fertiliser optimisation in protected vegetable fields of northern China: Achieving environmental and agronomic sustainability
2024-03-12 13:32BingqianFanYitaoZhangOwenFentonKarenDalyJungaiLiHongyuanWangLimeiZhaiXiaoshengLuoQiuliangLeiShuxiaWuHongbinLiu
Bingqian Fan ,Yitao Zhang ,Owen Fenton ,Karen Daly ,Jungai Li ,Hongyuan Wang# ,Limei Zhai,Xiaosheng Luo,Qiuliang Lei,Shuxia Wu,Hongbin Liu#
1 State Key Laboratory of Efficient Utilization of Arid and Semi-arid Arable Land in Northern China/Key Laboratory of Nonpoint Source Pollution Control, Ministry of Agriculture and Rural Affairs/Institute of Agricultural Resources and Regional Planning,Chinese Academy of Agricultural Sciences, Beijing 100081, China
2 Institute of Geographic Sciences and Natural Resources Research, Chinese Academy of Sciences, Beijing 100101, China
3 Teagasc, Environmental Research Centre, Wexford Y35, Ireland
4 Institute of Plant Nutrition, Resources and Environmental Sciences, Henan Academy of Agricultural Sciences, Zhengzhou 450002, China
Abstract Globally,sub-optimal use of nitrogen (N) fertiliser and elevated N irrigation groundwater have led to high leached nitrate (NO3–) losses from protected vegetable field systems. Optimising fertiliser and irrigation management in different soil types is crucial to reduce future N loads from such systems. The present 4-year study examined leached N loads from lysimeter monitoring arrays set up across 18 protected vegetable system sites encompassing the dominant soil types of northern China. The treatments applied at each field site were: 1) a high N and high irrigation input treatment (HNHI);2) a low N but high irrigation input treatment (LNHI) and 3) a low N with low irrigation input treatment (LNLI). Results showed that the mean annual leached total nitrogen loads from the HNHI,LNHI and LNLI treatments were 325,294 and 257 kg N ha–1 in the fluvo-aquic soil,114,100 and 78 kg N ha–1 in the cinnamon soil and 79,68 and 57 kg N ha–1 in the black soil,respectively. The N dissolved in irrigation water in the fluvo-aquic soil areas was 8.26-fold higher than in the cinnamon areas. A structural equation model showed that N fertiliser inputs and leaching water amounts explained 14.7 and 81.8% of the variation of leached N loads,respectively. Correspondingly,reducing irrigation water by 21.5% decreased leached N loads by 20.9%,while reducing manure N and chemical N inputs by 22 and 25% decreased leached N loads by only 9.5%. This study highlights that protected vegetable fields dominated by fluvo-aquic soil need management to curtail leached N losses in northern China.
Keywords: agriculture,water quality,nitrate,groundwater,irrigation management
1.Introduction
The total area of protected vegetable fields (PVFs,also termed greenhouse vegetable fields) was approximately 5.6 million ha in 2018 worldwide (Roble 2019),with 4 million ha of PVFs located in China (NCBS 2019).Farmers in China usually apply excessive nitrogen (N)fertiliser and irrigation water on PVFs to obtain high vegetable yields and corresponding economic benefits when compared with upland crops or rice cultivation (Wanget al.2019). For example,the annual N fertiliser and irrigation rate for the protected vegetable production is approximately 400–600 kg N ha–1and 300–500 mm yr–1,respectively,in central Europe (Rodríguezet al.2020),while the annual N fertiliser and irrigation rate commonly exceed 1,500 kg N ha–1and 600 mm yr-1in China (Qasimet al.2021;Zhaoet al.2021). Excessive N fertiliser and irrigation rates lead to serious N losses along hydrologic and gaseous pathways (Lvet al.2019). A recent study indicated that the global mean annual leached N load is 297±22 kg N ha–1when the average N application rate is approximately 1,300 kg N ha–1(Qasimet al.2021).Taking China as an example,Wanget al.(2018) and Zhaoet al.(2021) showed that the mean annual leached N loads from the PVFs varied from 98 to 863 kg N ha–1when the N application increased from 560 to 2,200 kg N ha–1.
In northern China,three soil types (fluvo-aquic soil,cinnamon soil and black soil) are widely distributed. The main areas in northern China that have such soils are as follows: (a) fluvo-aquic soil areas -Shandong and Henan provinces,(b) cinnamon soil areas -Beijing and Tianjin municipalities and Hebei,Shanxi,Shaanxi,Ningxia and Gansu provinces and (c) black soil areas-Heilongjiang,Jilin,Liaoning,Inner Mongolia,Xinjiang and Qinghai provinces. The cropping areas of PVFs in the fluvo-aquic soil,cinnamon soil and black soil areas are 0.57,0.76 and 0.51 million ha,which accounted for 46.1% of the total cropping areas of PVFs in China (Fanet al.2022). Generally,leached N loads in fluvo-aquic soil and cinnamon soil areas are greater than those in black soil areas due to the relatively high N and irrigation inputs in fluvo-aquic soil and cinnamon soil areas (Lianget al.2015;Huanget al.2017;Lvet al.2019;Baiet al.2020).
For N leaching to occur,two factors must exist in the soil: 1) the presence of a nitrate (NO3–) concentration and 2) water movement through the soil column (Fentonet al.2009;Jahangiret al.2012;Clagnanet al.2018).These two factors will differ depending on soil types with heterogeneous N attenuation capacity and different fertilisation and irrigation management imposed within PVFs. For example,Qasimet al.(2021) indicated that the N application rate and soil organic matter (SOM) had positive effects on N leaching in PVFs. However,the N fertiliser application rate was relatively low in fertile soil with high SOM (Huanget al.2017),and this combined effect might result in relatively low N leaching. Thus,the interactive impacts of soil parameters and management regimes on N leaching should receive more detailed attention across different soil types in China. Generally,SOM is higher in the black soil located in northeast China (Wuet al.2020). It is reported that SOM storage benefits total nitrogen (TN) sequestration and improves soil quality (Qiuet al.2016). This study hypothesised that fertile black soil with high SOM has a negative effect on N leaching.
Focusing on China,many studies have set out to identify the optimal reduction rate of N fertiliser and irrigation in PVFs (Li Jet al.2018;Li Yet al.2018;Min and Shi 2018;Wanget al.2018;Sunet al.2019). However,the required reduction rates of N and irrigation varied notably in different areas,covering a wide range of N fertiliser and irrigation inputs and different soil properties.For example,Qasimet al.(2021) suggested that the optimal annual N application rates in PVFs are 500–1,000 kg N ha–1,while Zhaoet al.(2019) demonstrated that N fertiliser application rates exceeding 302 kg N ha–1showed marginal improvement on vegetable yields,but would notably elevate N leaching. In addition,although irrigation and N application rates are both attributable to N leaching,many studies have shown that the irrigation rate is always an immediate cause of N leaching in PVFs (Li Jet al.2018;Li Yet al.2018). Typically,the irrigation water used in the PVFs in northern China is taken from nearby groundwater aquifers and,therefore,already contains high N concentrations from previous leaching events(Fanet al.2014). For example,Hanet al.(2019) and Li Jet al.(2018) suggested that the N dissolved in irrigation water was 97–170 kg N ha–1in fluvo-aquic soil areas.This indicated that the N carried by the irrigation water might move to leachate through the soil column directly.However,the contribution of N sourced from irrigation water to N leaching received less attention in earlier studies. Furthermore,the N accumulation has been relatively high due to the historically excessive N input in PVFs in China,which means a reduction of N input might not reduce N leaching immediately (Minet al.2012;Lianget al.2020). Therefore,we speculate that reducing irrigation inputs is a more efficient way to mitigate future N leaching to groundwater than reducing N fertiliser inputs within PVFs.
This study has three main objectives: (1) estimate the leached N load losses in the PVFs across the main soil types in northern China;(2) understand the predominant factors influencing N leaching in these soil types;and(3) identify optimal N input and irrigation management strategies to achieve both yield and environmental goals in PVFs. To address such knowledge gaps,18 PVF sites in northern China were selected and set up to monitor leached losses at 0.9 m,with leaching data collected and analysed over a 4-year period. The results of this study will help develop best practices in PVFS in northern China and support policy in this regard.
2.Materials and methods
2.1.Field site selection
Generally,the irrigation and N application rates in PVFs of China are usually three times higher than those in crop lands (Kanget al.2018;Wanget al.2019). To estimate the leached N loads in PVFs in northern China,three soil types (fluvo-aquic soil,cinnamon soil and black soil)widely distributed in northern China were selected to install the lysimeter monitoring equipment. According to the US soil taxonomy,these three soils are classified as Inceptisol,Alfisol and Mollisol,respectively. Generally,SOM and bulk density from the highest to the lowest were black soil–cinnamon soil–fluvo-aquic soil (Table 1 and Appendix A). In total,five,nine and four PVFs across the fluvo-aquic soil,cinnamon soil and black soil were selected,respectively,to estimate the leached N loads from different soil types. The precision locations of the 18in-situfiled sites were set out in Appendix A.

Table 1 The mean annual soil organic matter (SOM),soil pH,soil NO3–-N,soil NH4+-N and soil TN contents in the 0–20 cm soil layer in different treatments from 2015–2018 across the fluvo-aquic,cinnamon and black soil of northern China
2.2.Field site experimental design
The 18in-situfield experiments were conducted between 2015–2018. At each site,each treatment was replicated in three field replicate plots. All plots were arranged in a randomised block design. The plot areas at each site are outlined in Appendix B. The experiment on each site consisted of three treatments related to 2 regimes (irrigation and nitrogen): (1) HNHI,a high N and high irrigation input treatment pertaining to conventional practice. The average N application rates(the sum of N from chemical fertilisers and manure) in the HNHI treatment were 1,867,1,634 and 336 kg N ha-1across the fluvo-aquic soil,cinnamon soil and black soil,respectively,in which manure N accounted for 60,47 and 54% of the total N inputs (Table 2). For the N application practices,manure was uniformly spread onto the soil surface and immediately incorporated into the soil (0–20 cm depth) by ploughing before sowing.The chemical fertilisers were applied through irrigation during the growing seasons of vegetables. The irrigation amounts used in the HNHI treatment were 610,671 and 367 mm across the fluvo-aquic soil,cinnamon soil and black soil,respectively (Table 2). (2) LNHI,a low N but high irrigation input treatment. The N inputs were reduced from 5 to 67% in the LNHI treatment compared to the HNHI treatment (Table 2),and results will help ascertain the optimal N application rates across the main soil types in northern China. (3) LNLI,a low N with low irrigation input treatment. The irrigation patterns were changed from flood irrigation to drip irrigation or border irrigation,and irrigation levels were reduced from 15 to 33% compared with the LNHI treatment (Table 3);results will enable the optimal irrigation amount in PVFs to be determined.
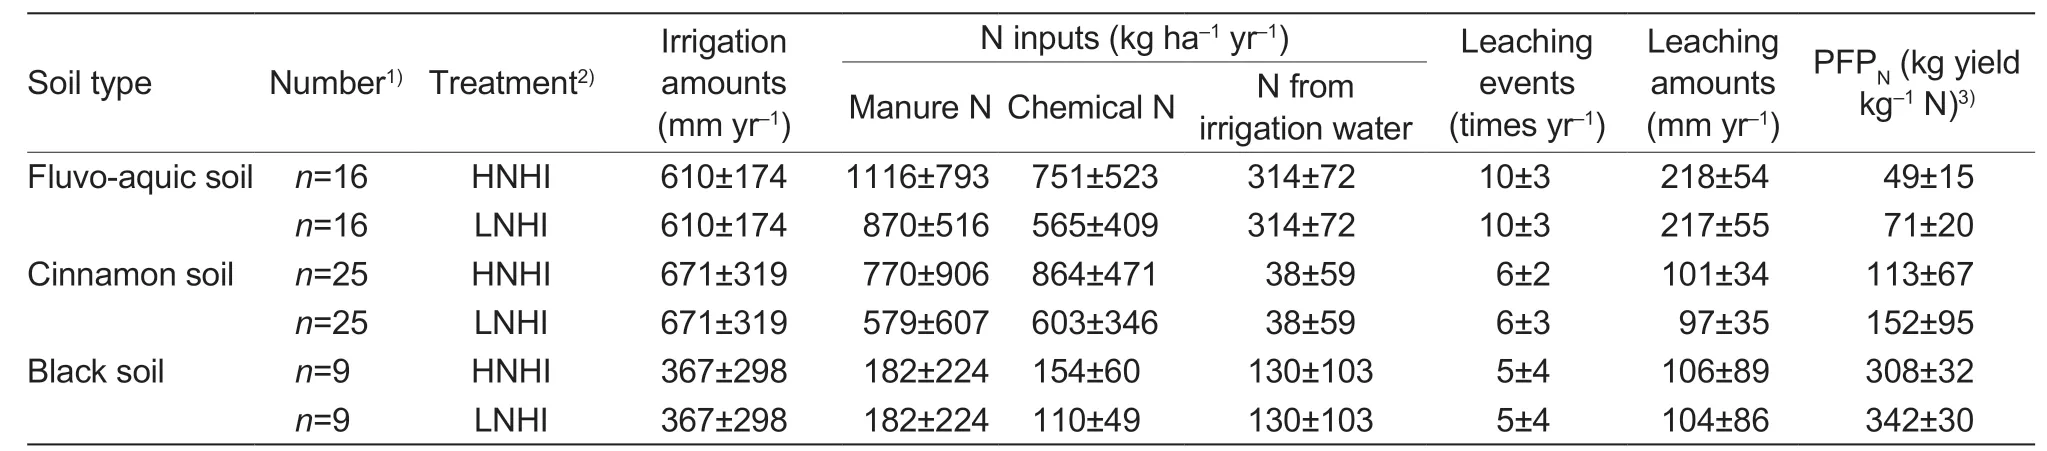
Table 2 The mean annual nitrogen inputs,irrigation amounts,leaching events,leaching amounts and partial factor productivity of applied N in the paired treatments (HNHI vs.LNHI) from the fluvo-aquic,cinnamon and black soil in northern China

Table 3 The mean annual irrigation amounts,leaching events and leaching amounts and irrigation management pattern in the paired treatments (LNHI vs.LNLI) from the fluvo-aquic,cinnamon and black soil of northern China
2.3.Lysimeter installation,leachate collection and measurement
Appendix B outlines the design of the lysimeter monitoring system and the installation of lysimeters in the experimental field. Treatment plots at each location were identified,and lysimeters were installed as follows: soil pits for installing leaching trays were excavated outside at each plot,and rectangular-shaped PVC leaching disks(1.2 m2) were installed tightly into the prepared soil space(Appendix B). In total,162 lysimeters were installed (18 sites×3 treatments at each site×3 replicates for each treatment) to 0.9 m depth underneath the soil surface across the three soil types.
The irrigation amounts were determined,and an irrigation water sample was collected each time during irrigation. Leachate was collected at 0.9 m after 48 h of irrigation and was transferred to a sampling bottle using a vacuum pump (Appendix B). Next,the total volume of the leachate was determined,and a 100 mL sample was brought to the laboratory for further analysis.
The irrigation water and leachate sample filtering through a 0.45 μm filter membrane was used to determine the total dissolved N (TDN),and those without filtering were determined TN concentrations using a potassium persulfate-ultraviolet spectrophotometer (UV-1780,SHIMADZU,China). Another sample of leachate was filtered through a 0.45 μm filter membrane to measure the NO3–-N and NH4+-N concentrations using a continuous flow analyser (AA3,Seal,Germany). The dissolved inorganic N (DIN) concentration was calculated by the sum of NO3–-N and NH4+-N concentration. The dissolved organic N (DON) was calculated by subtracting the DIN from TDN.
2.4.Soil sampling and measurement
After vegetable harvesting every year during 2015–2018,composite soil samples were obtained by mixing three soil cores (0–20 cm) from each plot in the HNHI,LNHI and LNLI treatments at each site. To ensure samples were well mixed and homogeneous,they were ground and sieved through a 2 mm mesh. A fresh soil subsample of 50 g was used to measure the soil NO3–-N and NH4+-N contents. A subsample of 200 g of dried soil where stones and plant residue were first removed was used to measure soil pH,SOM and soil TN.
The fresh subsamples collected every year were extracted with 1 mol L–1KCl by shaking for 1 h at a ratio of 1:10 (dry soil/solution) for 1 h (Kanget al.2018).Afterwards,soil NO3–-N and NH4+-N contents were determined using a continuous flow analyser (AA3,Seal,Germany) (Kanget al.2018). Soil pH was measured in distilled water with a 1:2.5 ratio of soil/solution using a pH meter (MP522 Version 3,SANXIN,China). SOM was determined using the potassium dichromate oxidation method (Skjemstad and Baldock 2007). Soil TN was ascertained using the Kjeldahl method after air drying and through a 0.25 mm sieve (Thomaset al.1967).
2.5.Crop collection and measurement
The vegetable yields in the HNHI,LNHI and LNLI treatments at each site were recorded each season after harvesting. As vegetables were planted 2–3 times in PVFs every year,the annual vegetable yields were calculated by adding up all the seasonal vegetable yields. Additionally,a partial factor productivity of applied N (PFPN) was calculated by dividing annual N fertiliser application rates (kg ha–1) by annual fresh vegetable yields (kg ha–1).
The optimal reduction of N fertiliser and irrigation rates in the LNHI and LNLI treatments were assumed to reduce leached N loads without compromising vegetable yield in comparison with the HNHI treatment. Therefore,a normalised crop yields index,which divided annual vegetable yields in the HNHI treatment by those in the LNHI,was calculated to assess the influence of reduced N fertilisers on vegetable yields. In addition,a normalised crop yields index,which divided annual vegetable yields in the LNHI treatment by those in the LNLI treatment,was calculated to assess the influence of reduced irrigation on vegetable yields. It was postulated here that reducing irrigation or N application rates is acceptable only if the normalised crop yields index exceeds 1.0.
2.6.Estimation of leached N losses
During the period of 2015–2018,146,174 and 44 leaching events occurred at each plot of the HNHI treatment of fluvo-aquic soil,cinnamon soil and black soil,respectively.The leaching amounts and leached N load losses in the HNHI,LNHI and LNLI treatments at each site were calculated according to the following equations:
Leaching volume=Water depth×Leaching tray area (1)where water depth is the depth of leachate collected in leaching trays buried 90 cm deep. Leaching tray area is the superficial area (1.2 m2) of the leaching tray.
Leached N load losses=N concentration×Leaching volume (2)where the leached N load losses include leached TN,TDN,DIN and DON load losses. The leached DIN load losses were calculated by the sum of leached NO3–-N and NH4+-N losses. The leached DON losses were calculated by subtracting the leached DIN from the leached TDN.
The annual leached N load losses in the HNHI,LNHI and LNLI treatments at each site were calculated according to the following equation:
wherenis the annual leaching events at each treatment.
2.7.Statistical analysis
Redundancy analysis (RDA) was used to assess the influence of soil parameters,N fertiliser and irrigation application rates on leached N load losses (vegan package,R 3.6.3) from the fluvo-aquic soil,cinnamon soil and black soil,respectively. ANOVA was used to test the RDA model,and the adjustedR2was calculated to identify parameters that significantly explained the variance of leached N losses. A structural equation model (SEM) was used to assess the influence of parameters on leached TN load losses (lavaan package,R 3.6.3) in the PVFs.The dual reduction of N fertiliser and irrigation rates on the reduction of leached N loads and normalised crop index were depicted using a three-dimensional diagram(scatterplot3d package,R 3.6.3).
3.Results
3.1.Leached N loads from main soil types in northern China
The mean annual leached TN loads from the highest to lowest were fluvo-aquic soil–cinnamon soil–black soil. In detail,the mean annual leached TN loads in the HNHI treatment were 325,114 and 79 kg N ha–1from the fluvoaquic soil,cinnamon soil and black soil,respectively(Fig.1). The mean annual leached DIN loads (sum of NO3–-N and NH4+-N leached losses) in the HNHI treatment were 231,67 and 63 kg N ha–1from the fluvo-aquic soil,cinnamon soil and black soil,respectively,which accounted for 71.0,54.5 and 78.9% of the leached TN loads. In addition,noticeable leached DON loads in the HNHI treatment were also found in the PVFs,which were responsible for 18.8,18.4 and 12.3% of the leached TN loads from the fluvo-aquic soil,cinnamon soil and black soil,respectively (Fig.1).
As the irrigation amounts in the HNHI treatment were equal to those in the LNHI treatment,the leaching amounts and leaching events were almost the same in these two treatments (Table 2). However,the average annual manure N and chemical N inputs in the LNHI treatment were reduced by 22 and 25% in the fluvoaquic soil,by 24 and 30% in the cinnamon soil and by 0 and 29% in the black soil,respectively (Table 2).Correspondingly,the leached TN,DIN and DON loads decreased by 9.5,7.8 and 13.1% in the fluvo-aquic soil,by 12.3,19.4 and 28.6% in the cinnamon soil and by 13.9,14.3 and 20% in the black soil,respectively,when compared with the HNHI treatment (Fig.1). The PFPNin the LNHI treatment was simultaneously increased by 44.9,34.5 and 11% across the fluvo-aquic soil,cinnamon soil and black soil related to those in the HNHI treatment,respectively (Table 2).

Fig. 1 The mean annual total nitrogen (TN),dissolved inorganic nitrogen (DIN,the sum of NO3–-N and NH4+-N) and dissolved organic nitrogen (DON,the difference between total dissolved nitrogen and DIN) leached load losses in the protected vegetable fields across the main soil areas under a high N and high irrigation input treatment (HNHI),a low N and high irrigation input treatment (LNHI) and a low N with low irrigation treatment(LNLI) in northern China. The line and square within the box represent the median and mean values of all data;the bottom and top edges of the box represent 25 and 75% of all data,respectively;the bottom and top bars represent 5 and 95%,respectively. IQR represents the interquartile range. The n represents the number of the leachate samples.
In the LNLI treatment,in addition to the reduction of N fertiliser inputs,the average annual irrigation amounts decreased by 21.5,23.8 and 33.4% across the fluvoaquic soil,cinnamon soil and black soil,respectively(Table 3). As a consequence,the average annual leaching events decreased 2 and 1 times in the fluvoaquic soil and cinnamon soil,respectively. Additionally,the average annual leaching amounts decreased by 54,37 and 28 mm yr–1across the fluvo-aquic soil,cinnamon soil and black soil (Table 3). Correspondingly,the leached TN,DIN and DON loads decreased by 20.9,16.9 and 31.1% in the fluvo-aquic soil,by 31.6,31.3 and 57.1%in the cinnamon soil,and by 27.8,28.6 and 20% in the black soil,respectively,when compared with the HNHI treatment (Fig.1).
3.2.Factors influencing N leaching from different soil types
Results showed that irrigation amounts significantly affected N leaching across all soil types (Fig.2). In the fluvo-aquic soil,soil pH,irrigation amounts and leaching events were significant parameters that influenced N leaching (P<0.05),while SOM and soil NO3-N had no effect on N leaching. It was found that N and irrigation inputs contributed 12.5 (P=0.414) and 51.4% (P=0.001)to the N leaching. In the cinnamon soil,soil pH,soil TN,irrigation amounts and leaching amounts had a significant effect on leached N loads. The irrigation and leaching amounts explained 45.6% of the leached N loads. In the black soil,SOM,N input as well as irrigation amounts statistically influenced N leaching. N inputs and irrigation amounts were responsible for 57.8 and 78.3% of N leaching,respectively. The combined contribution of N and irrigation inputs exceeding 100% was ascribed to the colinear relationship between these two factors.
When assembling the soil parameters,N fertiliser,irrigation inputs and leaching data from the fluvo-aquic soil,cinnamon soil and black soil to perform the structural equation model analysis,similar results of notable effects on TN leaching by N input and leaching amounts were also found (Fig.3). In summary,N inputs and leaching amounts explained 14.7 and 81.8% of the variation of leached TN load losses respectively. In addition,it was found that the higher SOM resulted in lower soil NO3–-N content and leaching amounts (Fig.3).
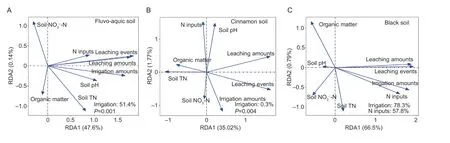
Fig. 2 Redundancy analysis (RDA) highlighting the relationship between soil properties,N inputs,irrigation amounts,leaching amounts,leaching events and leached N load losses in the protected vegetable fields in northern China. Data are sourced from the high N and high irrigation input treatment (HNHI),the low N and high irrigation input treatment (LNHI) and a low N with low irrigation treatment (LNLI) at the fluvo-aquic soil,cinnamon soil and black soil study sites.

Fig. 3 The effects of soil parameters,N fertiliser inputs and leaching data on leached total nitrogen (TN) losses variety during 4 years from 2015 to 2018 (n=58) examined by a structure equation model (SEM). The value above the SEM line represents the path coefficient. The width of the arrow indicates the significance of the standard path coeffcient (*,P<0.05;**,P<0.01;***,P<0.001),and the arrows with red and black indicate positive and negative effects,respectively. Dashed arrows show that coefficients did not differ significantly from zero(P>0.05). Data sourced from the high N and high irrigation input treatment (HNHI),the low N and high irrigation input treatment(LNHI) and the low N with low irrigation treatment (LNLI) at the fluvo-aquic soil,cinnamon soil and black soil study sites.CFI,comparative fit index;RMESA,root mean square error of approximation;SRMR,standardized root mean square residual.
3.3.Reduction of N leaching with reduced N fertiliser and irrigation rates
To further identify the optimal N and irrigation reduction rates to enable vegetable yields and environmental goals to be met,relationships among the reduction of N fertiliser,irrigation rates and the reduction of leached TN load losses and normalised crop yields index were analysed.Results from the HNHIvs.LNHI treatment indicated that the leached TN loads decreased gradually with a decline in N fertiliser input (P=0.07). However,the tendency of the normalised crop yield index also decreased with the reduction of N input (Fig.4). It was noteworthy that the normalised crop yield index was below 1.0 when the reduction of N fertiliser input reached 37%. From a management perspective,a decrease of N fertiliser input by 10 to 35% had a beneficial effect on reducing N leaching without compromising the vegetable yields (Fig.4).
Results from the LNHIvs.LNLI treatment demonstrated that a decrease of irrigation input by 15–30% resulted in a 14–33% reduction of leached TN load losses while slightly increasing crop yields (Fig.5). More importantly,a combination of reducing N fertiliser and irrigation in the LNLI treatment resulted in a decrease of leached TN load losses from 3.2 to 86.5% with little effect on vegetable yields when compared with the HNHI treatment (Appendix C). In contrast to the variation of the crop yields in the LNHI treatment,the normalised crop yield index in the LNLI treatment was higher than 1.0 when N inputs were reduced by more than 37% (Appendix C). However,the optimal reduction of N inputs was recommended to be less than 40% with the aim of obtaining relatively high crop yields (Appendix C).
4.Discussion
4.1.Factors influencing N leaching across the main soil types in northern China
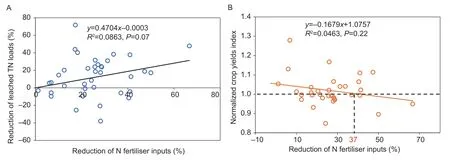
Fig. 4 Relationship between the reduction of N fertiliser inputs and the reduction of leached total nitrogen (TN) load losses (A),and the reduction of N fertiliser inputs and the normalised crop yields index (B). Data were sourced from the high N and high irrigation input treatment (HNHI) and the low N and high irrigation input treatment (LNHI) from the fluvo-aquic soil,cinnamon soil and black soil study sites. The normalised crop yield index was calculated by dividing the annual vegetable yields in the HNHI treatment by those in the LNHI treatment.
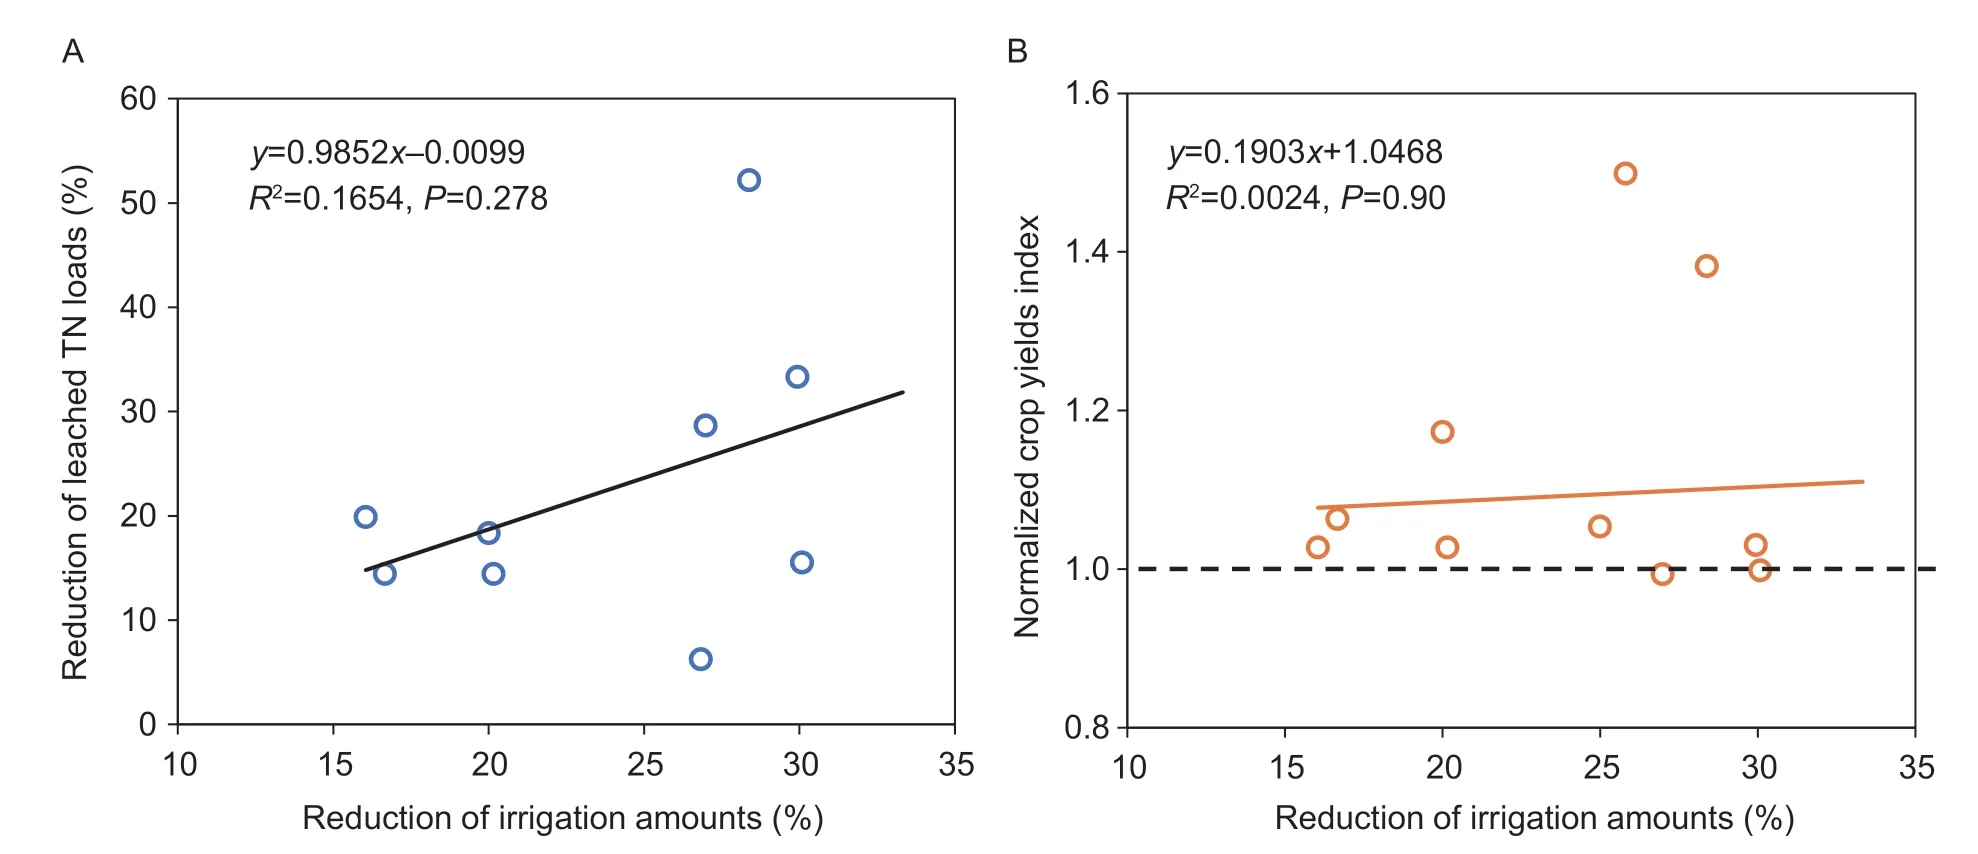
Fig. 5 Relationship between the reduction of irrigation amounts and the reduction of leached TN load losses (A),and the reduction of irrigation amounts and the normalised crop yields index (B). Data were sourced from the low N and high irrigation input treatment(LNHI) and the low N with low irrigation treatment (LNLI) at the fluvo-aquic soil,cinnamon soil and black soil study sites. The normalised crop yield index was calculated by dividing the annual vegetable yields in the LNHI treatment by those in the LNLI treatment.
In the present study,the mean annual leached TN load losses under conventional cultivation practice (denoted as the HNHI treatment) in the fluvo-aquic soil were 325 kg N ha–1(n=48) (Fig.1). This result is similar to the finding of Li Jet al.(2018) which reported the leached TN loads were 344.8 kg N ha–1from a PVFs constructed in the fluvo-aquic soil. In the cinnamon soil and black soil,the mean annual TN leached losses in the HNHI treatment decreased to 114 kg N ha–1(n=75) and 79.3 kg N ha–1(n=27) respectively (Fig.1). In earlier studies,the TN leached losses from the PVFs in the cinnamon soil varied from 75–275 kg N ha–1depending on N fertiliser input and management practices (Li Jet al.2018;Hanet al.2019;Liuet al.2019). The TN leaching in the black soil was the lowest in this study (Fig.1),in line with the results of another study (21.37–89.78 N ha–1leaching losses)conducted in this soil type (Chenet al.2018).
The present study found that N fertiliser and irrigation application rates had notable effects on the TN,DIN and DON leaching (Figs.3 and 4). Therefore,it is unsurprising that N leaching in the black soil was the lowest due to the relatively low N and irrigation application rates compared to the N fertiliser and irrigation inputs in fluvo-aquic soil and cinnamon soil (Tables 2 and 3). Lianget al.(2015)indicated that soil DON accounts for more than 40% of the soil total dissolved N within PVFs,and the leaching of DON should not be ignored when evaluating the risk of N leaching. It is noteworthy that DON was only responsible for 13.5% of the TDN in the black soil,which was lower than those in the fluvo-aquic soil and cinnamon soil(Fig.1). We found that DON leaching increased with an increase in manure N application while the change of DON leaching was marginal with the variation of chemical fertiliser N (Appendix D). Therefore,it can be explained that DON leaching in black soil was relatively low due to the lower manure N inputs (Table 2).
The present study indicated that N leaching was statistically greater in the fluvo-aquic soil than in the cinnamon soil (Fig.1),although the N fertiliser application rates and irrigation amounts were similar in these two soil types (Table 2). The N sourced from the irrigation water in the fluvo-aquic soil (314 kg N ha–1) might be the main reason which exerted N leaching when compared with N originating from irrigation water in the cinnamon soil (38 kg N ha–1) (Table 2). Relative to the N input of 97–170 kg N ha–1carried by the irrigation water reported by Li Jet al.(2018),our result found that N input from irrigation water was underestimated in the fluvo-aquic soil. The present study also demonstrated that leached TN loads increased significantly with an increase in N input from irrigation water (P=0.002) (Appendix D). Thus,we suggested that N carried by the irrigation water should be considered more when evaluating the risk of N leaching. In addition,the relatively higher leaching amount was another reason leading to the increase of leached N loads in the fluvoaquic soil (Table 2). This might be attributed to the relatively low SOM (Table 1) and high sand contents in the fluvo-aquic soil (Li Jet al.2018),which diminished the soil water holding capacity. The redundancy analysis suggested irrigation amounts,leaching amounts and leaching events had positive effects on N leaching in all soil types (Fig.2). As the leaching events and amounts were the highest in fluvo-aquic soil,it was reasonable that N leaching was the highest in this soil type. Therefore,it was postulated here that the fluvo-aquic soil areas should be the key area for the future management of leached N losses in northern China. When considering the effects of soil parameters on N leaching,it was found that SOM had a negative effect on N leaching in the black soil (P<0.05)(Fig.2). The higher SOM in black soil might indirectly reduce the N input and leaching amounts (Fig.3),thus decreasing N leaching (Chenet al.2018). Additionally,a higher SOM storage in black soil areas,increasing soil N immobilisation,could enhance the N fertiliser use efficiency,thus minimising N leached losses (Qiuet al.2016).
4.2.Effects of reduced N and irrigation on leached N load losses
The results of the redundancy and structure equation model analyses using all static and dynamic data across all sites suggested that the effect of the irrigation amounts and the corresponding leaching amounts explained more of the variation of leached N loads than that of N fertiliser input (Figs.3 and 4). Therefore,it can be speculated that the reduction of irrigation amount had a greater impact than the reduction of N input in terms of mitigating leached N losses. Results of this study found that TN leaching increased or decreased with a reduction in N fertiliser input (Fig.4). However,a decrease of irrigation input by 15–30% resulted in a reduction of leached TN loads by 14–33% (Fig.5). The reduction of N input did not quickly reduce N leaching,and this might be because large amounts of fertiliser were still applied in the PVFs. For example,the mean annual N fertiliser input,irrespective of N sourced from irrigation,reached 1,429 and 1,441 kg N ha–1in the fluvo-aquic soil and cinnamon soil,respectively (Table 2). Thus,the N application rates were still extensively higher than the N uptake by vegetables even when the N input was reduced by 50% (Min and Shi 2018). In addition,long-term vegetable production and prolonged excessive N application rates in PVFs have allowed N to accumulate in the soil. Results of Li Jet al.(2018) indicated that one-third of N leaching originated from N fertiliser applied,while two-thirds resulted from the accumulated N in the soil. Therefore,N leaching was not easy to mitigate within a short time frame by simply reducing N inputs in the PVFs (Honget al.2014).
In contrast to the effect of reducing N inputs,the reduction of irrigation was efficient and fast in terms of mitigating N leaching,in line with the results of other studies (Li Yet al.2018;Liuet al.2019). As the leaching amounts contributed 81.8% to TN leaching,the leaching amounts in all soil types were positively decreased with a reduction of irrigation amounts (Table 3). Additionally,N sourced from irrigation was also minimised in the fluvoaquic soil and black soil with the decline of irrigation amounts. Furthermore,a previous study suggested that N leaching through the water travelling to soil was higher under flood irrigation;the change of irrigation patterns from flood irrigation to drip or border irrigation would reduce leaching amounts (Huet al.2021),thus alleviating N leaching. This conclusion is in line with the results found in this study (Table 3).
4.3.Future management in PVFs
In the past four decades,the N fertiliser use efficiency(NUE) decreased to <20% in the protected vegetable production system (Qasimet al.2021). In addition,the overuse of fertilisers,specifically in the PVFs,is threatening the soil and water quality (van Wesenbeecket al.2021). Overuse of N fertilisers in the PVFs of China is a result of the following chain events: (1) During the conversion of arable land into a PVFs system,farmers excavate fertile soil down to 0.5–1 m,and this material is used to build windward walls that enable thermal insulation within the system thereby avoiding the need of additional heating in the winter (Fanet al.2014). As a result,farmers usually apply large amounts of fertilisers to compensate for the losses of nutrients and SOM at the beginning of planting (Baiet al.2020). (2) Smallfolder farms are dominant in China,and the growers of PVFs are usually elderly. In general,they have limited knowledge about precise fertilisation. The high economic benefit from vegetable production,therefore,encourages growers to apply large amounts of fertilisers in an attempt to achieve potentially higher crop yields. (3) Excessive fertilisation limits the development of vegetable roots in PVFs,which in turn hampers the nutrient uptake and inextricably leads to the overuse of N fertiliser to meet the increased nutrient demand of the crop (Huet al.2021). (4)Unlike other parts of the world (e.g.,Europe or the USA),China does not have a common nutrient management planner that enables farmers within different soil–crop systems to apply fertilisers in a way that meets both agronomic and environmental targets (Velthofet al.2014;Baiet al.2018).
To further prevent N leaching from PVFs,other management practices can be implemented within agricultural systems. Previous studies conducted in Europe suggested that the N application rate can be decreased to 430 kg N ha-1yr–1for sweet pepper production (Rodríguezet al.2020) and 310 kg N ha-1yr–1for tomato production (Sotoet al.2015) using the critical N curve (CNC) method which plots total available N (the sum of the soil N at planting,N mineralised from organic material in soil and mineral N fertiliser) against relative yield. Therefore,the CNC method could be implemented for use in the PVFs of China as an optimisation tool to further reduce N supply and N leaching. In addition to N management practice,planting catch crops with deeprooted systems and high nutrient uptake capacity between spring and autumn-winter could mitigate N losses in the leaching pathway in summer (Kanget al.2018).Additionally,it was elucidated that high SOM in the black soil (Table 1) was conducive to reducing N input,probably because higher SOM contents of the soils are associated with more availability of N due to higher biological activity(Liuet al.2021),we,therefore,suggested to increase soil carbon storage such as straw incorporation in the soils of PVFs.
To promote the adoption of best practices as proposed in the present study,policymakers and scientists in China need to work together to develop a cost-effective monitoring and reporting system (Baiet al.2018),in which N application rates and irrigation amounts are recommended based on crop and environment requirements. In addition,a periodical N balance across soil and crop system types in any country but specifically in China should be implemented at key long-term sites to ascertain surplus N being lost to the environment in the context of a changing climate (Sotoet al.2015;Fentonet al.2017). As this study suggested,flood irrigation contributed to more N leaching in northern China. Therefore,a change from flood irrigation to drip irrigation in PVFs is highly recommended,but such a shift in practice will need support from policymakers. In addition,knowledge transfer and training will be needed to aid farmers in adopting this way of farming that places precision at its core.
5.Conclusion
The estimation of annual leached TN load losses in the HNHI treatment across the fluvo-aquic soil,cinnamon soil and black soil was 325,114 and 79 kg N ha–1,respectively,from 2015 to 2018. Although N fertiliser and irrigation inputs significantly affect N leaching,we found that irrigation amounts contributed to much more N leaching than N fertiliser. The high N concentrations in irrigation water and the high accumulation of N in PVFs were the predominant reasons explaining the notable impact of irrigation on N leaching. From a management perspective,combined reductions of N fertiliser (10–35%)and irrigation amounts (15–30%) were suggested to achieve environmental and vegetable yield goals. In addition,reducing irrigation could mitigate N leaching efficiently and quickly. In contrast,the effect of reducing N fertiliser input on N leaching could be seen after a long time.
Acknowledgements
This work was supported by the National Key Research and Development Program of China (2021YFD1700900),the National Natural Science Foundation of China(31972519),the Agricultural Science and Technology Innovation Program of the Chinese Academy of Agricultural Sciences (2060302-05-956-1) and the Project for the Government’s Purchase Service,China(13210186). We thank the Changping Soil Quality National Observation and Research Station,Beijing,China,for supplying the historic dataset from the longterm experiments. Finally,we thank the anonymous reviewers for their valuable comments and suggestions,significantly improving the manuscript.
Declaration of competing interests
The authors declare that they have no conflict of interest.
Appendicesassociated with this paper are available on https://doi.org/10.1016/j.jia.2023.12.019
 Journal of Integrative Agriculture2024年3期
- Journal of Integrative Agriculture的其它文章
- Molecular mechanisms of stress resistance in sorghum: lmplications for crop improvement strategies
- Artificial selection of the Green Revolution gene Semidwarf 1 is implicated in upland rice breeding
- Dynamics and genetic regulation of macronutrient concentrations during grain development in maize
- The NAC transcription factor LuNAC61 negatively regulates fiber development in flax (Linum usitatissimum L.)
- The underlying mechanism of variety–water–nitrogen–stubble damage interactions on yield formation in ratoon rice with low stubble height under mechanized harvesting
- Rice canopy temperature is affected by nitrogen fertilizer