
Airfoil friction drag reduction based on grid-type and super-dense array plasma actuators
2024-03-19 02:37ZiqiFANG方子淇HaohuaZONG宗豪华YunWU吴云HuaLIANG梁华andZhiSU苏志
Plasma Science and Technology 2024年2期
Ziqi FANG (方子淇),Haohua ZONG (宗豪华),Yun WU (吴云),Hua LIANG (梁华) and Zhi SU (苏志)
1 School of Aerospace Engineering,Xi’an Jiaotong University,Xi’an 710049,People’s Republic of China
2 School of Mechanical Engineering,Xi’an Jiaotong University,Xi’an 710049,People’s Republic of China
3 National Key Lab of Aerospace Power System and Plasma Technology,Air Force Engineering University,Xi’an 710038,People’s Republic of China
Abstract To improve the cruise flight performance of aircraft,two new configurations of plasma actuators(grid-type and super-dense array) were investigated to reduce the turbulent skin friction drag of a low-speed airfoil.The induced jet characteristics of the two actuators in quiescent air were diagnosed with high-speed particle image velocimetry (PIV),and their drag reduction efficiencies were examined under different operating conditions in a wind tunnel.The results showed that the grid-type plasma actuator was capable of producing a wall-normal jet array(peak magnitude: 1.07 m/s) similar to that generated in a micro-blowing technique,while the superdense array plasma actuator created a wavy wall-parallel jet (magnitude: 0.94 m/s) due to the discrete spanwise electrostatic forces.Under a comparable electrical power consumption level,the super-dense array plasma actuator array significantly outperformed the grid-type configuration,reducing the total airfoil friction drag by approximately 22% at a free-stream velocity of 20 m/s.The magnitude of drag reduction was proportional to the dimensionless jet velocity ratio (r),and a threshold r = 0.014 existed under which little impact on airfoil drag could be discerned.
Keywords: plasma actuator,flow control,drag reduction,airfoil
1.Introduction
With advances in science and technology,the pursuit of faster flight speeds and increased flight range has been a major goal of aircraft design.The flight drag of an aircraft is proportional to its flight speed.The faster an aircraft is,the greater the drag experiences,thus increasing the energy consumption.In the cruise flight phase of large transport aircraft,friction drag accounts for more than 50% of the total drag [1,2].Therefore,reducing friction drag,especially turbulent friction drag,can increase the cruise lift-drag ratio of the aircraft,thereby reducing the engine fuel consumption,increasing the flight range,and reducing energy consumption.Over the last century,a significant number of boundary layer drag reduction technologies have been proposed,which can be divided into two categories: passive and active.Passive flow control methods such as dimples [3]and riblets [4] rely on fixed disturbances,and thus cannot cope with complex incoming flows.In contrast,traditional active control methods,including spanwise wall oscillation[5] and micro-blowing arrays [6],can adapt to the external changes in flow conditions; however,a complex mechanical structure is required,which imposes a weight penalty on aircraft.It is therefore necessary to explore novel drag reduction methods with lower weight penalties and greater flexibility.
Turbulent friction drag reduction using plasma actuators has become a focus of attention in recent studies [7],largely due to their simple structure and fast response.To name a few,Choiet al[8] used multiple asynchronous plasma actuators to create a spanwise traveling wave,achieving a drag reduction magnitude of 45% at a freestream velocity ofU∞=1.75 m/s.Zhenget al[9] showed that a plasma actuation array that stably generates a spanwise jet can reduce the friction drag by 7.4% atU∞= 10.7 m/s.Thomaset al[10] and Duonget al[11,12] devised a spiky pulsed-DC waveform to drive a plasma actuator.As a result,70% friction drag reduction was achieved by both unidirectional and opposed wall plasma jets,at an incoming flow velocity of 17.4 m/s.Jukeset al[13] used a streamwise plasma actuator for flow separation control on the NACA 4418 airfoil,and achieved a maximum 65% reduction of the drag coefficient (total drag) at 5.3 m/s.Although many studies have been published,most were conducted in a flat-plate turbulent boundary layer,at a freestream velocity of less than 10 m/s.For practical applications in aerospace engineering,the impact of the pressure gradient on the authority of plasma actuators in friction drag reduction needs to be validated in airfoil cases.Moreover,the effective velocity range of plasma-based friction drag reduction should also be extended by layout optimization.
In response to these issues,two novel configurations of plasma actuators (grid-type and super-dense array) were proposed in this study to reduce the turbulent friction drag of the NACA0012 airfoil at zero angle of attack.First,the quiescent characteristics of these plasma actuators were diagnosed by high-speed PIV.Then,wake rake measurements of the airfoil were used to obtain the basic trends of drag reduction magnitude with electrical parameters and wind speed.Finally,a brief analysis of the energy saving ratio and plasma jet velocity ratio was conducted.
2.Experimental setup
2.1.Wind tunnel,airfoil model,and plasma actuators
This experiment was conducted in a low-speed closed-loop wind tunnel at the plasma dynamics laboratory.The length,width,and height of the test sections were 3,1.2,and 1 m,respectively.The freestream velocity (denoted asU∞) was adjustable from 5 to 75 m/s,with a typical turbulence level of less than 0.2%.Figure 1 shows a schematic image of the experimental set-up as well as the layout of the plasma actuators.A 20-mm thick splitter plate was mounted in the middle of the test section and kept strictly horizontal,serving as the end-wall plate.To ensure that the flow was symmetric in this short-span airfoil,several measures were adopted during model design.First,the NACA0012 airfoil selected in the experiment was a symmetrical airfoil,and there was no tip vortex generation at zero angle of attack.Second,the chord length of the airfoil wasc= 400 mm,and the span wasl= 440 mm,which was close to the distance between the splitter plate and the top wall of the test section(460 mm,as shown in figure 1(c)),making the gap in between negligible.In this way,the flow around the airfoil was confined to be two-dimensional.The airfoil model was 3D-printed from resin and mounted vertically on the splitter plate,with its angle of attack fixed at zero degree because our prime concern was the airfoil friction drag.A strip of sand paper was pasted 20 mm downstream from the leading edge of the airfoil,to trip the boundary layer into turbulent flow.Plasma actuators manufactured from flexible printing circuit (FPC) were pasted in the middle of the airfoil model,covering a streamwise range of 0.25 <x/c< 1.Limited by the power level of the high-voltage sinusoidal power supply(model: CTP2000K),the total width and length of the plasma actuator sheet were set as 100 mm and 300 mm,respectively.
Two configurations of plasma actuators were tested.The grid-type plasma actuator shown in figure 1(a) was designed to produce an array of wall-normal jets that resembled conventional micro-blowing.Etoet al[14] applied uniform micro-blowing on the Clark-Y airfoil and achieved 40%local friction drag reduction at a wind speed ofU∞= 58 m/s.The dense-array plasma actuator as shown in figure 1(b) was morphologically similar to the spanwise plasma actuator array used in reference [15],although the inner electrode spacing was reduced by a factor of ten fromO(10 mm) toO(1 mm).The rationale behind this is that the viscous length scale of the turbulent boundary layer reduces with increasing Reynolds number.To achieve effective drag reduction at high speeds,the spacing of adjacent plasma jets should shrink accordingly,to maintain approximately ten high speed streaks between them [15-18].In contrast to Shimizuet al[18],the proposed method features a non-overlapping arrangement of high voltage and ground electrodes,without the use of large-area-plate ground electrodes.This design was primarily intended to reduce the parasitic capacitance of the plasma actuators,thereby minimizing the reactive power consumption during the power supply.In figures 1(a) and(b),the upper high voltage electrodes and lower ground electrodes are indicated in red and blue,respectively.For the grid-type plasma actuator,the edge length of the square grid wasL1= 10 mm,and the width of the upper high-voltage electrode wasd1= 1 mm.For the super-dense configuration,the widths of both the high-voltage electrode and ground electrode wered2=L2= 1 mm,and the spanwise spacing between adjacent actuator strips was 3 mm.For both geometrical configurations,the electrodes were etched from a thin layer of copper coating (thickness: 72μm),and a Kapton layer of 180μm in thickness was used as the dielectric material.Using Kapton as the dielectric layer was convenient for rapid processing and manufacturing to verify new configurations and layouts.Kapton is a flexible material that can be easily attached to a curved surface,and its high-voltage insulation capability is outstanding even with a thickness of 100-200μm.However,the durability of plasma actuators made of Kapton layers is unsatisfactory.During plasma discharge,the dielectric material is subjected to strong oxidation and erosion,resulting in degradation of the performance during long-term continuous operation (i.e.,dozens of days) [19].Considering practical engineering applications require the actuator to work for long periods,the dielectric layer material can be replaced by ceramics,mica,Teflon,or polyisobutylene rubber,which are less sensitive to plasma erosion [19-21].

Figure 1.(a) Grid-type actuator,(b) super-dense array actuator,and (c) setup of the airfoil with plasma actuators in the x-z plane of a wind tunnel (not to scale; units in mm).
2.2.Measurement systems
A high-speed PIV system consisting of a high-speed camera(sensor: 1280 × 800 pixels,Phantom-V2512,Vision Research,Wayne,NJ,USA),a high-frequency laser(TABOR-D30,Grace Laser,Beijing,China),and a programmable timing unit (PTU9,LaVision Göttingen,Germany) was deployed to measure the induced flow fields of the two actuators in quiescent air.Accurate time synchronization between PIV acquisition and discharge ignition was realized by a digital delay generator (DG645,Stanford Research Systems,Sunnyvale,CA,USA),which output two signals,one to regulate the unsteady sinusoidal voltage waveforms generated by the power supply,and the other to send trigger signals to the PIV system.Tracer particles were generated by an atomizer with a Laskin nozzle,with a typical particle diameter of approximately 1-2μm.The imaged field of view of the two actuators was 52.5 × 32.9 mm2(24.41 pixel/mm) and 35.6 × 22.4 mm2(36.07 pixel/mm),respectively.For each of the cases tested,500 image pairs were acquired using the Davis10.2 software (LaVision) at a sampling rate of 200 Hz,and the corresponding instantaneous velocity fields were averaged to obtain the mean jet velocity field.When analyzing the flow field using 500 images,the mean velocity error had converged to the order of 10-6by the 214th image,and the average velocity had reached a stable state by the 400th image.This suggests that using 500 images for a flow field analysis was both a practical and efficient approach in this study.
According to reference [16],the changes in total drag caused by plasma actuation can be attributed to three factors:pressure drag reduction,increased friction drag caused by transition promotion,and turbulent friction drag reduction.In this experiment,the angle of attack of the airfoil was set to zero degree,which meant no separation and no pressure drag reduction.A piece of sandpaper tape was placed at the leading edge of the airfoil to ensure that the transition from laminar to turbulent flow always occurred at the same location.Consequently,transition-related friction drag variations were also excluded,and the sole factor that could cause the total drag variation was turbulent skin friction drag,which can be easily diagnosed by a wake rake.From this perspective,the true purpose of the wake rake was to sense the skin friction drag variation,instead of the exact value of skin friction drag.The wake rake was placed at one chord length downstream of the airfoil trailing edge,measuring the wake velocity profile within a spanwise extent of approximately 100 mm,as shown in figure 1(c).Total pressure probes with a diameter of 1 mm were arranged at a spacing of 6 mm,and each of them was connected to a differential pressure transducer (HSTL-FYDX01,range: 1 kPa;measurement accuracy: 0.1%).The output voltages of the transducers were read by a data acquisition card (NI USB 6211) and a LabVIEW program was used to calculate the total drag coefficient (Cd),as follows [22]:
where,Dis the total airfoil drag;ρis the air density;U∞is the incoming flow velocity;U(y) is the wake velocity; andy1andy2are the upper and lower boundaries of the wake,respectively.In each measurement,the wake pressure was sampled at a frequency of 1000 Hz for 5 s,resulting in 5000 data points.Two sets of repeated measurements were obtained for each state.Figure 2 shows a representative wake velocity profile atU∞= 30 m/s,where the horizontal axis represents the 16 wake rakes,and the normalized velocities of the experimental data before and after excitation are denoted by the blue circle and red triangle,respectively.The velocity was normalized in the experimental data before and after actuation.A Gaussian curve was fitted using the experimental data points to obtain a more accurate calculation of drag.Following the law of measurement error propagation,the relative measurement error of the wake velocity caused by pressure measurement uncertainty was estimated to be 0.54%,at a typical freestream velocity of 20 m/s.
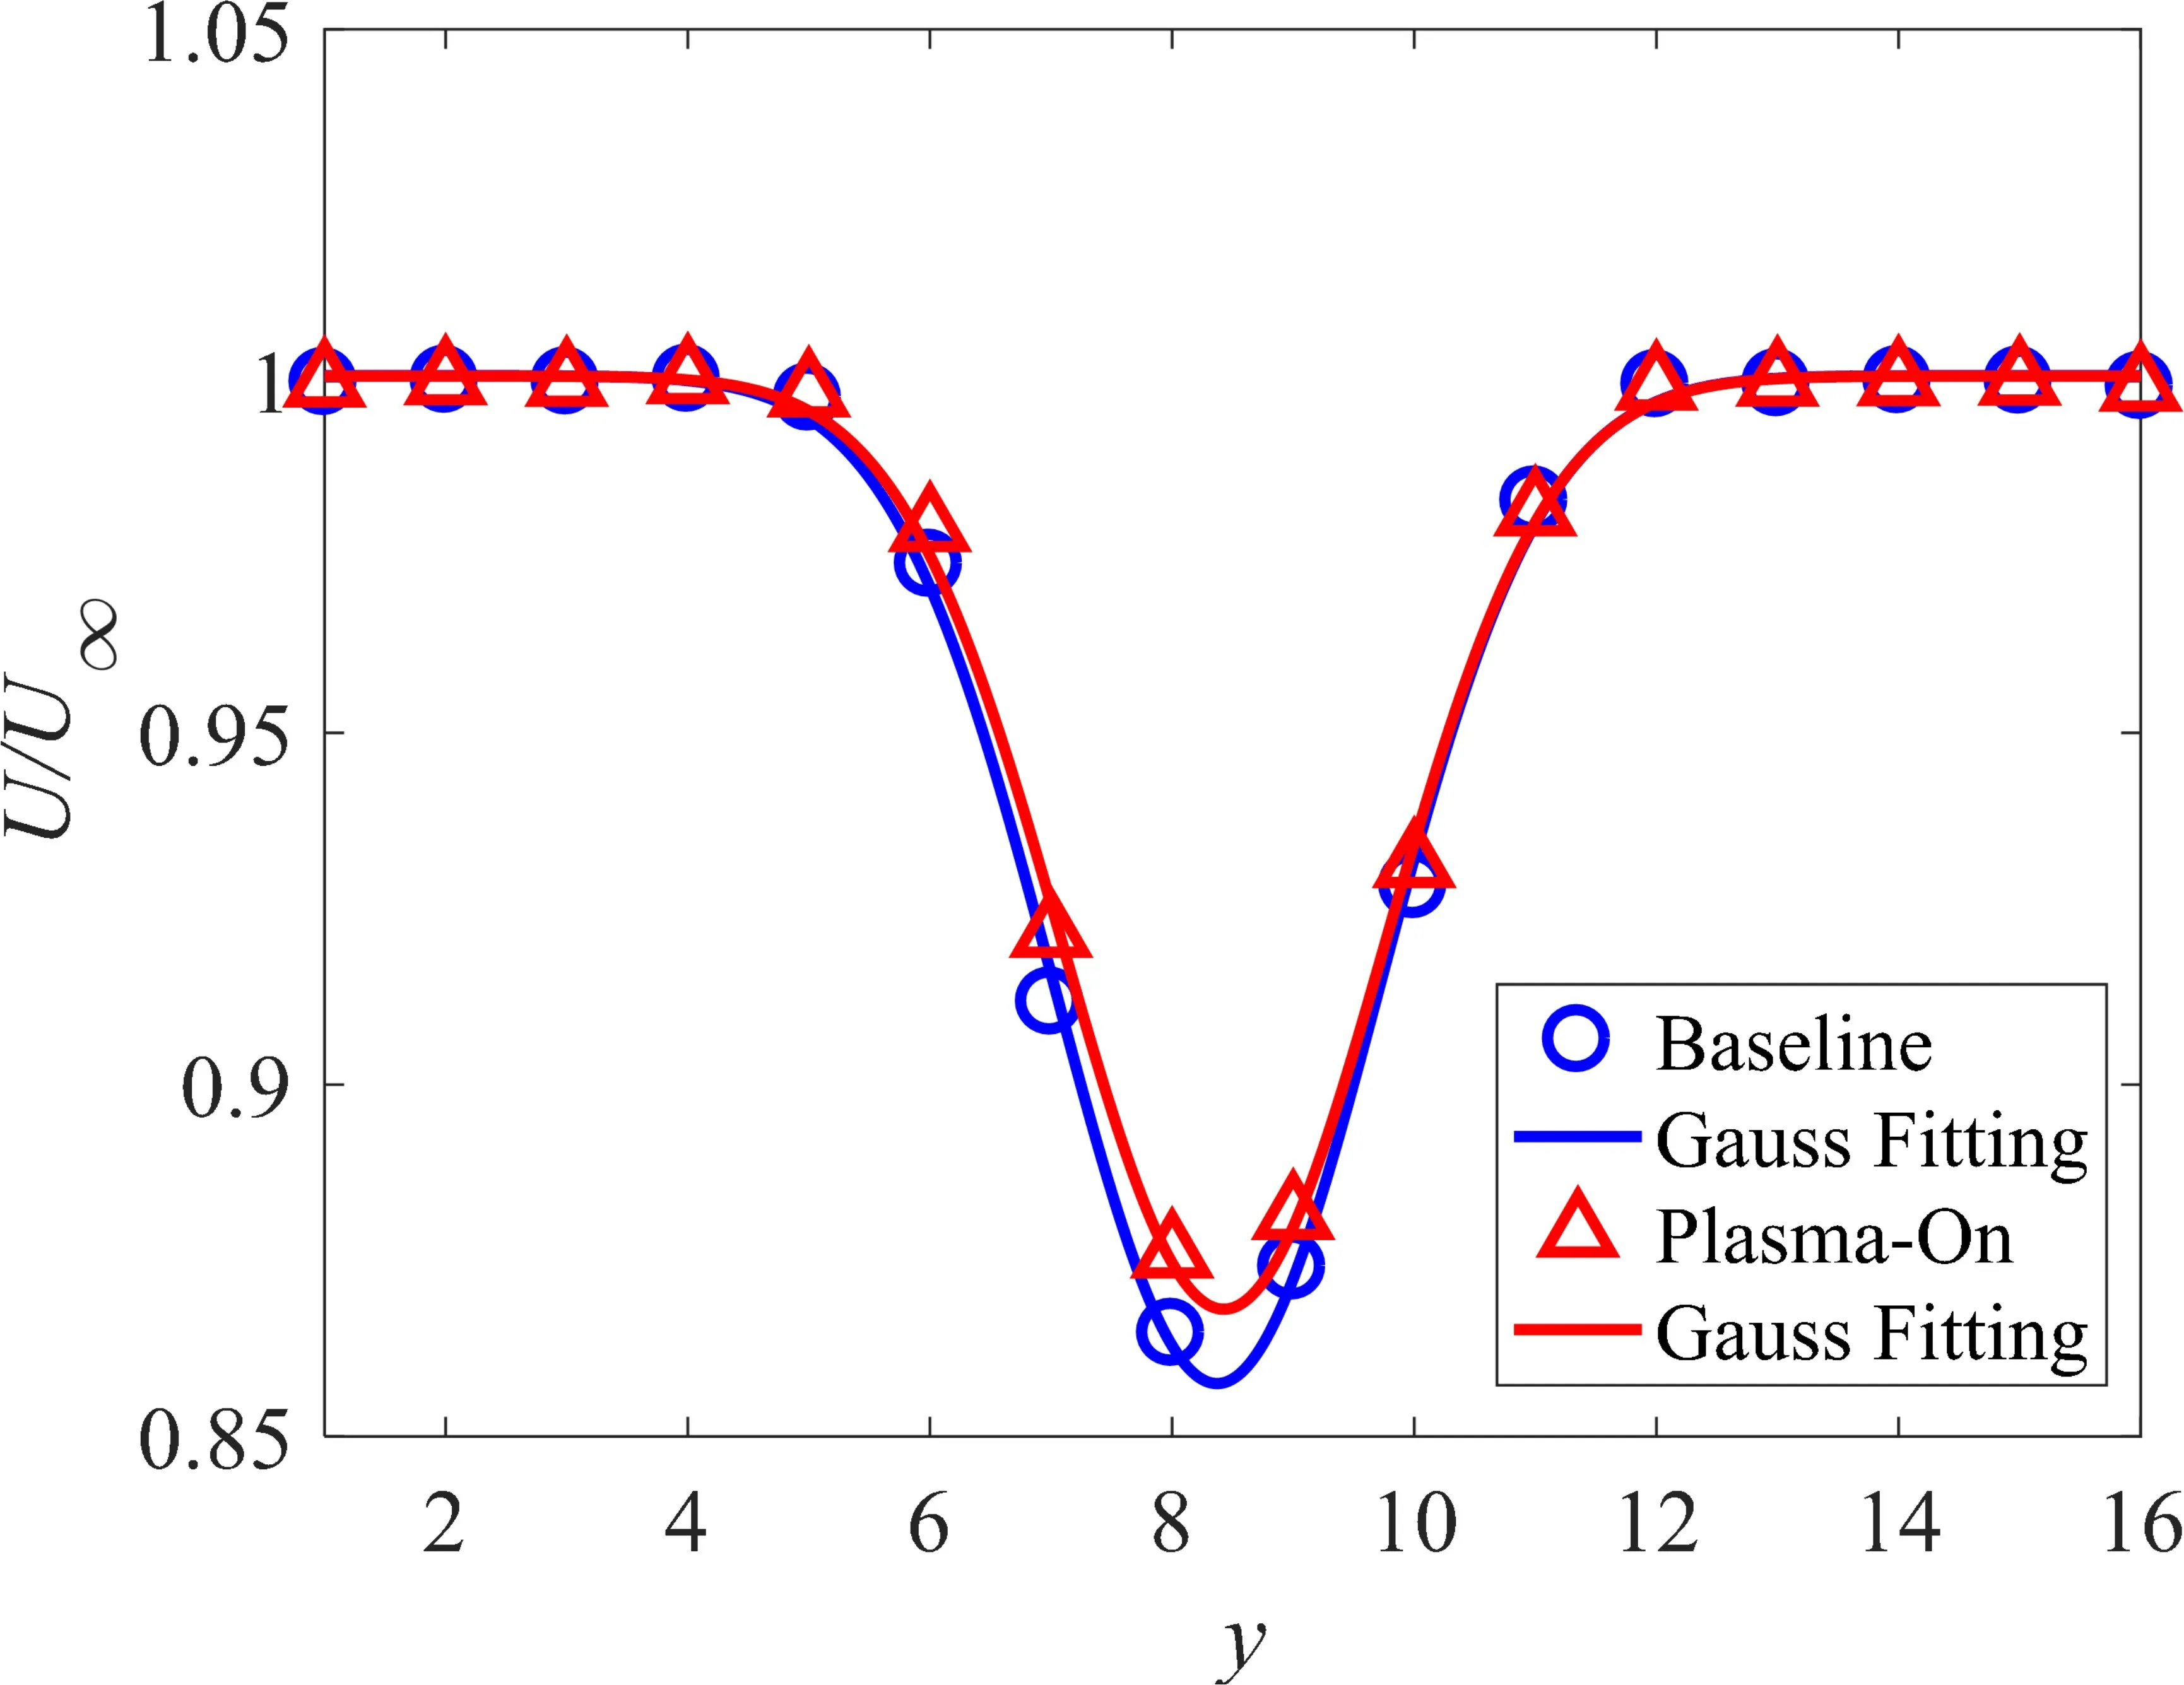
Figure 2.Wake velocity profile of an airfoil at zero angle of attack.
To reduce the impact of electromagnetic interference generated by the plasma actuators on measurements,the following two actions were taken in the experiment.First,the measurement equipment and associated signal cables were wrapped in a layer of fine copper mesh and grounded to create a Faraday cage,which effectively isolated the electromagnetic interference from outside the cage.Second,an isolation transformer was used to separate the power supply of the high-voltage plasma generator and measurement equipment,preventing the possible propagation of electromagnetic interference through direct electrical connections.
3.Results and discussion
3.1.Plasma actuator characterization in quiescent air
For plasma actuators driven by an unsteady sinusoidal waveform,several electrical parameters can be adjusted: actuator discharge voltage (peak-to-peak value:Up-p),base waveform frequency (Fb),modulation frequency (Fm),and duty cycle(Dc).The base waveform frequencyFbwas fixed to 6.6 kHz in this study to ensure an impedance match between the plasma actuator and its power supply [23].The modulation frequencyFmand duty cycle Dc were set to 100 Hz and 50%,respectively (i.e.,unsteady mode).Compared with continuous operation,this unsteady periodical operation slowed the aging process of the dialectical material in the erosive plasma environment and therefore prolonged the lift span of the plasma actuator.Additionally,theUp-pwas tuned by changing the input voltage of the feeding power supply(denoted byUI,range: 0-250 V).Since the equivalent electrical load of the plasma actuator was strongly dependent on its electrode configuration,the maximum discharge voltage that could be realized by the power supply differed between grid-type and super-dense array plasma actuators.This point was reiterated in later results.
Figure 3 shows the representative discharge voltage and current waveforms for the grid-type plasma actuator,measured by an oscilloscope (MDO3014,Tektronix,Beaverton,OR,USA),a high-voltage probe (P6015A,Tektronix),and a current monitor (P6022,Tektronix).When the power input voltageUIwas 50 V,theUp-pof the grid-type plasma actuator reached 4.5 kV,and the maximum current peak-topeak value was approximately 360 mA.As shown in the inset of figure 3,during a sinusoidal voltage period,numerous current spikes were observed at the rising edge.This phenomenon was caused by the streamer discharge after air breakdown [24-27].Due to the effect of a dielectric barrier,the free increase of the discharge current was limited,and the current was converted into a large number of fast pulse current filament microdischarges.Using equation (3),the mean electrical power consumption (Pa) of the plasma actuator was estimated to be 14.7 W by integrating the discharge voltage and current waveforms shown in figure 3:

Figure 3.Discharge waveforms for the grid-type plasma actuator.
where,Tis the discharge period (i.e.,1/Fm); andU(t) andI(t)are the instantaneous voltage and current signals measured by a high-voltage probe and current monitor.
The discharge waveforms of the plasma actuators were measured at increasing levels of input voltage for the power supply (UI),based on which the corresponding peak-to-peak voltage amplitude (Up-p) and electrical power consumption of the two actuators were calculated.These results are plotted in figures 4(a) and (b).Figure 4(a) shows that when theUIvaried between 75 and 250 V,the peak-to-peak voltage of the grid-type plasma actuator only increased from 6 to 8 kV,whilst the super-dense array plasma actuator increased from 8 to more than 14 kV.A further increase in the input voltage of the power supply could boost the maximum voltage of the super-dense array plasma actuator to an even higher level.However,because the dielectric layer of the actuator was only 180μm Kapton,these tests were not performed to prevent breakdown of the plasma actuator.
Comparing the two trends shown in figure 4(a),the main reason for the different discharge voltage range ofUp-punder the sameUIwas the different parasitic capacitance of the two plasma actuators.Specifically,as shown in figure 1,the anode of the grid-type actuator was composed of many horizontal and vertical strip electrodes combined into a mesh,and its total length reached 4654 mm,while the super-dense array plasma actuator had only horizontal strips of electrodes with an equivalent length of 4160 mm.Moreover,for the grid-type actuator,the lower ground electrode patches had to be inter-connected through short edges,inevitably leading to a large overlapping area between the anode and the ground electrode.This eventually led to a large parasitic capacitance of the grid-type plasma actuator.From an electrical engineering perspective,there was an optimal matching frequency (resonant frequency) between the power supply and the actuator,and excessive capacitance would cause the working conditions to deviate from the optimal balance point,resulting in a lower outputUp-pof the gridtype actuator.Therefore,as shown in figure 4(b),whenUI=125 V,the super-dense array actuator clearly had a better impedance match,with a higher power output level of 54.3 W than the grid-type actuator (23.7 W).Based on this power consumption and the total length of the anode,the corresponding power densities were estimated to be 4.9 and 13.1 W/m,for the grid-type and super-dense array plasma actuators,respectively.A similar result was also obtained by Saitoet al[27],which showed that the power density of a single plasma actuator (super-dense array actuator) was higher than that of a facing plasma actuator (grid-type actuator).

Figure 4.Variation of electrical characteristics with power input voltage for grid-type and super-dense array plasma actuators: (a)actuator voltage amplitude,and (b) electrical power consumption.
Figure 5 shows the discharge photos of the two plasma actuators.They were taken by a camera (exposure time: 1/17 s,EOS RP,Canon,Tokyo,Japan) in a dark environment.Both plasma actuators were operated atUp-p= 8 kV.As a result,in both cases,the discharge had a uniform diffused pattern.The plasma was mainly generated at the interfaces between the upper anodes and lower ground electrodes,where a strong electrical field was generated.By visual inspection,the length of the plasma discharge zone for the grid-type and super-dense array actuators was approximately 2.2 and 1.5 mm,respectively.These zones can be roughly treated as electrostatic force zones.
Figure 6 shows the time-averaged velocity fields induced by a grid-type plasma actuator at increasing discharge voltages.In the middle plane of each grid,a vertical jet column was induced by the opposing near-wall body force,and the overall flow structure was similar to that of micro-blowing.According to figure 6,the vertical component of the jet flow velocityUycan be extracted along the green dashed line atz= 0 mm (jet centerline).The variations ofUywith respect to theycoordinate are plotted in figure 7 for the three cases.Within the range ofy= 0-5 mm,Uygradually increased due to the impinging and bending of wall-parallel jets.During the subsequent evolution,the vertical jet velocity started to decay because the surrounding fluids were entrained to the jet core.The above trends were also valid for conventional synthetic jets induced by piezoelectric membranes.An intercase comparison indicated that the magnitude of the vertical jet velocity increased monotonically with discharge voltage.For the three tested voltages,the maximum vertical velocities of the induced jet were observed to be 0.33 m/s (Up-p=6 kV),0.64 m/s (Up-p= 7 kV),and 1.07 m/s (Up-p= 8 kV).The penetration distance of the jet along the normal direction was about 15 mm.
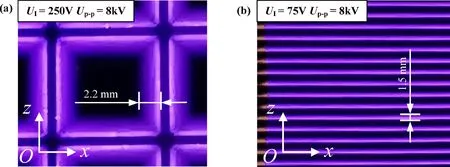
Figure 5.Discharge photos of (a) grid-type plasma actuator and (b) super-dense array plasma actuator (not to scale).The measurement plane was aligned with the x-z plane shown in figure 1.

Figure 6.Time-averaged velocity fields induced by the grid-type plasma actuator at increasing discharge voltages.The red and black rectangles indicate the positions of anodes and cathodes of the actuator,respectively.The measurement plane was aligned with the y-z plane shown in figure 1.
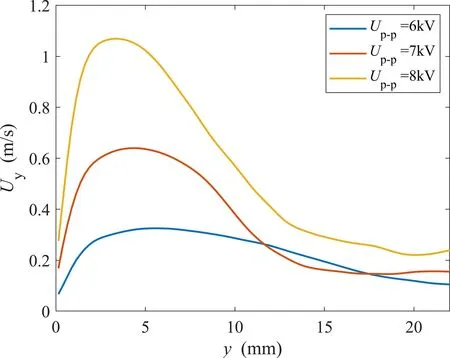
Figure 7.Variation of the vertical component of the plasma jet velocity along the centerline of z = 0 mm for the grid-type plasma actuator.

Figure 8.Time-averaged velocity fields induced by the super-dense array plasma actuator at increasing discharge voltages.The figure is plotted in the style of figure 6.
Figure 8 shows the time-averaged velocity fields induced by the super-dense array plasma actuator at increasing discharge voltages.In the super-dense configuration,multiple independent leftward wall jets were created at low discharge voltages ofUp-p< 11 kV.In contrast,for cases ofUp-p≥12 kV,the jet fluids were relayed from left to right by the discrete patches of wall body forces,with increasing wall jet velocities along thezdirection.At the highest voltage ofUp-p= 14 kV,the four wall jets induced by actuators located atz> 7 mm merged into a single continuous jet,and the maximum jet velocity reached 0.94 m/s.This phenomenon could be explained by the fact that when the discharge voltage increased,the spanwise extent of the plasma-induced body force also increased.At the highest discharge voltage,the extent of this spanwise body force became close to (or even exceeded) the spacing of the adjacent actuator strips in the super-dense configuration.As a result,the initial discrete body force patches coalesced with each other,driving the nearwall fluids to accelerate in an almost continuous fashion.

Figure 9.Variation of the horizontal component of the plasma jet velocity at a fixed height of y = 0.5 mm for a super-dense array plasma actuator.
Based on the mean velocity fields measured atUp-p=12 kV,the velocity variations of the horizontal and vertical components of the induced jet along the green dotted line(y= 0.5 mm) were extracted,as shown in figure 9.As a result,the changes in the development of the jet along thezdirection could be more intuitively observed.The horizontal component velocityUzgradually increased from 0.06 to 0.57 m/s due to the relay effect between adjacent actuators.The vertical component velocityUyoscillates back and forth with an amplitude of about 0.15 m/s,presenting an arched jet in figure 8.This vertical velocity amplitude was only one quarter of the peak horizontal velocity.It was inferred that the main reason for the jet to present an arch shape was due to the small inter-group spacing (3 mm),which resulted in a negative electric field between the ground electrode of the current plasma actuator and the anode of the next plasma actuator.Consequently,a reverse jet flow was created just above the lower ground electrode,and the main jet was forced to lift up,forming an arched jet body.Based on this analysis,it was conjectured that although the strength of the reverse jet flow was much weaker than that of the main jet,its impact on the evolution of the wall plasma jet was nonnegligible.
3.2.Drag reduction results
The impacts of discharge voltage and wind speed on drag reduction effectiveness were explored.Based on the airfoil drag coefficients measured by the wake rake,the magnitude of drag reduction (DR) in different cases was calculated by the following equation:
where,Cd,baselineandCd,plasmarepresent the drag coefficients in the baseline and actuation states,respectively.
Figure 10(a) shows the drag reduction results of the gridtype plasma actuator at increasing wind speeds.UIandUp-pwere fixed to 250 V and 8 kV,respectively.The error bars represent the standard deviation of the two measurements.In cases ofU∞≤ 10 m/s,the airfoil drag was increased by plasma actuation.The lower the wind speed,the more obvious the effect of increasing drag.In comparison,airfoil drag reduction could only be achieved by grid-type plasma actuation atU∞≤ 12 m/s.The maximum drag reduction (2.8%)was reached at 15 m/s.Beyond this velocity,drag reduction decreased asymptotically toward zero with increasing freestream velocity.To some extent this was expected because the ratio of the vertical plasma jet velocity to the incoming wind speed decreased monotonically.Figure 10(b)shows the drag reduction results pertaining to the superdense array actuator configuration.UIandUp-pwere fixed to 200 V and 13.2 kV,respectively.The overall variations of drag reduction were similar to that shown in figure 5(a),with a noticeable drag increase at 8 m/s ≤U∞≤ 10 m/s and a favorable drag reduction atU∞≥ 12 m/s.It was also found that drag reduction decreased asymptotically toward zero at higher wind speeds,and the magnitude was higher than that of the grid-type actuator.Additionally,an abnormal drag reduction (as high as 8.8%) was exhibited at a freestream velocity of 5 m/s.This was presumably due to the low Reynolds number effect,where the airfoil boundary layer was not fully tripped to turbulent flow by the sandpaper tape.Based on the induced jet results in figure 8 and the distribution of the turbulent boundary layer at different wind speeds,the friction velocityandy+=uτy/ν could be estimated [28],whereνis the viscosity coefficient.The results indicated that the induced jet generated by the super-dense array actuator was located within the buffer layer of the turbulent boundary layer forU∞< 30 m/s,which was consistent with the recommended control region (y+≈ 30)by Yaoet al[29].This may explain why the super-dense array actuator was better than the grid-type actuator in terms of the drag reduction effect.In future studies,detailed boundary layer diagnostics based on high-resolution experimental techniques will be used to reveal these mechanisms.
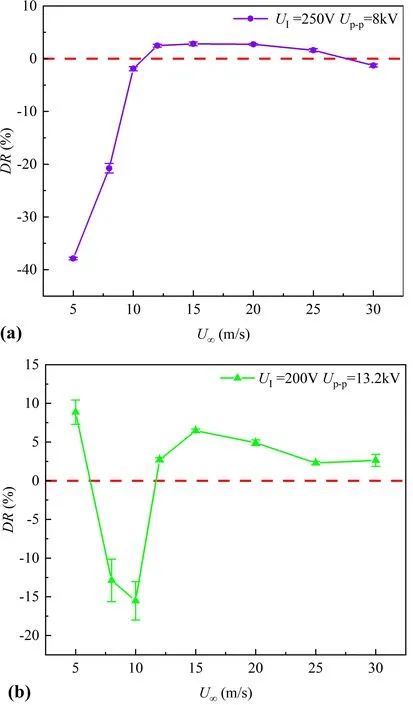
Figure 10.Variation of drag reduction at different wind speeds: (a)grid-type actuator and (b) super-dense array actuator.
Because the super-dense array configuration delivered a higher drag reduction than the grid-type configuration,it was the focus of subsequent parametric studies.Figure 11 shows the variation of drag reduction with voltage amplitude in the super-dense configuration.Two representative wind speeds were selected:U∞= 20 m/s andU∞= 30 m/s.It was evident that as the discharge voltage increased,the magnitude of drag reduction increased monotonically,regardless of the incoming wind speed.There was an inflection point atUp-p=10 kV,beyond which drag reduction rapidly increased.Physically,this trend could be explained by the fact that the spanwise jet velocity induced by the plasma actuator increased with discharge voltage,and atUp-p> 10 kV,the relay effect of the adjacent plasma actuator further boosted the jet strength (see figure 8),resulting in a rapid increase in the actuator efficacy in drag reduction.The maximum drag reduction magnitude reached 22% atU∞= 20 m/s and about 7% atU∞= 30 m/s.To the best of our knowledge,this is the first study to report a noticeable friction drag reduction on an airfoil using plasma actuator arrays.
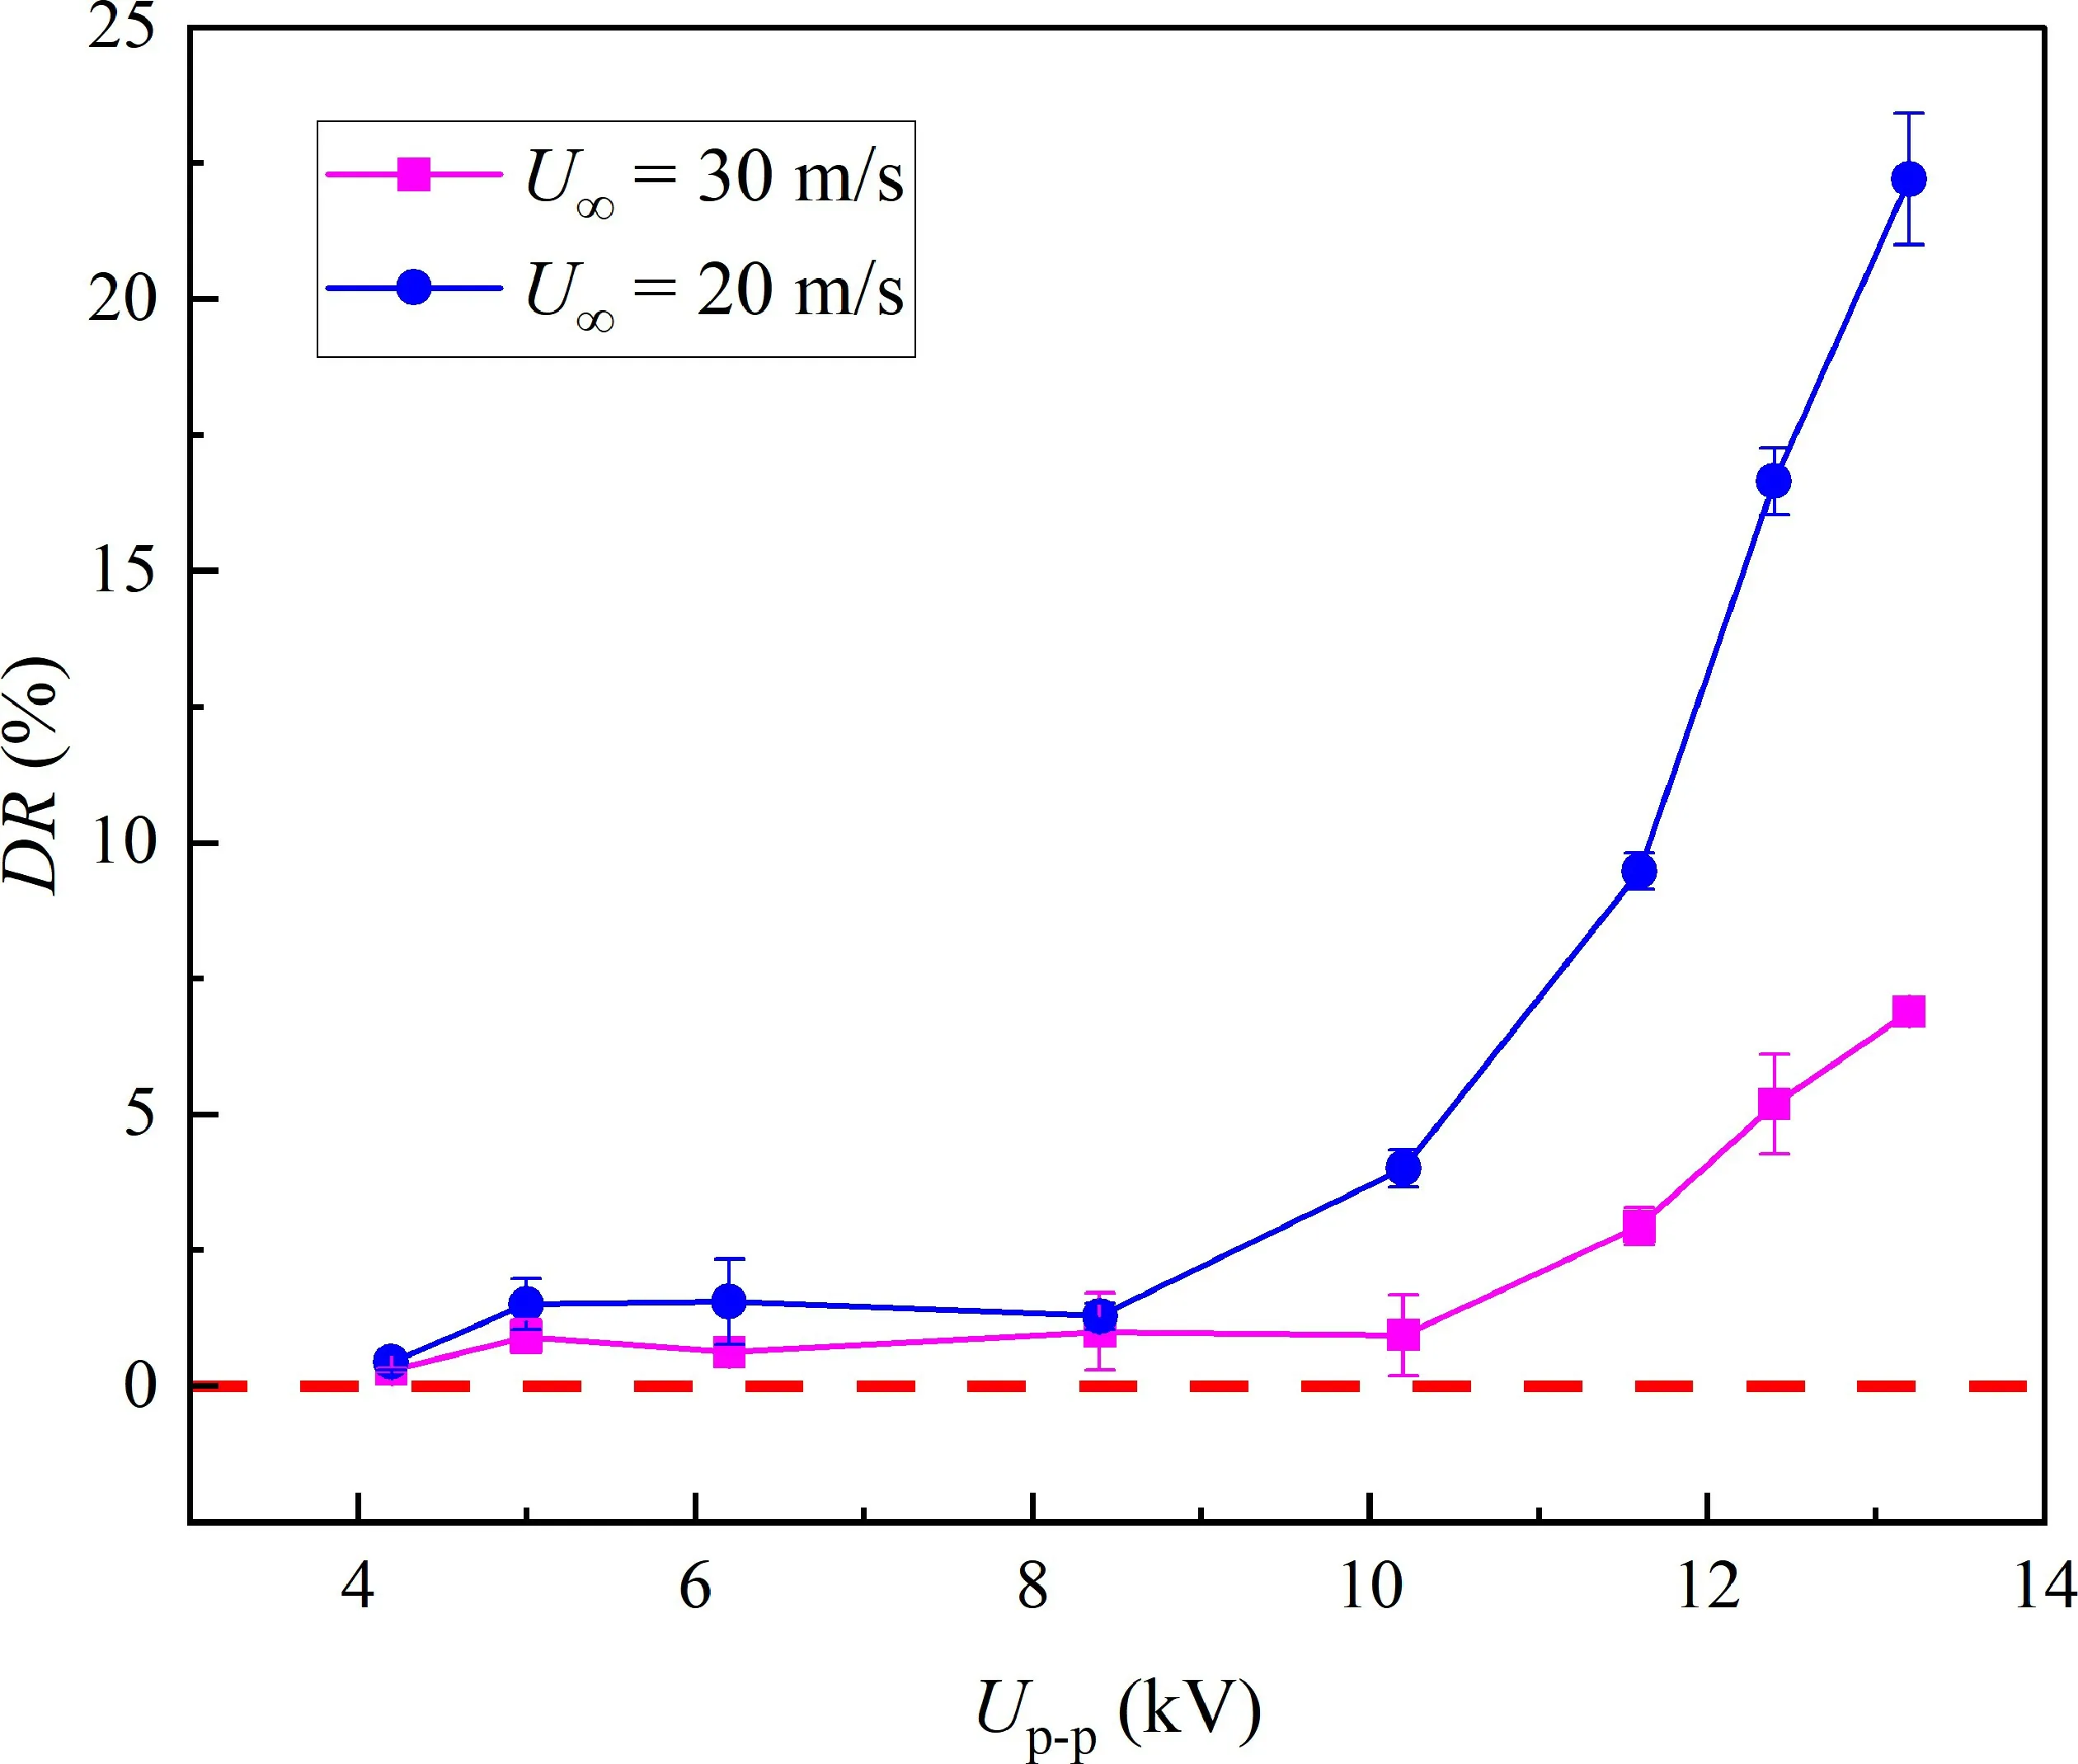
Figure 11.Variation of drag reduction at different voltages and wind speeds.
3.3.Analysis of the control effect
Based on the previous results,the ratio of the plasma jet velocity to freestream wind velocity was used as a dimensionless metric,quantifying the relative strength of the plasma jet as follows:
where,Ujis the maximum velocity of the jet,which was available from PIV measurements.Figure 12 replots the drag reduction curves shown in figure 11 as a function of the dimensionless jet velocity ratio.As a result,whenr≤ 0.014 no noticeable drag reduction was achieved.Because the viscous velocity scale of the turbulent boundary layer was approximately (0.03-0.05)U∞,a plasma jet velocity < 0.014U∞would be too weak to generate substantial changes to the high and low speed streaks [16].Consequently,plasma jets were submerged in the near-wall random velocity fluctuations and failed to achieve any drag reduction.In contrast,whenr> 0.014 there was a noticeable increase in the drag reduction with dimensionless jet velocity.
The energy saving ratio (η) of the plasma actuators was defined as follows [30]:

Figure 12.Variation of drag reduction with the jet velocity ratio.
where,Pais the power consumed by the plasma actuator in equation (3); andDbaselineandDplasmarepresent the drag in the baseline and actuation states from equation (1),respectively.As shown in figure 13,the energy saving ratio first increased and then decreased with discharge voltage,reaching a maximum of 0.07 atUp-p= 4.2 kV.The energy saving rate displayed an upward trend under different wind speeds,reaching a maximum of 0.02 atU∞= 30 m/s.Sinceηwas less than 1,no net power saving was achieved.However,it is worth noting that the energy saving ratios reported in this study (O(0.01)) were already four orders of magnitude higher than that in [31],in which drag reduction experiments were performed at freestream velocities as low as 2-5 m/s.In future studies,after further optimization of the actuator layout and waveforms,it may be possible to achieve a net power saving at high wind speeds.
3.4.Discussion on control mechanisms
There were numerous high and low speed strip structures in the turbulent boundary layer,which were randomly distributed and were accompanied by various sweep and ejection behaviors that promoted the generation of streamwise vortices.The strip structure and streamwise vortex complemented each other,resulting in a higher friction drag.By controlling or stabilizing the strip structure and inhibiting the formation of quasi-streamwise vortices,it was possible to achieve turbulent drag reduction [32-34].With consideration of the grid-type and super-dense array actuator PIV results,the control mechanism of plasma actuation was determined and shown in figure 14.
The grid-type actuator was initially designed to induce a wall-normal jet in the form of micro-blowing,and its drag reduction control mechanism was similar.Previous studies[35,36] have demonstrated that the streamwise vortex structure in the near-wall region is carried away from the downstream region of the blowing control.This directly hinders the sweeping motion of the strong vortex,resulting in a significant reduction in skin friction.Similarly,figure 14(a)shows that the grid-type actuator formed a complete blowing surface after actuation,lifting the fluid structure near the wall,and therefore reducing its interaction with the wall.The wall-normal blowing surface disrupted the near-wall vortex structure and inhibited the transient growth of streaks,thereby suppressing the generation of near-wall turbulence and reducing frictional drag.
The super-dense array actuator induced a spanwise wall jet in the flow field,which then evolved into large-scale streamwise vortices (LSSVs) in the boundary layer.The jet pushed the strip structure in the turbulent boundary layer to move in the spanwise direction.Due to the design of the actuator array,the induced jet was arched,preventing the strip structure from moving in the spanwise direction.As a result,the strip structure was gathered and separated.The jet exerted a similar effect to that of riblets,stabilizing the strip structure and inhibiting the generation of near-wall turbulence and quasi-streamwise vortices,thereby achieving a reduction in turbulent friction drag [37].Due to the close spacing between the electrode groups of the super-dense array actuator,the size of the induced jet matched the scale of the strip structure at high wind speeds.Compared with the large spacing actuator,the small spacing induced jet generated a relay effect,and the “virtual riblet” effect was more stable,which provided a better stability effect for the strip structure.

Figure 14.Plasma actuation control mechanisms: (a) grid-type actuator and (b) super-dense array actuator.
4.Conclusions
Two novel configurations of plasma actuators were used to reduce the turbulent friction drag on an airfoil under different operating conditions.High speed PIV and wake rake measurements showed that the grid-type plasma actuator could induce an array of wall-normal jets,which was similar to micro-blowing from a porous surface,while the superdense array plasma actuator produced a coalesced near-wall accelerating jet.With a spanwise spacing of only 3 mm,the super-dense array actuator was able to deliver 22% drag reduction atU∞= 20 m/s and 7% drag reduction atU∞=30 m/s.A further dimensional analysis indicated that the plasma jet velocity ratio (r) governed the drag reduction magnitude,and the minimum threshold for friction drag reduction wasr= 0.014.Although a promising friction drag reduction was obtained,the net power saving ratio was still less than 0.1,and to achieve a net power gain,the authority of plasma actuators in drag reduction needs to be extended to high-speed flows.
In the next phase of this research,static pressure holes will be strategically arranged on the airfoil’s surface to measure the corresponding pressure drag,enabling a more accurate calculation of frictional drag.Additionally,flow field visualization experiments will be conducted in the airfoil flow field to further clarify and confirm the mechanisms behind plasma turbulent drag reduction control.
Acknowledgments
This research was supported by National Natural Science Foundation of China (Nos.12002384,U2341277,and 52025064) and Foundation Strengthening Program (No.2021-JJ-0786).The authors gratefully acknowledge this support.
猜你喜欢
Plasma Science and Technology(2023年3期)2023-03-15
Plasma Science and Technology(2022年6期)2022-07-13
Plasma Science and Technology(2021年12期)2022-01-10
妇女生活(2020年4期)2020-05-19
知音海外版(上半月)(2019年1期)2019-01-17
特别健康(2018年1期)2018-03-28
电影文学(2017年19期)2017-11-16
健康人生(2016年4期)2016-05-14
中老年健康(2015年4期)2015-05-30
快乐作文·低年级(2015年3期)2015-03-26
 Plasma Science and Technology2024年2期
- Plasma Science and Technology的其它文章
- Phase field model for electric-thermal coupled discharge breakdown of polyimide nanocomposites under high frequency electrical stress
- The characteristics of negative corona discharge and radio interference at different altitudes based on coaxial wire-cylinder gap
- Characteristics of laser-induced breakdown spectroscopy of liquid slag
- Non-thermal atmospheric-pressure positive pulsating corona discharge in degradation of textile dye Reactive Blue 19 enhanced by Bi2O3 catalyst
- Multi-layer phenomena in petawatt laserdriven acceleration of heavy ions
- Experimental study on the effect of H2O and O2 on the degradation of SF6 by pulsed dielectric barrier discharge