
Coupled alkali feldspar dissolution and secondary mineral precipitation in batch systems:5.Results of K-feldspar hydrolysis experiments
2015-02-07 09:08•••
Acta Geochimica 2015年1期
•••
Coupled alkali feldspar dissolution and secondary mineral precipitation in batch systems:5.Results of K-feldspar hydrolysis experiments
Peng Lu•Hiromi Konishi•Eric Oelkers•Chen Zhu
Received:23 December 2014/Revised:26 December 2014/Accepted:26 December 2014/Published online:11 January 2015 ©Science Press,Institute of Geochemistry,CAS and Springer-Verlag Berlin Heidelberg 2015
This paper explores how dissolution and precipitation reactions are coupled in batch reactor experimental systems at elevated temperatures.This is the ffth paper in our series of‘‘Coupled Alkali Feldspar Dissolution and Secondary Mineral Precipitation in Batch Systems.’’In the previous four papers we presented batch experiments of alkali-feldspar hydrolysis and explored the coupling of dissolution and precipitation reactions(Fu et al.in Chem Geol 91:955–964,2009;Zhu and Lu in Geochim Cosmochim Acta 73:3171–3200,2009;Zhu et al.in Geochim Cosmochim Acta 74:3963–3983,2010;Lu et al.in Appl Geochem 30:75–90,2013).Here,we present the results of additional K-rich feldspar hydrolysis experiments at 150°C.Our solution chemistry measurements have constrained feldspar dissolution rates,and our high resolution transmission electron microscopy work has identifed boehmite precipitation.Reaction path modeling of K-feldspar dissolution and boehmite precipitation simulated the coupled reactions,but only with forced changes of boehmite rate law in the middle of experimental duration.The results which are reported in this article lend further support to our hypothesis that slow secondary mineral precipitation explains part of the wellknown apparent discrepancy between lab measured and feld estimated feldspar dissolution rates(Zhu et al.in Water–rock interaction,2004).
Kinetics·Feldspar·Geochemical modeling· Rate law·Water-rock interaction
1 Introduction
The coupling of dissolution reaction and precipitation reactionsmaypartlyexplainthewell-knowndiscrepancy(forthe discrepancy,see Paces 1973;Siegel and Pfannkuch,1984; Velbel 1990;Brantley 1992;Blum and Stillings 1995; DreverandClow1995;WhiteandBrantley2003;Zhu2005) between laboratory measured and feld estimated feldspar dissolutionrates(Zhuetal.2004;Zhu2005;Zhuetal.2006; Ganor et al.2007;Hereford et al.2007;Zhu 2009;Zhu et al. 2010;Lu et al.2013).In fact,the overall dissolution rate of primary feldspar depends on the relative rates of all kinetically controlled reactions in a system(Lasaga 1998).Unlike in the laboratory,feldspar dissolution in natural systems occursinthecontextofareactionnetworkwhichcontrolsthe individualheterogeneousreactions(Zhu2009).Specifcally, the slow precipitation of a secondary mineral result inaccumulation of solutes in the aqueous solution that makes the solution be close to the equilibrium with respect to the primary minerals(increased saturation state),and the diminishing thermodynamic drive near equilibrium result in much reduced rates as compared to the far from equilibrium rates(Zhu et al.2004,2010).
Numerous other hypotheses have also proposed to explain theapparentlab-felddiscrepancy(seeZhu2005forareview). Briefy,the preferential and stagnant fow paths prevalent in feldsystemsleadtoallfeldsamplesasmixedwatersandfeld ratesasamixtureoffastandslowrates(Lietal.2008).Surface reactivity and reactive surface areas may also change significantlyduetotheopeningandcloseofetchpits(Gautieretal. 2001;Beig and Lu¨ttge 2006),secondary mineral coatings on the primary mineral surfaces(Nugent et al.1998;Hellmann etal.2003;Cubilas etal.2005;Zhu etal.2006),or formation of an amorphous layer(Daval et al.2011).
To test our hypothesis,we have conducted a series of experiments of feldspar dissolution and secondary mineral precipitation in batch systems(Fu et al.2009;Zhu and Lu 2009;Zhuetal.2010;Luetal.2013).Sincethesereactionsare too slow to be measured at ambient temperature and circumneutral pH conditions(Ganor et al.2007),the experiments wereconductedat200°Candat300bars.Theseexperiments used perthitic feldspars,and dissolution of albite laminae dominated the experiments while K-rich feldspar laminae weresupersaturated(Fu et al.2009;Zhu and Lu 2009).In the present article we report additional experiments using K-rich feldspars.We also used high resolution transmission electron microscopy(HRTEM)tocharacterizethesecondaryminerals and to attempt to determine whether an amorphous layer has formed on feldspar surfaces.Numerical reaction path modeling simulated the feldspar hydrolysis experiments by matching modeling results with experimental data.
2 Methods
2.1 Starting materials
K-rich feldspar samples were obtained from Wards Scientifc Establishments LLC and consisted of several 1–2 cm twinned crystals.The sample was ground with an agate mortar and pestle and then sieved to obtain the fraction between 50 and 100 μm.The resulting mineral powder was ultrasonically cleaned at least fve times in methanol until the methanol was clear following cleaning(Lu et al.2013). BET surface areas of each powder were measured using nitrogen and krypton prior to the experiments.The resulting surface areas are provided in Table 1.Surface areas were not measured following the experiments.The chemical compositions of these cleaned mineral samples as determined by electron microprobe are listed in Table 1 which yields the chemical formula of K0.82Na0.18Al0.98Si3.015O8which has been calculated following the method of Deer et al.(1992).
2.2 Dissolution experiments
Experiments were performed in a closed-system titanium rocking reactor with a volume of 400 cm3(Gautier et al. 1994;Harouiya and Oelkers 2004).The experiments were initiated by frst placing the powdered feldspar into the reactor,followed bythe fuid.Thereactors were then sealed, placed in a furnace,rocking was initiated,and heated to 150°C.Reactivefuidwassampledirregularlythrougha0.1 micron flter.Sampling thus resulted in a change between fuid/feldspar ratios.The silica concentration of the outlet solution was determined via the molybdate blue method of Koroleff(1976).Aqueous Al concentrations were determinedusingaPerkinElmerZeeman5,000atomicadsorption spectrometer.Outlet solution pH was measured at 25°C using a Metrohm©744 pH meter coupled to a Metrohm©Pt1000/B/2 electrode with a 3 M KCl outer flling solution. TheelectrodewascalibratedwithNBSstandardsatpH4.01, 6.86,andinacidstandardsolutionsatpH1.5and2.5withan average error of less than 0.05 pH units.
Closed-system experiments were performed using the initial solutions comprised of MilliQ®demineralized H2O and reagentgradeKClandHCltoobtainthesolutioncompositions listed in Table 2.Two experiments were performed.Experiment R contained 251.76 g of aqueous solution R and 0.5017 g K-feldspar,and experiment L contains 252.47 g of aqueous solution L and 0.5058 g Alkali-feldspar.The experimentwasstoppedbycoolingthereactorsfrom150°Coverthe course of 18 h.The powder was separated from the reactive solutionbyfltrationusinga0.45microncellouse-nitrateflter. The powder was dried overnight in an oven at 80°C.
2.3 TEM characterization
Atomic scale HRTEM was used to characterize the reactants as well as the products(from reactor R).HRTEM and SAED measurements were done with both a Philips EM 420 and a CM300FEG microscope.Both microscopes operated at 120 and 295 kV,respectively.
Two sample preparation methods were used:ultrasonicate method and ultra-microtomy method.In the ultrasonicate method(Figs.1,2,3),feldspar grains were handpicked under a polarizing microscope.Selected crystals were then immersed in ethanol and ultrasonicated.A drop of the resulting suspension was placed onto lacey-carbon flm supported by a standard Cu TEM grid and air-dried.
Ultra-microtomy was used to make cross sections of the surface of Au-coated K-feldspars.In the ultramicrotomy method(Figs.4,5,6,7,8)feldspar grains were hand-picked under a polarizing microscope.We coatedAu on the K-feldspar grains to mark the crystal surface, embedded in BEEM capsules flled with epoxy resin(EPOFIX),and aged the sample for 1 or 2 days at room temperature.If the resins were not hard enough after treatment,they were then put into an oven for several hours at 80°C.The solidifed samples(with resins)were cut by ultramicrotomy using a Sorvall MT2 microtome and a diamond knife.The resulting sections werecollectedona Cu TEMgrid ora holly carbon flm supported on a Cu grid.

Table 1 Chemical composition of the Alkali-feldspar used in this study

Table 2 Initial solution compositions in the present study

Fig.1 Low magnifcation TEM image of boehmite aggregation. Boehmite crystals are 20–50 nm particles
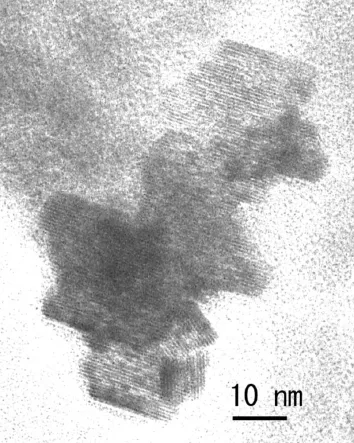
Fig.2 HRTEM image of boehmite particles.Some grains have aligned to make a larger cluster.There are amorphous rims which surround the boehmite crystals,suggesting that they formed directly from aqueous solution.We can infer from this image and the fact that boehmite is loosely attached to the feldspar surface and are easily removed thatthere is no structuralinheritance from feldspar to boehmite such that the boehmite is most likely formed via a dissolution-precipitation process,i.e.feldspar→aqueous components→boehmite
2.4 Standard state thermodynamic data
Inallcalculationsthestandardstatesforsolidsaredefnedas unit activity for pure end-member solids at the temperature andpressureofinterest.ThestandardstateforH2Oistheunit activity of pure water.For aqueous species other than H2O, the standard state is the unit activity of the species in a hypothetical one molal solution referenced to infnite dilution at the temperature and pressure of interest.Equilibrium constants(log K)for reactions were calculated from the standard state thermodynamic properties for mineral endmembers and aqueous species.The values of log K and the sources of thermodynamic properties that were used are listed in Table 4.In all cases,internally consistentthermodynamic properties were used when possible.See Zhu and Lu(2009)for a detailed discussion of the choices regarding standard thermodynamic properties.

Fig.3 ED from an aggregation of particles.Eleven refections match the published data(JCPDS/ICDD fle#83-2384):1 020,2 120,3 031, 4 131,5 051 and 200,6 220,7 151,8 080,9 231 and 002,10 022 and 171,11 251 and 122,indicate that the crystals in Fig.2 are boehmite. The dark spots in the rings or between the rings are likely to be the contamination of feldspar fragments

Fig.4 TEM image of an ultramicrotomy sample(with gold coating) showing the spatial relationship between gold coating and K-feldspar crystal.1 is a void,K-feldspar is labeled as 2,Gold coating layer is labeled as 3,4 is epoxy resin flm

Fig.6 EFTEM fgure(Si map)of Fig.4.Labels 1,2,3,and 4 are the same as in Fig.4.The layer 3 is Al concentrated but Si defcient, which indicates that K-feldspar forms an Al-rich,Si-defcient mineral (boehmite)after dissolution
3 Results and discussion
3.1 Solution chemistry
The evolution of fuid compositions during the experiments islisted as a function oftime in Table 3.Theconcentrations of Si in the fuid phase increased continuously with time.In experiment R,the Al concentrations increased gradually to 221 ppb at 792 h and decreased slightly to 192 ppb at the end of the experiment(1,152 h). In experiment L,the Al concentration increased gradually to 306 ppb at 792 h and decreased slightly to 192 ppb at the end of the reaction(1,152 h).
Numerous studies involving reaction kinetics of silicate minerals have shown that pH plays a particularly important role in the rate of mineral dissolution/precipitation processes(Oelkers et al.1994;Oelkers 2001).Fluid pH in the present study was measured at ambient conditions(25°C, 1 bar)and then re-calculated to experimental conditions (150°C,Psat)by taking an explicit account of the effect of temperature and pressure on the distribution of aqueous species.Accordingly,pH(in situ)was calculated for each sample taken during each experiment(Table 3).For the experiment R,aqueous solution pH increased from 4.05 to 4.79 during the frst 10 days and then remained close to stable during 10–48 days.For experiment L,the aqueous solution pH increased from 3.79 to 5.32 during the frst 10 days,and further increased slightly to 5.71 during days 10–48 Table 4.

Fig.7 HRTEM image of a cross section of the surface of K-feldspar. The amorphous materials have 5–10 nm width.They may be formed by electron beam damage.The darker contrast particles are gold

Fig.8 HRTEM image of a cross section of the K-feldspar surface. The particles are gold,which are in direct contact with the lattice fringes of the K-feldspar

Table 3 Measured concentrations of aqueous Al and Si as a function of time
3.2 TEM results
Secondary mineral products were identifed as boehmite (Figs.1,2,3).Boehmite occurs as an aggregation of single crystals ranging from 20 to 50 nm in size.Boehmite particles stick loosely onto the surface of feldspar and are easily taken off,suggesting both that there is no structural inheritance from feldspar to boehmite and that boehmite is most likely formed form a dissolution-precipitation process,i.e.feldspar→aqueous components→boehmite. All the ring patterns from an aggregation of the products match the published data of boehmite(JCPDS-ICDD: 83-2384)except for some spots which came from feldspar fragments or Fe oxides(Fig.3).We detected Si from an aggregation of boehmite crystals,but the Si/Al ratio in the EDX spectrum is very small,unlike in the published dataon modifed boehmite(Fig.2 in Murakami et al.(1998)). The Si peak we found might be a contamination or come from a Si(Li)detector.

Table 4 Equilibrium constants used in this study
No thick amorphous layers,such as suggested as Heinemann et al.(2003)were observed on the surface of the Alkali-feldspar crystal.There is a light,bright area in the gold coating layer(layer 3 of Fig.4)which is Al-rich (Figs.5,6).This indicates that an Al-rich mineral(probably boehmite)formed in response to feldspar dissolution. In some high-resolution images(e.g.,Fig.7),a thin amorphous layer is visible which likely formed by beam damage.In other cases(e.g.,Fig.8),lattice fringe of K-feldspar connects with gold particle directly and no amorphous layer is detected.
3.3 Geochemical modeling
The following assumptions were made to facilitate the modeling:(1)The amount of K-feldspar dissolution was calculated from Si release data,assuming that no secondary mineral consumes Si and K-feldspar dissolution is the only reaction that releases Si;(2)aqueous Na and K concentrations were derived from only K-feldspar dissolution;and (3)boehmite was the only secondary mineral to form.The amount of boehmite precipitated was calculated by subtracting measured Al concentrations from the total released Al due to K-feldspar dissolution,assuming stoichiometric primary phase dissolution.We plotted these predictions as open symbols in the fgures to distinguish them from measured data,which is represented by solid symbols.The calculation of the equilibrium constants of K-feldspar (K0.82Na0.16Al0.98Si3.15O8)at 150°C,Psatfrom its end members is problematic because of both solid solution and Si–Al ordering.We used experimental measured data to circumvent this.Gautier et al.(1994)obtained effective equilibrium constant for K-rich feldspar(K0.81Na0.15-Ba0.03Al1.05Si2.96O8)dissolution reaction by regressing closed-system experimental data obtained in their study (log Ksp=-16.1).We adopted this value considering the similar source of starting material.
The saturation states of selected minerals during the experimentsweredetermined by speciation-solubilitycalculation using PHREEQC(Table 5).The calculated saturation indices(SI)indicate that throughout the experiments the aqueous solution is under-saturated with respect to K-feldsparwhile supersaturated with respectto boehmite during the entire experiment R(see Fig.10).

Table 5 Saturation Indices calculations for minerals of interest
The following empirical rate equation(Burch et al. 1993)was used to model the reaction path of K-feldspar dissolution:

where r and S stand for the rate of dissolution and reactive surface area of feldspar respectively.k1and k2denote the rate constants in units of mol s-1m-2,g≡|ΔGr|/RT,and n1,m1,and m2are empirical parameters ftted from experimental data.Grstands for Gibbs free energy of the reaction of interest,R gas constant,and T the temperature in Kevin.
Literature parameters were used whenever possible to minimize the number of ftting parameters.k1was obtained fromafar-from-equilibriumrateof10-12mol/m2/sat25°C (pH 4)with an activation energy Eaof 51.7 kJ/mol(Blum and Stillings 1995).The k1/k2ratio in Eq.(1),of 56.65 was taken from Hellmann and Tisserand(2006).Adopted values of n1,m1,and m2were 2×10-6,6,and 1.17,respectively, which are similar to those of Zhu et al.(2010)for modeling albite dissolution(5×10-6,6,and 1.17).Only a small percentage of K-feldspar was dissolved in the experiment (from 7.24×10⁻³to 7.09×10⁻³mol/kgw)so that we assumed the reactive surface areas of K-feldspar remained constantduringtheexperiments.ThemeasuredBETsurface area of 0.0955 m2/g was used for the reactive surface area. The parameters used in this simulation are listed in Table 6.
For boehmite precipitation,we followed Be´ne´zeth et al. (2008)and used the rate law,


Table 6 Parameters and rate laws used in the simulation
where(H+)stands for hydrogen ion activity.Be´ne´zeth et al.(2008)conducted boehmite precipitation experiments for pH 6–9 at 100.3°C.They found that the transition state theory(TST)f(ΔGr)function ft to their data and the precipitation rate is a function of pH.Boehmite precipitation in our experiments occurred in the pH range of 4.05–4.74, at slightly more acidic conditions than those of Be´ne´zeth et al.(2008).Nagy(1995)documented V-shaped pH dependence of aluminum oxyhydroxides dissolution rates and proposed an variation of rates on pH proportional to (H+)at acidic conditions which we adopted.In the reaction path model the only ftted term in Eq.(2)was the effective rate constantwhich was assumed to be constant here because the reactive surface areas for boehmite could not be assessed independently.
This geochemical model matched closely with the aqueous solution chemistry evolution during the frst 300 h of the experiments(Fig.9).Si concentrations increasedrapidly(0–300 h)as K-feldspar dissolved frst starting from far from equilibrium,but this increase decelerated due to the f(ΔGr)term in the rate law.The Al concentrations appear to reach a quasi-steady state as a result of the competition between K-feldspar dissolution and boehmite precipitation.The aqueous solution pH increased because both K-feldspar dissolution and boehmite precipitation consume H+.Note that the dominant Al species is Al(OH)4-during the experiments(Zhu 2009).The predicted SI over time matched well with speciation–solubility calculations for both primary mineral(K-feldspar)and secondary mineral(boehmite)(see Fig.10).

Fig.9 Comparison of predicted solution chemistry from the reaction path model(lines)with experimental data(symbols)during the course of K-feldspar dissolution batch experiment R at 150°C and Psat

Fig.10 Calculated change in K-feldspar and boehmite SI an evolution when compared with data from solubility calculations in experiment R
The K-feldspar dissolution and boehmite precipitation reactions are closely coupled,which is consistent with the conclusions in Zhu et al.(2010).The ratios of K-feldspar dissolution and boehmite precipitation rates are close to unity on a mol s-1kgw-1basis although the individual rates decreased rapidly as solutes accumulate in the solution(Fig.11a).The stoichiometric rate ratio is 1:1, refecting the overall reaction,

Two assumptions have been used in the modeling.The frst is that a constant reactive surface area,though this is inconsistent with the experiments as no boehmite seeds were used in the experiments and boehmite reactive surfaceareas have certainly grown.The second assumption was that the K-feldspar dissolution rate is independent of pH, which was not a large factor because the range of pH change is relatively small(4.05–4.74).

Fig.11 a Simulated ratios of K-feldspar dissolution rates versus boehmite precipitation rates when expressed in unit of mol s-1kgw-1. b Boehmite precipitation rates over time.c K-feldspar dissolution rates over time for experiment R.Bulk K-feldspar dissolution rates in unit of mol kgw-1s-1were estimated from stoichiometric release rates of Si and boehmite precipitation rates from the mass balance on Al.Symbols are rates derived from experimental data and lines are reaction path modeling results

Fig.12 Rates of K-feldspar dissolution normalized to the initial BET surface areas(in mol m-2s-1)for the experiment in experiment R. Symbols denote measured rates.The red solid line and black dashed line indicate calculations with rate law used in this study(Eq.(1)) with customized parameters and the model by Carroll and Knauss (2005).ΔGrvalues were calculated from experimental data using PHREEQC
For the modeling after 300 h,however,Al concentration and rKfs/rBhmratios would not have matched between experimental data and model predictions if we continued to apply the boehmite precipitation expression of Eq.2. Instead,predictions roughly matched with experimental data after 300 h with a rate law expression based on the TST(Lasaga 1981b;a;Aagaard and Helgeson 1982),

and an effective rate constant of 8×10-14mol/kgw/s. Note that the sudden changes in the modeling results of Al concentrations,SI,rKfs/rBhm,rBhmand rKfsat 300 h (Figs.9,10,and 11)are due to the change of boehmite precipitation rate law after 300 h.
Other forms of the rate law and its parameters have also been tested.Oelkers et al.(1994)and Oelkers(2001) account for the inhibitory effects of dissolved aluminum onfeldspar dissolution rates.These effects have been shown in experiments involving labradorite(Carroll and Knauss 2005).Carroll and Knauss(2005)adopted the Oelkers’approach on Al,and we tested Carroll and Knauss’(2005) equations in place of Eq.(1)in reaction path simulations. The results are partly shown in Fig.12.We have also tested other alternative rate laws.If we had used a BCF rate law for boehmite precipitation instead but kept all other parameters the same,the Al and pH data would not have matched.

Fig.13 Activity–activity diagram in the K2O–Al2O3–SiO2–H2O–HCl system at 150°C and Psat.The symbols represent values calculated from experimental data via speciation–solubility modeling. The dashed lines represent quartz solubility.a For experiment R.The line denotes to reaction path modeling prediction.b For experiment L
While the batch experimental data did not defne a unique reaction path model,it was at least narrowed down to a limited set of plausible models.The reaction path of K-feldspar hydrolysis at 150°C,Psatwas traced in the activity–activity diagram of K2O–Al2O3–SiO2–H2O–HCl system (Fig.13).The reaction proceeded within the boehmite feld for the entire experiment duration which is consistent with the observation that boehmite is the most important secondary phase.The reaction path exceeded the experimental points at the end because the model slightly over-predicted pH after 600 h.
We attempted to model experiment L with the same approach for experiment R(data not shown).However,the model failed to predict the evolution of fuid pH probably because we did not consider muscovite as a secondary phase.Muscovite precipitation may be involved in this experiment because it is evident that most of the points are in the muscovite stability feld of activity–activity diagram (Fig.13b).However,we have insuffcient data to constrain three reactions if muscovite precipitation is considered. Note that we did not analyze Na or K concentrations.
Overall,the results here showed the importance of coupled reactions in regulating the reaction rates.The coupling‘‘arrested’’the system to a steady state that dissolution of the primary mineral proceeded at a near equilibrium region where the dissolution rates are greatly reduced as compared to the far from equilibrium rates.This regulation may explain part of the apparent feld-lab discrepancy(Zhu et al.2004).
3.4 Conclusions and remarks
This study presented a detailed analysis of coupled alkalifeldspar dissolution and secondary mineral precipitation at an elevated temperature.The modeling results of these experiments confrmed the conclusions that the K-feldspar dissolution and boehmite precipitation reactions are closely coupled and consistent with the conclusions in Zhu et al. (2010).The modeling results substantiated our hypothesis (Zhu et al.2004)that slow secondary mineral precipitation controls the dissolution rates of the primary phases and partly explains part of the well-known apparent discrepancy between laboratory and feld measured feldspar dissolution rates.However,our study also demonstrated the defciency in our knowledge of the reactions.Even in these simple laboratory systems,we could not completely match the modeling results with experimental data.Therefore,the proliferation of coupled reactive transport models that involve dozens of heterogeneous reactions in sandstonesystems probably should be considered only as educated guesses due to their enormous uncertainties.
AcknowledgmentsA research grant from the State Key Laboratory of Ore Deposits at the Institute of Geochemistry,Chinese Academy of Sciences.
Aagaard P,Helgeson HC (1982)Thermodynamic and kinetic constraints on reaction rates among minerals and aqueous solutions.I.Theoretical considerations.Am J Sci 282:237–285
Beig MS,Lu¨ttge A(2006)Albite dissolution kinetics as a function of distance from equilibrium:implications for natural feldspar weathering.Geochim Cosmochim Acta 70:1402–1420
Be´ne´zeth P,Palmer DA,Wesolowski DJ(2008)Dissolution/ precipitation kinetics of boehmite and gibbsite:application of a pH-relaxation technique to study near-equilirbium rates.Geochim Cosmochim Acta 72:2429–2453
Blum A,Stillings L(1995)Feldspar dissolution kinetics.In:Brantley SL,White AR(eds)Chemical weathering rates of silicate minerals.MineralogicalSociety ofAmerica,Washington, pp 291–346
Brantley SL (1992)Kinetics of dissolution and precipitationexperimental and feld results.In:Kharaka Y,Maest A(eds) Proceedings of the seventh international conference on waterrock interactions,Park City,Utah.Balkema,Rotterdam, pp 465–469
Burch TE,Nagy KL,Lasaga AC(1993)Free energy dependence of albite dissolution kinetics at 80°C and pH 8.8.Chem Geol 105:137–162
Carroll SA,Knauss KG(2005)Dependence of labradorite dissolution kinetics on CO2(aq),Al(aq),and temperature.Chem Geol 217: 213–225
Cubilas P,Kohler S,Prieto M,Causserand C,Oelkers EH(2005) How do mineral coating affect dissolution rates?An experimental study of coupled CaCO3dissolution–CaCO3precipitation. Geochim Cosmochim Acta 69:5459–5476
Daval D,Sissmann O,Menguy N,Saldi GD,Guyot F,Martinez I, Corvisier J,Garcia B,Machouk I,Knauss KG,Hellmann R (2011)Infuence of amorphous silica layer formation on the dissolution rate of olivine at 90°C and elevatedpCO2.Chem Geol 284:193–209
Deer W,Howie R,Zussman J(1992)An introduction to the rock forming minerals,2nd edn.Longman Scientifc and Technical Group,Inc,Oceanside
Drever JI,Clow DW(1995)Weathering rates in catchments.In: White AF,Brantley SL(eds)Chemical weathering rates of silicate minerals.Mineralogical Society of America,New York, pp 463–481
Fu Q,Lu P,Konishi H,Dilmore R,Xu H,Seyfried WE Jr,Zhu C (2009)Coupled alkali-feldspar dissolution and secondary mineral precipitation in batch systems:1.New experiment data at 200oC and 300 bars.Chem Geol 91:955–964
Ganor J,Lu P,Zheng Z,Zhu C(2007)Bridging the gap between laboratory measurements and feld estimations of weathering using simple calculations.Environ Geol 53:599–610
Gautier J-M,Oelkers EH,Schott J(1994)Experimental study of K-feldspar dissolution rates as a function of chemical affnity at 150°C and pH 9.Geochim Cosmochim Acta 58:4549–4560
Gautier JM,Oelkers EH,Schott J(2001)Are quartz dissolution rates proportional to BET surface areas?Geochim Cosmochim Acta 65:1059–1070
Haar L,Gallagher JS,Kell GS(1984)NBS/NRC steam tables: thermodynamic and transport properties and computer programs for vapor and liquid states of water in SI units.Hemisphere Publishing Corporation,New York 320p
Harouiya N,Oelkers EH(2004)An experimental study of the effect of aqueous fuoride on quartz and alkali-feldspar dissolution rates.Chem Geol 205:155–167
Heinemann S,Wirth R,Dresen G(2003)TEM study of a special grain boundary in a synthetic K-feldspar bicrystal:manebach Twin.Phys Chem Miner 30:125–130
Hellmann R,Penisson JM,Hervig RL,Thomassin JH,Abrioux MF (2003)An EFTEM/HRTEM high-resolution study of the near surface of labradorite feldspar altered at acid pH:evidence for interfacial dissolution-reprecipitation.Phys Chem Miner 30: 192–197
Hellmann R,Tisserand D(2006)Dissolution kinetics as a function of the Gibbs free energy of reaction:an experimental study based on albite feldspar.Geochim Cosmochim Acta 70:364–383
Hemingway BS,Robie RA,Apps JA(1991)Revised values for the thermodynamic properties of boehmite,AlO(OH),and related species and phases in the system Al-H-O.Am Mineral 76:445–457 Hereford AG,Keating E,Guthrie G,Zhu C(2007)Reactions and reaction rates in the aquifer beneath Pajarito Plateau,northcentral New Mexico.Environ Geol 52:965–977
Ho PC,Bianchi H,Palmer DA,Wood RH(2000)Conductivity of dilute aqueous electrolyte solutions at high temperatures and pressures using a fow cell.J Solut Chem 29:217–235
Holland TJB,Powell R(1998)An internally consistent thermodynamic data set for phases of petrological interest.J Metamorph Geol 16:309–343
Koroleff F(1976)Determination of silicon.In:Grasshoff K(ed) Methodsofseawateranalysis.Spring Verlag,Newyork, pp 149–158
Lasaga AC(1981a)Rate laws of chemical reactions.In:Lasaga AC, Kirkpatrick RJ(eds)Kinetics of geochemical processes.Mineralogical Society of America,Washington,pp 1–68
Lasaga AC(1981b)Transition state theory.In:Lasaga AC,Kirkpatrick RJ(eds)Kinetics of geochemical processes.Mineralogical Society of America,Washington,pp 135–169
Lasaga AC(1998)Kinetic theory in the earth sciences.Princeton University Press,New York
Li L,Steefel CI,Yang L(2008)Scale dependence of mineral dissolution rates within single pores and fractures.Geochim Cosmochim Acta 72:360–377
Lu P,Fu Q,Seyfried WE Jr,Hedges SW,Soong Y,Jones K,Zhu C (2013)Coupled alkali feldspar dissolution and secondary mineral precipitation in batch systems:2.New experiments with supercritical CO2and implications for carbon sequestration. Appl Geochem 30:75–90
McCollom TM,Shock EL(1997)Geochemical constraints on chemolithoautotrophic metabolism by microorganisms in seafoorhydrothermalsystems.Geochim Cosmochim Acta 61:4375–4391
Murakami T,Kogure T,Kadohara H,Ohnuki T(1998)Formation of secondary minerals and its effects on anorthite dissolution.Am Mineral 83:1209–1219
Nagy KL(1995)Dissolution and precipitation kinetics of sheet silicates.In:White AF,Brantley SL(eds)Chemical weathering rates of silicate minerals.Mineralogical Society of America, Washington,pp 173–225
Nugent MA,Brantley SL,Pantano CG,Maurice PA(1998)The infuence of natural mineral coatings on feldspar weathering. Nature 395:588–591
Oelkers EH(2001)General kinetic description of multioxide silicate mineral and glass dissolution.Geochim Cosmochim Acta 65:3703–3719
Oelkers EH,Schott J,Devidal JL(1994)The effect of aluminum,pH, and chemical affnity on the rates of aluminosilicate dissolution reactions.Geochim Cosmochim Acta 58:2011–2024
Paces T(1973)Steady-state kinetics and equilibrium between ground waterandgraniticrocks.GeochimCosmochimActa37:2641–2663
Siegel DI,Pfannkuch HO(1984)Silicate dissolution infuence on Filson Creek chemistry,northeastern Minnesota.Geol Soc Am Bull 95:1446–1453
Sverjensky DA,Shock EL,Helgeson HC(1997)Prediction of the thermodynamic properties of aqueous metal complexes to 5 Kb and 1000°C.Geochim Cosmochim Acta 61:1359–1412
Tagirov B,Schott J(2001)Aluminum speciation in crustal fuids revisited.Geochim Cosmochim Acta 65:3965–3992
Velbel MA(1990)Infuence of temperature and mineral surface characteristics on feldspar weathering rates in natural and artifcial systems:a frst approximation.Water Resour Res 26:3049–3053
White AF,Brantley SL(2003)The effect of time on the weathering of silicate minerals:why do weathering rates in the laboratory and feld?Chem Geol 202:479–506
Zhu C(2005)In situ feldspar dissolution rates in an aquifer.Geochim Cosmochim Acta 69:1435–1453
ZhuC (2009)Geochemicalmodeling ofreactionpathsand geochemical reaction networks.In:Oelkers EH,Schott J(eds) Thermodynamics and kinetics of water-rock interaction.Mineralogical Society of America,Washington,pp 533–569
Zhu C,Blum AE,Veblen DR(2004)Feldspar dissolution rates and clay precipitation in the Navajo aquifer at Black Mesa,Arizona, USA.In:Wanty RB,Seal RRI(eds)Water-rock interaction. August Aime´Balkema,Saratoga Springs,pp 895–899
Zhu C,Lu P(2009)Alkali feldspar dissolution and secondary mineral precipitation in batch systems:3.Saturation states of product minerals and reaction paths.Geochim Cosmochim Acta 73: 3171–3200
Zhu C,Lu P,Zheng Z,Ganor J(2010)Coupled alkali feldspar dissolution and secondary mineral precipitation in batch systems: 4.Numerical modeling of kinetic reaction paths.Geochim Cosmochim Acta 74:3963–3983
Zhu C,Veblen DR,Blum AE,Chipera SJ(2006)Naturally weathered feldspar surfaces in the Navajo Sandstone aquifer,Black Mesa, Arizona:electron microscopic characterization.Geochim Cosmochim Acta 70:4600–4616
P.Lu·H.Konishi·C.Zhu(✉)
Department of Geological Sciences,Indiana University,
Bloomington,IN 47408,USA
e-mail:chenzhu@indiana.edu
Present Address:
P.Lu
EXPEC Advance Research Center,Saudi Aramco Oil Company, Dhahran 31311,Saudi Arabia
Present Address:
H.Konishi
Department of Geology,Faculty of Science,Niigata University, Niigata 950-2181,Japan
E.Oelkers
Laboratoire de Geochimie,CNRS,38 Rue Des Trente-Six Ponts, 31400 Toulouse,France
E.Oelkers
Earth Sciences,University College London,Gower Street, London WC1E 6B,UK
C.Zhu
Department of Earth Sciences,Zhejiang University, Hangzhou 300027,China
- Acta Geochimica的其它文章
- High pressure equation of state for molten CaCO3from frst principles simulations
- Carbon–oxygen isotopic covariations of calcite from Langdu skarn copper deposit,China:implications for sulfde precipitation
- The O and H isotope characteristics of water from major rivers in China
- Spatial and temporal water quality characteristics of Poyang Lake Migratory Bird Sanctuary in China
- Some aspects of excellent marine source rock formation: implications on enrichment regularity of organic matter in continental margin basins
- Preparation of Mn3O4from low-grade rhodochrosite ore by chemical bath deposition method