
T2 mapping动态定量监测兔腰椎间盘退变模型
2016-05-12 04:02谢光友杨海涛吕富荣刘昌杰杨明放王荣品
磁共振成像 2016年3期
谢光友,杨海涛,吕富荣,刘昌杰,杨明放,王荣品
T2 mapping动态定量监测兔腰椎间盘退变模型
谢光友1,杨海涛2*,吕富荣2*,刘昌杰1,杨明放1,王荣品1
[摘要]目的 提高T2 mapping技术动态定量监测兔腰椎间盘退变模型的认识。材料与方法 18只新西兰大白兔,从脊柱侧后方手术入路暴露腰椎间盘,18 G穿刺针抽吸12只L2~3、L3~4、L4~5髓核,各约5 mg,正常L1~2、L5~6和另6只L2~5间椎间盘分别为组内和组间对照。术后第4、8、12周行MR矢状面T2WI和T2-mapping序列检查,取正中矢状面观察各椎间盘的信号,测量T2弛豫时间并与正常组比较。相应各时间点取2只L1~6间椎间盘行HE和Masson染色,观察纤维环形态、髓核细胞及基质的变化并与正常组比较。结果 18 G穿刺针经脊柱旁路于横突根部可成功穿刺抽吸髓核。6只正常兔及12只实验兔组内对照椎间盘T2WI序列为均匀高信号,12只实验兔椎间盘随术后时间延长信号逐渐降低,第4周呈稍低信号,第8周明显降低,第12周完全呈低信号。正常对照组及术后第4、8、12周组T2弛豫时间的单因素方差分析结果(F=38.82,P<0.05),造模术后第8周T2弛豫时间有显著差异(P<0.05)。术后随时间进展,HE和Masson染色示椎间盘细胞和胶原逐渐减少,纤维环和髓核分界不清;第8周髓核基质退变纤维化,几乎被纤维组织取代;第12周椎间盘纤维软骨化,局部形成软骨。结论 T2 mapping技术可实时定量监测腰椎间盘的退变进程。
[关键词]椎间盘退化;疾病模型,动物;磁共振成像;动物实验
重庆市自然科学基金(编号:cstc2011jjA10082);国家临床重点专科建设项目(编号:2013-544)
作者单位:
1. 贵州省人民医院放射科,贵阳550002
2. 重庆医科大学附属第一医院放射科,重庆 400016
杨海涛,E-mail: frankyang119@126.com;吕富荣,E-mail: lfr918@sina.com
谢光友, 杨海涛, 吕富荣, 等. T2 mapping动态定量监测兔腰椎间盘退变模型. 磁共振成像, 2016, 7(3): 213-217.
腰椎间盘退行性变是导致腰背部疼痛最常见的原因,随着社会老龄化日益突出,将会消耗更多医疗资源。椎间盘缺乏神经血管,自身无再生修复能力,目前内外科均不能逆转椎间盘的退变进程。磁共振成像时间、空间及组织分辨率高,可通过测量椎间盘的T2弛豫时间,无创性地动态监测其退变程度,检测其退变的起始时间及发生可逆性退变的时间窗,对指导临床采取防治措施具有重要意义。
1 材料与方法
1.1 实验动物
取3月龄健康成年新西兰大白兔18只,平均体重2.5 kg,雌雄不拘,无脊柱畸形及椎间盘病变,肢体活动良好,分笼饲养,由重庆医科大学动物实验中心提供[许可证号:SCK (渝) 2012–0001]。
主要试剂仪器:HE和Masson染色试剂盒、15% EDTA脱钙液、无菌PBS(武汉博士德公司),戊巴比妥钠,青霉素、庆大霉素。T2000U倒置相差显微镜(日本Nikon公司),GE HD-X signa 3.0 T MRI成像系统、N-V Array8通道相控阵线圈、ADW 4.4工作站(美国GE公司),无菌手术包,18 G穿刺针。
1.2 构建腰椎间盘退变模型
通过髓核针刺法建立椎间盘退变模型[1-2]。18只兔行MRI检查,术前一天肌注青霉素20万U/kg,术前6 h禁饮禁食。1%戊巴比妥钠(1 ml/kg)经耳缘静脉注射成功麻醉后,取俯卧位固定于兔台,以L2~5间椎体为中心,剃毛备皮、术野消毒铺巾,以L3椎体左侧横突根部为中心,做一4~ 5 cm纵切口,逐层切开皮肤、皮下组织、胸腰筋膜,神经剥离子沿横突向背侧剥离直至横突根部,充分暴露L3~4椎间盘并用18 G穿刺针抽吸髓核组织,约5 mg,然后缓慢退针,同法处理L2~3、L4~5椎间盘,术中用庆大霉素生理盐水冲洗、止血。术后逐层缝合,回笼标准条件下饲养,连续一周消毒切口并肌注青霉素20万U/kg。本实验已通过生物医学伦理审核。
1.3 MRI动态定量监测
术前和术后4、8、12周对实验组和正常组行腰椎MRI检查。成功麻醉后,取俯卧位拉直脊柱后固定,以L3椎体为中心行MRI矢状面检查。扫描序列及参数:FSE T2WI序列:TR 2620 ms,TE 102 ms,FOV 20 cm×20 cm,层厚3 mm,层间距0.6 mm,NEX为4,矩阵384×256;T2-maping序列:TR 1600 ms,TE 11.1、22.2、33.3、44.4、55.5、66.6、77.7、88 ms,FOV 20 cm×20 cm,层厚3 mm,层间距0.6 mm,NEX为1,矩阵384×256。MRI资料由本院2名骨关节疾病影像诊断医师(工作经验5~10年)和1名脊柱外科医师(工作经验10年)进行双盲评估,如有分歧,经讨论后达成一致,选腰椎正中矢状面,观察T2WI序列上各组L1~6间椎间盘的信号及形态,参照Pfirrmann分级标准[3]。通过ADW 4.4工作站Functool软件的时间自动测量系统,设置椭圆形兴趣区包绕椎间盘,测量T2-mapping序列上相应椎间盘的T2弛豫时间,每个兴趣区重复测量3次,取均值。L2~3、L3~4、L4~5椎间盘为实验组,组内L1~2、L5~6及正常兔L1~6间椎间盘为对照。
1.4 病理染色观察
术后4、8、12周空气栓塞法各处死实验组及正常组兔2只,迅速游离并取出L1~6间椎间盘,生理盐水反复冲洗,10%多聚甲醛固定24 h,15% EDTA脱钙两周后梯度酒精脱水,二甲苯透明处理、石蜡包埋、5 μm切片,分别行HE和Masson染色,镜下观察椎间盘形态、髓核细胞及胶原的变化,L2~3、L3~4、L4~5椎间盘为实验组,组内L1~2、L5~6及正常组L1~6间椎间盘为对照。
1.5 统计学方法
利用SPSS 17.0统计软件进行数据分析,实验数据采用表示,实验组和正常组间T2弛豫时间采用单因素方差分析,组内T2弛豫时间采用配对t检验,P<0.05作为差异有统计学意义的标准。
2 结果
2.1 腰椎间盘MRI
正常6只兔L2~3、L3~4、L4~5椎间盘及12只实验兔组内正常对照L1~2、L5~6椎间盘T2WI序列始终为均匀高信号,终板为低信号,髓核与终板分界清楚,观察期内无明显变化。术后12只兔均存活,2周活动自如,无瘫痪及大小便失禁。12只实验兔L2~3、L3~4、L4~5椎间盘信号强度随术后时间延迟逐渐减低,椎间盘含水量减少,容积固缩变薄,第8周所有针刺椎间盘信号均明显降低,第12周信号均进行性下降,椎间盘突出伴硬膜囊受压,骨性椎管继发性狭窄(图1)。6只正常兔及12只实验兔椎间盘术后第4、8、12周组T2弛豫时间单因素方差分析结(F=38.82,P<0.05)(表1),造模术后组间两两比较(除正常组与术后第4周组间)均有统计学差异,说明造模术后第8周椎间盘明显退行性变,T2弛豫时间有显著差异(P<0.05)。
2.2 HE和Masson染色
正常椎间盘HE染色示纤维环和髓核间层次分明,含大量髓核细胞和基质,Masson染色原纤维呈蓝色。实验组随时间延长,椎间盘含水量减少,组织容积逐渐固缩。第4周髓核区域颜色变灰暗,质地松脆,髓核细胞稀少,内层纤维环发生玻璃样变性,纤维间隔模糊出现裂隙,纤维环软骨样细胞开始向成纤维细胞转变,第8周纤维环排列明显紊乱,质地变硬变脆,纤维环断裂,胶原向髓核延伸,中心的髓核区几乎完全被纤维组织替代。第12周椎间盘呈破絮状,出现大量不定形物质和凋亡坏死细胞(图2,3)。
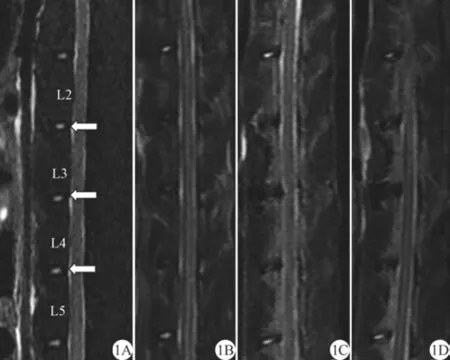
图1 正常及术后不同时间点兔腰椎间盘MR T2WI正中矢状位图。A:正常椎间盘MR图,L2~3、L3~4、L4~5椎间盘均呈高信号(箭)。B、C、D分别为术后第4、8、12周椎间盘MR图,随术后时间延长,L2~3、L3~4、L4~5椎间盘信号均逐渐降低(箭)Fig. 1 The view of the median saggital MRI of rabbit normal and degenerative lumbar IVD at different postoperative timepoints. A: The view of normal IVD MRI, L2—3, L3—4, L4—5 discs showed high signal (arrow). B, C, D represented the MRI of degenerative IVD at postoperative 4 th, 8 th, 12 th week, respectively: the corresponding signal intensity reduced gradually and then became black with the extension of time after operation (arrow).
表1 兔正常腰椎间盘及术后T2弛豫时间(ms,)Tab. 1 T2 relaxation time of rabbit normal and degenerative lumbar IVD ()

表1 兔正常腰椎间盘及术后T2弛豫时间(ms,)Tab. 1 T2 relaxation time of rabbit normal and degenerative lumbar IVD ()
Note:aP<0.05, compared with normal control group
Group 0 week 4 week 8 week 12 week Normal group 128.5±3.8 127.1±2.3 123.7±2.7 126.1.4 Degeneration group 125.8±3.2 95.6±4.1 48.4±2.6a45.8±3.5a
3 讨论
椎间盘退变是由基因预设多因素介导的进行性病变过程,机械负荷、外伤及病毒感染等因素可导致椎间盘细胞凋亡、变性、坏死,细胞内酶量及活性改变,破坏椎间盘内环境稳态,最终退变突出并压迫周围神经根及脊髓,引发一系列症状[4]。动物模型是研究椎间盘退变机制和检测各种治疗有效性的可靠手段,与恒河猴[5]、猪[6]、鼠[1]等相比,实验兔的优势还包括经济实用可进行大样本实验,其椎间盘大小适中取材容易,临床应用型3.0 T MRI仪可实时动态定量监测椎间盘等。
3.1 针刺法制作椎间盘退变模型的机制
椎间盘内原始细胞数量及细胞活性是维持椎间盘内环境稳态的关键。椎间盘退变始于髓核细胞功能减退和数量减少,而髓核细胞增殖力差,退变中髓核由软骨细胞及基质取代;伴随髓核脱水、高度减低,于外力及机械负荷下,纤维环结构紊乱;终板进行性增厚伴局限性骨质断裂;椎间盘组织内硫酸软骨素和硫酸角质素比例失调,逐渐被矿化组织取代,致终板内毛细血管硬化闭塞减少,加重髓核组织营养短缺;同时,基质金属蛋白酶量及活性进一步增强,加速退变进程。椎间盘失去正常解剖生理结构,脊柱出现异常运动,应力轴失衡,脊柱失稳,加快加重退变进程,进而引起一系列临床症状[7-10]。基于椎间盘退变始于髓核细胞及基质的病理改变,本研究通过针刺抽吸兔腰椎间盘髓核,破坏椎间盘内环境稳态,通过定期定量监测椎间盘的弛豫时间,并与正常组进行对照,更好地模拟腰椎间盘的退变进程。

图2 兔腰椎间盘(HE × 200)。A:正常椎间盘,纤维环完整,排列整齐致密,髓核内含有大量细胞及基质,纤维环与髓核分界清;B:术后第8周椎间盘,纤维环排列紊乱断裂,髓核细胞和基质减少,纤维环与髓核分界不清Fig. 2 The view of rabbit lumbar IVD HE stainning ( ×200). A: The view of normal IVD, the structure of annulus fibrosus was intact and arranged regularly, a large number of cells and matrix were obesrved in nucleus pulposus, and the boundary between annulus fibrosusand nucleus pulposus was distinct. B: The view of the IVD at the postoperative 8 th week, the annular fibrosus was in disorder and fractured, the cells and matrix in nucleus pulposus decreased, and the boundary between annulus fibrosus and nucleus pulposus was indistinct.
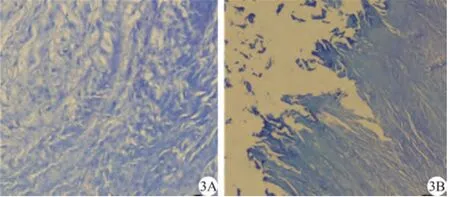
图3 兔腰椎间盘胶原Masson染色( ×200)。 A:正常胶原纤维:排列规则,层次清晰;B:术后第8周,胶原胶原排列紊乱,各层间见裂隙、断裂、溶解Fig. 3 The view of rabbit lumbar IVD collagen Masson staining ( ×200). A: The normal collagen arranged regularly and had clear boun dary. B: The view of collagen stained at the postoperative 8th week showed the collagen arranged irregularly and the interlayer fissure, frac ture and dissolution was observed.
3.2 MRI及病理学评价椎间盘退变
评价腰椎间盘退变多从影像和病理进行。MRI软组织分辨率高、无骨伪影和放射性损伤,是监测椎间盘退变的首选方法。MRI不仅能多平面显示腰椎间盘在退变过程中的形态变化,而且能够反映其内部结构的分子变化。椎间盘内尤其是髓核的含水量决定其信号强度,退变椎间盘脱水容积缩小、信号降低[11]。
仅通过信号强度来判断椎间盘的退变程度,由于主观偏差较大,不能准确反映椎间盘内大分子含量及结构的细微变化。细胞分子结构功能的变化出现在形态学变化前,通过椎间盘T2弛豫时间的变化能更早、更敏感的监测其退变程度,加深对椎间盘退变病理生理机制的认识。本研究运用T2 mapping序列动态定量监测椎间盘的T2弛豫时间,更加敏感的反映组织内部水、蛋白多糖及胶原纤维的含量和排列方向。有学者通过测量T2弛豫时间可无创性的检测椎间盘退变的起始时间及发生可逆性退变的时间窗[12-14],对临床采取防治措施延缓甚至逆转椎间盘退变具有重要的指导意义。基于椎间盘退变过程中生物力学和生物化学的变化,有研究应用扩散张量成像(DTI)、扩散加权成像(DWI)及波谱分析(MRS)等定量方法来加深认识椎间盘的退变机制[15-17]。
本研究从联合影像与病理动态对应分析术后兔椎间盘的退变进程,更加深入地认识椎间盘的退变机制。术后第4周,实验组椎间盘纤维环逐渐出现裂隙、层状纤维结构逐渐紊乱,细胞成份逐渐减少,信号强度较正常对照组下降,弛豫时间减低。术后第8周,纤维环逐渐断裂甚至破碎,软骨样细胞明显减少,椎间隙变窄,软骨内形成骨赘,呈小结节状低信号改变,T2弛豫时间明显进行性减低;术后第12周椎间盘细胞基质成份变性坏死,细胞几近消失,椎间盘信号强度进一步下降,呈均匀低信号,T2弛豫时间较第8周变化不大,椎体边缘形成大量软骨及骨赘,硬脊膜囊受压变形,部分椎管继发性狭窄。病理染色结果与MRI信号强度及弛豫时间变化基本吻合,与国内外研究结果相一致[11-13]。
综上所述,针刺法可成功建立兔腰椎间盘退变模型,重复性好、可操控性强;T2 mapping技术能无创实时动态监测椎间盘的退变过程,并与病理表现基本一致,为研究腰椎间盘退变提供了一种可靠的定量监测方法,对指导临床防治椎间盘退变具有重要意义。
参考文献[References]
[1]Issy AC, Castania V, Castania M, et al. Experimental model of intervertebral disc degeneration by needle puncture in Wistar rats. Braz J Med Biol Res, 2013, 46(3): 235-244.
[2]Sobajima S, Kompel JF, Kim JS, et al. A slowly progressive and reproducible animal model of intervertebral disc degeneration characterized by MRI, X-ray, and histology. Spine (Phila Pa 1976), 2005, 30(1): 15-24.
[3]Grunert P, Hudson KD, Macielak MR, et al. Assessment of intervertebral disc degeneration based on quantitative MRI analysis: an in vivo study. Spine, 2013, 12(9): 421-432.
[4]Kepler CK, Ponnappan RK, Tannoury CA, et al. The molecular basis of Intervertebral disc degeneration. Spine, 2013, 13(2): 318-330.
[5]Kong J, Wang ZX, Ji Y, et al. A model of lumbar disc degeneration on the early stage in rhesus monkey with minimally invasive technique. Chin J Surgery, 2007, 23(3): 1597-1600.孔杰, 王子轩, 季玉, 等. 应用微创技术建立恒河猴腰椎间盘早期退变模型. 中华外科杂志, 2007, 23(3): 1597-1600.
[6]Kwon YJ. A minimally invasive rabbit model of progressive and reproducible disc degeneration confirmed by radiology, gene expression, and histology. J Korean Neurosurg Soc, 2014, 53(5): 323-330.
[7]Hughes SP, Freemont AJ, Hukins DW, et al. The pathogenesis of degeneration of the intervertebral disc and emerging therapies in the management of back pain. Bone Joint Surg Br, 2012, 94(1): 1298-1304.
[8]Bergknut N, Smolders LA, Grinwis GC, et al. Intervertebral disc degeneration in the dog. Part 1: Anatomy and physiology of the intervertebral disc and characteristics of intervertebral disc degeneration. Vet J, 2013, 195(4): 282-291.
[9]Boubriak OA, Watson N, Sivan SS, et al. Factors regulating viable cell density in the intervertebral disc: blood supply in relation to disc height. Anat, 2013, 222(6): 341-348.
[10]Nagy SA, Juhasz I, Komaromy H, et al. A statistical model for intervertebral disc degeneration: determination of the optimal T2 cut-off values. Clin Neuroradiol, 2014, 24(4): 355-363.
[11]Moon CH, Jacobs L, Kim JH, et al. Part 2: Quantitative proton T2 and sodium MR imaging to assess intervertebral disc degeneration in a rabbit model. Spine, 2012, 37(3): 1113-1121.
[12]Sun W, Zhang K, Zhao C, et al. Quantitative T2 mapping to characterize the process of intervertebral disc degeneration in a rabbit model.BMC musculoskeletal disorders, 2013, 14(3): 357-362.
[13]Huang YQ, Zhao XM, Wu QH, et al. Measurement of MR T2 relaxation time for assessing cervical intervertebral disc degeneration: preliminary study. Chin J Magn Reson Imaging, 2015, 5(11): 843-847.黄耀渠, 赵晓梅, 伍琼惠, 等. MR T2弛豫时间评估颈椎间盘退变的初步研究. 磁共振成像, 2015, 6(11): 843-847.
[14]Niinimaki J, Korkiakoski A, Ojala O, et al. Association between visual degeneration of intervertebral discs and the apparent diffusion coefficient. Magn Reson Imaging, 2011, 27(9): 641-647.
[15]Fang Y, Liu LX, Li JL, et al. Prelimary study of lumbar intertebral disc degeneration with magnetic resonance spectroscopy, T2 relaxation times and apparent diffusion coefficient. Chin J Magn Reson Imaging, 2011, 2(4): 278-282.方元, 刘兰祥, 李京龙, 等. 磁共振波谱成像、T2弛豫时间、扩散加权成像对腰椎间盘退变的初步研究. 磁共振成像, 2011, 2(4): 278-282.
[16]Zhu JY, Wang XM. The study of correlation between ageandanatomical segment in healthy lumbar interverbral discs by diffusion tensor imaging. Chin J Magn Reson Imaging, 2015, 3(7): 518-523.祝静雅, 王晓明. 扩散张量成像对健康成人腰椎间盘与年龄及解剖部位的相关性研究. 磁共振成像, 2015, 6(7): 518-523.
[17]Wang C, Witschey W, Goldberg A, et al. Magnetization transfer ratio mapping of intervertebral disc degeneration. Magn Reson Med, 2010, 64(4): 1520-1528.
Quantitative T2 mapping to monitor the process of lumbar intervertebral disc degeneration in a rabbit model
XIE Guang-you1, YANG Hai-tao2*, LÜ Fu-rong2*, LIU Chang-jie1, YANG Mingfang1, WANG Rong-pin11Department of Radiology, Guizhou Provincial People’s Hospital, Guizhou Province, Guiyang 550002, China
2Department of Radiology, the First Affiliated Hospital of Chongqing Medical University, Chongqing 400016, China
*Correspondence to: Yang HT, E-mail: frankyang119@126.com. LÜ FR, E-mail: lfr918@sina.com
Received 23 Dec 2015, Accepted 30 Jan 2016
ACKNOWLEDGMENTS The paper was supported by the Natural Science Funding of Chongqing (No. cstc2011jjA10082). National Clinical Key Subject Construction Project (No. 2013-544).
AbstractObjective: To improve the recognition of quantitative T2 mapping to dynamically monitor the process of lumbar intervertebral disc degeneration in a rabbit model. Materials and Methods: The nucleus pulposus of L2—3, L3—4 and L4—5 discs of 12 rabbits were aspirated by using a 18G needle and the normal L1—2, L5—6 discs of each rabbit and the discs between L2—5 vertebral body of 6 rabbits acted as the normal intra and inter control groups, respectively. The rabbits were performed with sagittal MR T2WI and T2 mapping sequences scanning at the pre-and-postoperative 4 th, 8 th, 12 th week, respectively. The signal intensity of each disc was evaluated and T2 relaxation time was measured carefully. The discs between L1—6 were dissected and then performed with HE and Masson trichrome staining to evaluate the form of discs, content change of nucleus pulposus cells and matrix between normal and experimental groups. Results: The nucleus pulposus could be punctured successfully with a 18 G needle in the root of transverse process via spinal bypass. The normal discs manifested with uniform high signal in T2WI. The signal intensity decreased sharply at the 8 th week and became completely low signal intensity at the 12 th week post-operation. The significant difference of T2 relaxation time foundbook=214,ebook=61between normal control groups and experimental groups after 4, 8 and 12 weeks was analysed by one-way ANOVA, and the result was F=38.82 (P<0.05). The T2 relaxation time at the 8 th week post-operation was significantly different (P<0.05). The results of HE and Masson staining showed that the cells and matrix decreased gradually, moreover, the boundary between annulus fibrosus and nucleus pulposus became obscure. The nucleus pulposus displayed the process of fibrosis and was almost replaced by fibrous tissue at 8 th week. The discs was fibrocartilage and local cartilage can be observed at the 12 th week. Conclusions: T2 mapping can be used to dynamically monitor the process of lumbar intervertebral disc degeneration.
Key wordsIntervertebral disk degeneration; Disease models, animal; Magnetic resonance imaging; Animal experimentation
DOI:10.12015/issn.1674-8034.2016.03.010
文献标识码:A
中图分类号:R445.2;R33.2
收稿日期:2015-12-23接受日期:2016-01-30
通讯作者:
基金项目:
猜你喜欢
故事作文·高年级(2017年1期)2017-03-01
小学阅读指南·低年级版(2016年12期)2017-01-05
中国实用医药(2016年29期)2016-12-26
心脑血管病防治(2016年5期)2016-12-19
华夏医学(2016年4期)2016-12-12
中国实用医药(2016年28期)2016-12-07
中国现代医生(2016年23期)2016-11-15
科技视界(2016年18期)2016-11-03
科技知识动漫(2016年7期)2016-07-29
