
Carbon emission scenarios of China's power sector:Impact of controlling measures and carbon pricing mechanism
2018-05-24 07:48LIUQingZHENGXioQibZHAOXuChenCHENYiOlegLUGOVOY
LIU Qing*,ZHENG Xio-Qib,ZHAO Xu-ChenCHEN YiOleg LUGOVOY
a National Center for Climate Change Strategy and International Cooperation,Beijing 100038,China
b School of Environment&Natural Resources of Renmin University of China,Beijing 100872,China
c Environmental Defense Fund China Program,Beijing 100007,China
1.Introduction
As the Paris Agreement has been reached,countries around the world are moving towards a low-emission and climateresilient world and the majority prefer to the low-carbon path for development(IPCC,2014;Du,2014;Li,2015).In 2015,the Chinese government announced the Enhanced Actions on Climate Change-China's Intended Nationally Determined Contributions and pledged to peak CO2emissions around 2030 and strive to peak early(NDRC,2015).To achieve these targets,we must vigorously press ahead with the low-carbon transformation of economy and society,especially the energy sector.
The power sector is the largest carbon emitter and nonfossil energy user among Chinese economic sectors.According to preliminary estimates,the power sector produced about 3.55 GtCO2in 2015,accounting for 38%of the country's carbon emissions from energy consumption.In view of more stringent binding targets for carbon emissions,the Chinese government has adopted a number of policies and measures that remarkably improve the energy structure and energy efficiency in the power sector.The share of renewable generation in total generation increased from 16.1%in 2005 to 22.4%in 2015,while the fuel use per power generation in coal- fired plants fell by 14.9%to 315 gce(kW h)-1(CEC(China Electricity Council),2017;NBSC,2016a).However,it should not be overlooked that carbon emissions are still taking an upward trend in the power sector.More specifically,the carbon emissions increased by 69%from 2.1 GtCO2to 3.55 GtCO2over the ten years(NBSC,2016b).Given this,only through low-carbon transformation of the power sector can we radically change the high-carbon energy system and achieve low carbon in end users in China.
There have been many studies on the low-carbon transition of power sector with the utilization of various models and scenarios,and these studies provided valuable insights into hot topics,such as carbon emission peak,carbon tax,carbon price,in fluence factors of carbon emission and emission abatement potential(Cheng and Xing,2016;Wang and Wang,2016;Liu et al.,2014;Song et al.,2013;Zhang,2011;Peng and Wang,2016;Zhu,2011).The methodologies and conclusions of these studies are instructive for our analysis.Our study constructs a low-carbon path analysis model of China's power sector based on The Integrated MARKAL-EFOM System(TIMES)model,conducts a comparative analysis of carbon emissions scenarios and further,probes into the targets,paths,policies and their effects regarding the control of carbon emissions in the power sector.
2.Model and methodology
The TIMES model is an energy system model that can provide detailed technical analysis for long-term,multi-period,and dynamic energy development in a country or region(Loulou et al.,2005a).It is generally used for the study of the entire energy system and also individual-specific sectors such as the power sector.Based on the TIMES model,this study builds the Low-Carbon Path Analysis Model for China's Power Sector which is a refined dynamic linear programming model for power system(Fig.1).Driven by future power demand,the proposed model objectively describes all aspects of the real energy system,such as primary energy supply,power generation facility operation,power demand,and offers detailed characterization of current or future applicable technologies to form a complete reference energy system(RES)(Loulou et al.,2005b).
The Low-Carbon Path Analysis Model for China's Power Sector simulates future development trends of the power sector on the RES.Under the constraints of energy supply,process capacity, production operation and pollutant emissions,as well as user-defined constraints,the model applies the linear programming method to produce minimumcost technological combinations and calculates energy consumption and carbon emissions of power system under different scenarios(Liu et al.,2011;Wang et al.,2010).
The analysis sets 2050 as target year with a one-year time interval,and uses China's national historical statistic data from 2007 to 2012 to calibrate the data in the model.In order to clearly present and compare the result for each 5 years,the analysis use year 2010 as the beginning year.The model examines nine energy carriers,namely coal,oil,natural gas,nuclear energy,hydro energy,wind energy,solar energy,biomass energy,and geothermal energy.It depicts a total of 201 existing and prospective technologies in different links of the national power generation system.The model data is divided into five types,including natural sources data,technologies data,emission factor data,system setting parameters and demand data.The first three types of data mainly come fromChina Statistical Yearbooks(NBSC,2016a),China Energy Statistical Yearbooks(NBSC,2016b)and other publicly accessible data;system setting parameters usually are set by default or by users;and demand data is cited from Liu et al.(2017,2016).
3.Scenario design
3.1.Scenarios with different controlling measures
This study sets three scenarios,i.e.reference(REF)scenario,low-carbon(LC)scenario and enhanced low-carbon(ELC)scenario,and by comparing carbon emissions in these scenarios,identifies different paths to carbon emission peak in the power sector and policy implications.In the REF scenario,the power sector is free from additional abatement targets and maintains energy conservation and non-fossil energy development as during the 11th and 12th Five-Year Plan(FYP)periods.The LC scenario strengthens the measures for energy conservation and emissions reduction,and promotes power generation from non-fossil energy sources while intensifying the elimination and replacement of backward coal- fired generators.In the ELC scenario,the power sector is subject to more stringent constraints of carbon emissions,and steps up the control of total installed capacity from coal- fired generators and the large-scale development of renewable energy generators.The demand for electricity will grow,but at different rates in the three scenarios,which re flects the increased efforts of energy demand-side management.To 2050,the per capita power consumption will reach 8500,7500 and 7000 kW h in the REF,LC and ELC scenarios respectively(Fig.2)(Liu et al.,2016,2017;Zhou et al.,2011;IEA,2014;Wang and Watson,2010;Zhang and Cheng,2015;Jiang,2011).The three scenarios are set and compared,as shown in Table 1.
3.2.Scenarios with different carbon pricing
The carbon price scenarios are set by introducing carbon pricing to the above-mentioned scenario,in order to evaluate the effects of carbon price on carbon emissions of the power sector.Comparatively speaking,LC scenario is a moderate scenario that covers all of controlling measures set by Chinese government but excludes the further stringent measures to be adopted.It is therefore most possible scenario under current policies on carbon emission controlling,and selected to be a benchmark to assess the effect of carbon price.A series of incremental carbon prices are set in this study with reference to carbon price levels in the seven pilot carbon markets in China(Zheng and Sun,2017).It is initially set to CN¥30 t-1CO2-eq in 2017,and then increases linearly year by year,up to CN¥50,100 and 150 t-1CO2-eq respectively in 2050,which correspond to LC-IL50,LC-IL100 and LC-IL150 scenarios1IL stands for increase linearly.,as shown in Table 2.

Fig.1.Diagram of the Low-Carbon Path Analysis Model for China's Power Sector.

Fig.2.Power demand trends from 2010 to 2050 in China.
4.Analysis results of scenarios with different controlling measures
4.1.CO2 emissions
In the REF scenario,the carbon emissions of the power sector tend to increase rapidly before 2030 and slowly after to the peak of about 4.86 GtCO2in 2040,and then fall to 4.80 GtCO2in 2050(Fig.3).In the LC scenario,the carbon emissions will grow slowly before peaking at 4.09 GtCO2in 2027,and then reduce quickly to 3.76 GtCO2in 2050.In the ELC scenario,the carbon emissions will reach the peak of about 3.92 GtCO2in 2024,followed by a rapid decline,down to 3.50 GtCO2in 2050.
In general,the peaking of carbon emissions in the power sector requires a large time span,depending on major measures that cover demand-side management,coal consumption restriction,and renewable energy development.If the measures are appropriate,the peak will arrive before 2025 under an economically effective condition.Many research institutions at home and abroad forecast that China's power sector will reach peak emissions at 4.0-5.0 GtCO2(Yin and Chen,2013;Liu,2011;Zhu et al.,2015)before 2030.This study shows the peak varies with the year of arrival or more specifically,the earlier arrival,the lower peak.The peak will range from 4 GtCO2to 4.8 GtCO2,which means an increment of only 0.5-1.3 GtCO2or 14%-35%compared to 2015(about 3.55 GtCO2).
4.2.Power generation and installed capacity
The power generation structure is very different in the REF,LC and ELC scenarios(Fig.4).Non-fossil fuels accounted for 20.6%of the power generation in 2010,and then the proportion will rise gradually at different speed.In 2020,the proportion will increase to 29.0%,29.6%and 30.0%in the three scenarios respectively,35.0%,42.8%and 41.7%by 2030 and 45.9%,55.8%and 56.8%by 2050.In 2020,the installed capacity from non-fossil fuels will reach 700 GW in all scenarios(Fig.5),representing about 39%of the total installed capacity.By 2030,the number will increase to 930,1060 and 1100 GW in the three scenarios respectively,with the share up to 42.4%,47.5%and 49.8%.To 2050,the share will enlarge to 55.4%,65%and 66.3%respectively.
The comparison of the three scenarios reveals that,even in the REF scenario,the power structure tends to optimize significantly,and non-fossil fuels will contribute more than 55%of the installed capacity and 46%of the power generation in 2050.

Table 1Scenarios with different controlling measures.

Table 2Scenarios with different carbon pricing(unit:CN¥t-1CO2).

Fig.3.Carbon emissions of the power sector in different scenarios.
5.Analysis results of scenarios with different carbon pricing
5.1.CO2 emissions
According to the analysis of carbon price scenarios,carbon pricing can effectively promote the mitigation of carbon emissions,and carbon emission reductions gradually increase along with the increase of carbon prices(Fig.6).In the LCIL50 scenario,the carbon emissions of the power sector will reach 3.92 GtCO2in 2020 and peak 4.02 GtCO2in 2027,but decrease rapidly to 3.68 GtCO2in 2050.In the LC-IL100 and LC-IL150 scenarios,the peak will arrive in 2027,numbering 3.99 and 3.92 GtCO2respectively,but the emissions will rapidly reduce to 3.65 and 2.39 GtCO2in 2050.In general,with rising carbon price,the peak of carbon emissions becomes lower relative to LC scenario of 100-200 MtCO2,though the year of its arrival differs little.
Comparatively speaking,the CO2emissions of LC-IL150 in 2050 is much lower than the level in LC by 1.37 GtCO2,meaning that 36%of CO2emission is reduced.Even more,the CO2emissions of LC-IL150 in 2050 is lower than the level in ELC.It means that introducing CN¥150 t-1CO2into the model can have better carbon emission reduction effect than strong controlling measures,and probably have less carbon mitigation cost.
The Paris Agreement seeks to achieve a balance between anthropogenic emissions by sources and removals by sinks of greenhouse gases in the second half of this century.It implies that power sector,as the main source of CO2emission,need to become deep decarbonization,and the CO2intensity of per unit of kW h(the CO2intensity,for short)need to be close to zero.However,in LC-IL150 scenario,the CO2intensity in 2050 will be 0.22 kgCO2(kW h)-1,meaning that more efforts are needed to be put to further reduce the carbon emission of power sector.
5.2.Power generation
The comparison of generation structure in three carbon price scenarios(Fig.7)indicates that carbon pricing will optimize the power structure by promoting non-fossil power while effectively inhibiting coal power.In the LC-IL50,LCIL100 and LC-IL150 scenarios,coal will account for 52.9%,52.3%and 51.6%of the total generation by 2020 respectively,1.3,1.9 and 2.6 percentage points lower than LC scenario.In 2030,the shares will be reduced to 49.8%,49.4%and 48.6%,respectively,1.3,1.9 and 2.5 percentage points lower than LC scenario.To 2050,coal power will take up 40.6%,40.2%and 39.3%,which are 1.0,1.4,and 2.3 percentage points lower than LC scenario.Correspondingly,the share of non-fossil fuels in total generation will increase steadily.By 2020,the generation from non-fossil fuels will exceed 2100 TW h in the three carbon price scenarios,representing about 31%of the total generation.The shares will reach 43.8%,44.3%and 45.1%respectively by 2030 and 56.7%,57.1%and 58%by 2050.

Fig.4.Generation in power sector from 2010 to 2050 in different scenarios.
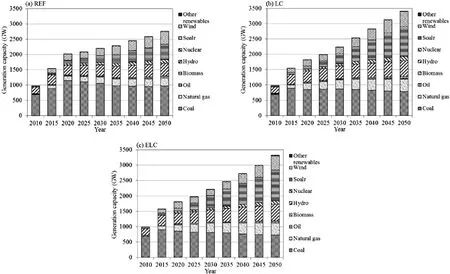
Fig.5.Installed capacity structure from 2010 to 2050 in different scenarios.
5.3.Carbon emission reduction
According to the analysis result of relationship between carbon price and abatement effect2The abatement effect refers to the reduction of CO2 emissions of carbon price scenarios compared with the benchmark,i.e.LC scenario,expressed as percentage.(Fig.8),when the average carbon price is less than CN¥100 t-1CO2,the abatement effect increase slowly with carbon price,but remains below 5%.For example,in the LC-IL50,LC-IL100 and LC-IL150 scenarios,when the carbon price staysatCN¥38,58 and 77 t-1CO2in 2030 respectively,the rate of emission reductions are 1.8%,2.9%and 4.3%.When the carbon price exceeds CN¥106 t-1CO2,the abatement effect will augment rapidly and maintain generally above 15%.When the carbon price attains CN¥150 t-1CO2,the rate of emission reductions can be as high as 36%.
Further consequences can be got by comparing the difference of abatement effects before and after CN¥106 t-1CO2.When the carbon price is lower than CN¥106 t-1CO2,CCUS would not be commercially applied to thermal power,and the abatement can be mainly attributed to the development of nonfossil fuels and the ef ficiency improvement of fossil fuels.However,when the carbon price is higher than the level,CCUS starts to play a role in carbon emission reduction,besides the two factors mentioned above,and it would be commercially applied at large scale,then the amount of carbon capture will increase from 0.2 GtCO2around 2040 to 0.6 GtCO2in 2050.Generally speaking,the development of nonfossil fuels and ef ficiency improvement are the main driver for mitigation,but once the carbon price reaches up to CN¥106 t-1CO2,the CCUS will be required to equip with thermal power units and its contribution on carbon emission reduction will remarkably increase.When carbon price increases to CN¥150 t-1CO2in 2050,CCUS will account for 44%of total abatement.
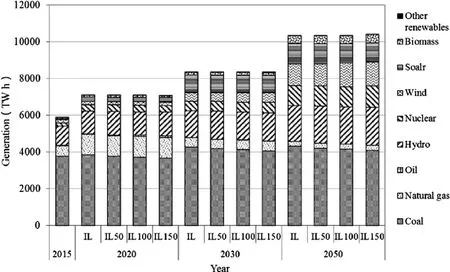
Fig.7.Comparison of generating capacity structure in carbon pricing scenarios.

Fig.8.Relationship between carbon pricing and emission reduction(Non-F stands for non-fossil fuels;EFF.stands for ef ficiency).
6.Conclusions and recommendations
This study uses the Low-Carbon Path Analysis Model for China's Power Sector to assess the impact of controlling measuresand carbon pricing on carbon emissionsin thepowersector under different scenarios and draws the conclusions as follows:(1)The peak of carbon emission in China's power sector will range from 4.0 to 4.8 GtCO2,which implies an increment of 0.5-1.3 billion or 14%-35%from the 2015 levels.(2)Introducing carbon price isan effectiveway to inhibitcoalpowerand promote non-fossil fuels and CCUS applications.The carbon emission reduction effects will gradually increase with carbon price.When thecarbon priceattainsto CN¥150 t-1CO2,the CO2emission can decrease by 36%than that without carbon price.(3)CCUS is one of important contributing factor to reduce CO2emission in power sector.Generally speaking,the development of non-fossil fuels and energy ef ficiency improvement are two main drivers for carbon mitigation,but once the carbon price reaches up to CN¥106 t-1CO2,the CCUS will be required to equip with thermal power units and its contribution on carbon emission reduction will remarkably increase.When carbon price increases to CN¥150 t-1CO2in 2050,the application of CCUS will account for 44%of total emission reduction.(4)In the scenario with carbon price of CN¥150 t-1CO2,power sector would be decarbonized significantly,and the CO2intensity will be 0.22 kgCO2(kW h)-1,but power sector is far from the goal that achieving net zero emission.In order to realize the longterm low greenhouse emission development goal that proposed by the Paris Agreement,more effortsare needed to be put for further carbon emission reduction of power sector.
Based on the above analysis,this study proposes the following recommendations to promote the low-carbon transition of China's power sector:
First,improve the energy ef ficiency proactively and optimize the energy structure of power sector gradually.Based on the consequence of model analysis,improving energy ef ficiency and switching fossil energy to non-fossil energy are two main important factors for low-carbon transition of power sector.On the one hand,in order to improve the ef ficiency of thermal power plants vigorously and leave enough space for the development of non-fossil fuel development,such measures as phasing out outdated coal power capacity and controlling additional new-built coal power strictly should be sustained.On the other hand,in order to promote the development of nonfossil energy in power sector,especially wind and solar power,such policies as giving priority for non-fossil to gain access to grid and setting binding targets for renewables at appropriate time should be push forward.It should be also noticed that a stronger electric grid is needed to guarantee the large-scale and fast growing use of intermittent renewable powers.
Second,promote the low-carbon transition of power sector by using market-based mechanism like carbon emission trading scheme to internalize the external cost of carbon emission.It has been proved in this analysis that carbon pricing is a good way to reduce the carbon emission in power sector,and can even have better mitigation effect than enhanced controlling measures and should have lower mitigation cost than the latter.Chinese government has announced to initiate the national carbon emissions trading market by the end of 2017,which is a very good scheme for power sector to use market force to internalize the external cost of carbon emission.Such market-based mechanism can also help return the original commodity property of each energy product,and would be crucial for the deep decarbonization of power sector when the scale of low carbon energy technologies rise to a high level.Third,give more emphasis on and support to the CCUS technologies.CCUS would be forced to apply to thermal power as carbon price reaches a relative high level,say,above CN¥106 t-1CO2and the amount of CO2capture will increase gradually to 0.6 GtCO2by 2050.Nevertheless,the high cost of CCUS is still one of the main challenges for its application in power sector,so it is very important to escalate the commercial deployment of CCUS from now to make it penetrate into the market step by step.In the meantime,sound laws and regulations,viable development planning and technical roadmap,and serial preferential policies should be put in place to broaden the financing channel for CCUS development and ultimately realize ground-breaking advancement and large-scale commercial application of CCUS in power sector.
Acknowledgments
The work was supported by The National Key Research and Development Program of China(2016YFA0602800).We were also grateful to the Environmental Defense Fund China Program,which provided important support to this project.
References
CEC(China Electricity Council),2017.Report on Situation and Forecast of Power Supply and Demand in China(2016-2017).http://www.cec.org.cn/yaowenkuaidi/2017-01-25/164285.html.
Cheng,L.,Xing,L.,2016.Analysis of requirement and impact of power development under the peak carbon emission in 2030.Electr.Power 49(01),174-177(in Chinese).
Du,X.-W.,2014.Energy revolution for a sustainable future.China Population.Resour.Environ.24(7),1-5(in Chinese).
IEA(International Energy Agency),2014.IEA World Energy Outlook 2014 Annex ATables for Scenario Projections.http://www.worldenergyoutlook.org/publications/weo-2014/.
IPCC,2014.Summary for Policymakers.Contribution of Working Group III to thefifth Assessment Report of the Intergovernmental Panel on Climate Change.Cambridge University Press,Cambridge and New York.
Jiang,K.-J.,2011.Green Low-Carbon Roadmap:China's Power Sector.China Environmental Science Press,Beijing(in Chinese).
Li,J.-F.,2015.Promote energy revolution-to tackle climate change.China Power Enterp.Manag.1,30-31(in Chinese).
Liu,J.,2011.Chinese TIMES Model System and Impact of CCS Application.School of Policy and Management of Tsinghua University(in Chinese).
Liu,J.,Chen,W.-Y.,Liu,D.-S.,2011.Low-carbon energy development strategy based on Chinese TIMES model system.J.Tsinghua Univ.(Natural Science)51(4),525-529(in Chinese).
Liu,Q.,Chen,Y.,Tian,C.,et al.,2016.Strategic deliberation on development of low-carbon energy system in China.Adv.Clim.Change Res.7(1-2),26-34.
Liu,Q.,Chen,Y.,Tian,C.,et al.,2017.Pathway and policy analysis to China's deep decarbonization.Chin.J.Popul.Resour.Environ.15(01),39-49.
Liu,Z.,Zhu,K.,Pu,G.,2014.Carbon emission reduction potential of power demand side based on LEAP model.Electr.Contract.35(06),153-159(in Chinese).
Loulou,R.,Remne,U.,Kanudia,A.,et al.,2005a.Documentation for the TIMES Model-Part1.http://iea-etsap.org/index.php/documentation.
Loulou,R.,Remne,U.,Kanudia,A.,et al.,2005b.Documentation for the TIMES Model-Part2.http://iea-etsap.org/index.php/documentation.
NBSC(National Bureau of Statistics of China),2016a.China Statistical Yearbook 2016.China Statistics Press,Beijing.
NBSC(National Bureau of Statistics of China),2016b.China Energy Statistical Yearbook(2016).China Statistics Press,Beijing.
NDRC(National Development and Reform Commission of China),2015.Enhanced Actions on Climate Change:China's Intended Nationally Determined Contributions.Http://www.fmprc.gov.cn/ce/cegv/chn/zywjyjh/t1194752.html.
Peng,W.,Wang,S.,2016.Analysis of the Factors of Carbon Emissions in Electric Industry Based on LMDI Model.Journal of Shanghai University of Electric Power 32(03),pp.301-305(in Chinese).
Song,Y.,He,N.,Zhang,H.,et al.,2013.Carbon pricing model power generation enterprises in electricity markets.Electr.Power 46(10),151-154(in Chinese).
Wang,T.,Watson,J.,2010.China's Energy Transition-Pathway for Low-Carbon Development.Tyndall Center For Climate Change Research.
Wang,X.,Wang,Y.,2016.Powerindustry carbon emissionsprediction based on system dynamics.Shanxi Electr.Power 44(06),29-33(in Chinese).
Wang,Z.,Zhang,J.,Pan,L.,2010.Emission Reduction of China's Power Sector in 2010:Air Pollutant Control of Coal-Fired Power Plants.China Market Publishing House,Beijing.
Yin,X.,Chen,W.,2013.Scenario comparison of carbon emissions in China based on the TIMES model.J.Tsinghua Univ.(Natural Science)53(9),1315-1321(in Chinese).
Zhang,S.,2011.Impacts of carbon tax on the power sector-modeling with CSGM.Energy Technol.Econ.23(03),11-16(in Chinese).
Zhang,Y.,Cheng,L.,2015.Major issues on the development of China's power sector in the 13thFive-Year Plan period and beyond.Electr.Power 48(1),1-4(in Chinese).
Zheng,S.,Sun,Z.,2017.On carbon pricing mechanism in the emissions trading pilot.Electr.Power 39(4),9-14(in Chinese).
Zhou,N.,Fridley,D.,McNeil,M.,et al.,2011.China's Energy and Carbon Emissions Outlook to 2050.Lawrence Berkeley National Laboratory,California,USA.
Zhu,D.,Kong,Y.,Gao,Y.,et al.,2015.A study of CO2abatement cost and potential of China's power sector.China Popul.Resour.Environ.25(11),14-20(in Chinese).
Zhu,R.,2011.Scenario Comparison for the Selection of CO2Control Scheme for China's Power Sector Based on the TIMES Model.Beijing Jiaotong University,pp.34-50(in Chinese).
 Advances in Climate Change Research2018年1期
- Advances in Climate Change Research的其它文章
- Multi-model comparison of CO2 emissions peaking in China:Lessons from CEMF01 study
- Analysis on energy demand and CO2 emissions in China following the Energy Production and Consumption Revolution Strategy and China Dream target
- Co-controlling CO2 and NOx emission in China's cement industry:An optimal development pathway study
- A cautionary note on decadal sea level pressure predictions from GCMs
- Future temperature changes over the critical Belt and Road region based on CMIP5 models
- Climate change projections for the Middle East-North Africa domain with COSMO-CLM at different spatial resolutions