
Multimodal Learning Using Haar Scattering Transform
2019-10-30 10:21WANGJuanZHAOJie
WANG Juan, ZHAO Jie
(College of Science, Zhongyuan University of Technology, Zhengzhou, Henan Province, 450007, China)
Abstract: In this paper, we propose a novel application of Haar scattering transform to learn features over multiple modalities data. A series of tasks for multimodal learning are presented, and the way of multimodal feature learning is shown. Furthermore, we validate our methods on several datasets with an classification task,demonstrating that the approach is effective.
Key words: Multimodal learning; Haar scattering transform; Classification task
§1. Introduction
In the real world, information usually comes through different input channels. Each input channel is considered as a modality,and different modalities convey different information. This motivates the study of multimodal learning,which is able to provide a joint representation that can capture the correlation information between different modalities.
Haar scattering transform recently introduced by X. Chen, et al. implemented with a deep series of additions, subtractions and absolute values. It has been successfully applied to classification tasks [1]. To our best knowledge,Haar scattering transform has not been applied to Multimodal learning. In this work, we examine multimodal learning and illustrate how to employ Haar scattering transform to learn multimodal representations.
As a matter of fact, there have been a few of other approaches to learning from multimodal data. In 2005, dual-wing harmoniums were used to build a joint model of images and text [2].In 2011, Ngiam et al. [3] used a deep autoencoder for speech and vision fusion. In particular,approach [4] based on the multiple kernel learning framework further demonstrated that an additional text modality can improve the accuracy of SVMs on various object recognition tasks.
In the following section, we first describe the background of our model in Section 2. Next,Section 3 present multimodal Haar scattering transform in detail. We then report experimental results in Section 4. Finally, concluding remarks are appeared in the last section.
§2. Background: Haar Scattering Transform and Its Generalization
A graph can describe the geometric structure of a data domain with neighbor data points related by an edge [5]. Unfortunately, graph information of data is usually unaware. Therefore, it’s necessary that the graph must be estimated from data through an effective method.Recovering the fill graph geometry of unstructured signa [1]. To avoid the complex issue, it is sufficient to compute Haar scattering representations. Multiscale neighborhoods are estimated by minimizing an average total signal variation over training examples.
2.1 The Haar Wavelet Transform
The Haar wavelet is the simplest possible wavelet, but it is not continuous, which means that it is not differentiable. However, this property becomes an advantage for the analysis of signals with sudden transitions, such as monitoring of tool failure in machines [6].
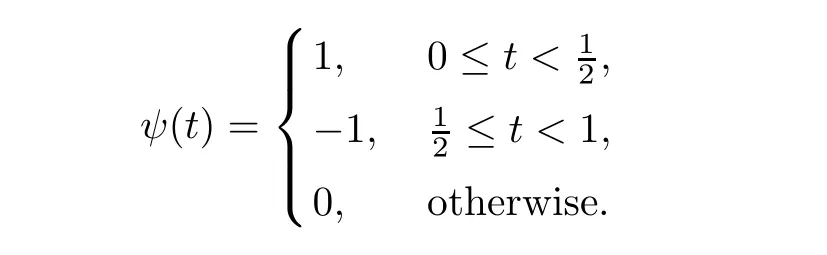
The mother wavelet function ψ(t) of the Haar wavelet can be defined by the following formula,
Its scaling function φ(t) is given in the following formula,

For every pair (j,k) ∈Z ×Z, the Haar function ψj,kand scaling function φj,kare defined as follows,

and


Figure 1: Haar scattering transform. It can be seen as a network which iterates over Haar wavelet transform and absolute values.
Suppose that L2(Rd) exists sub-space sequence {Vj}, where j =0,1,2,··· , satisfying that

Let Wjbe the orthogonal complement space of Vjrelative to Vj+1, that is,Suppose that {φj,k}kis orthogonal basis functions of Vj, and {ψj,k}kis orthogonal basis functions of Wj. Hence, {φj,k,ψj,k}kconstitutes the orthogonal basis of Vj+1. We also assume that x is a signal in l2(Z), where the number of elements in x is power of 2. Suppose that n is the total number of elements in x. Applying Haar wavelet transform to x, we have

where x ∗φ is average,x ∗ψ is detail information and n=21,22,···.
2.2 Haar Scattering Transform
Wavelet transform has a huge number of applications in science, engineering,mathematics,and so on. However, wavelet transform has two disadvantages [7]: on the one hand, it is not translation invariant; on the other hand, average of wavelet coefficients does’t produce any information since mean of wavelet is zero. So it is necessary to introduce nonlinear[1]advanced the Haar scattering transform which iterates a cascade of orthogonal Haar wavelet transforms and absolute values. Suppose that (ji,k)=λi∈Z ×Z and ψji,k∈Vji,k. The implementation of Haar scattering transform is illustrated in Figure 1.
Now, we analyze the output of each layer. It is easy to find that the scattering coefficients of the first layer (J=1) are

The scattering results of the second layer (J=2) are

The scattering outcome of the third layer (J=3) is

The scattering output of the fourth layer (J=4) is

By analogy,we can understand the transform coefficients of the deeper layers(J =5,··· ,the largest scale) of the Haar scattering transform. For simplicity, we use HJto denote the Haar scattering transform coefficients of all layers.
Suppose that m ∈Z+is the number of the required layers. When the number of absolute values of the transform coefficients in the largest scale layer is less than or equal to m, then the set of the transform coefficients can be denoted by Hm, which is considered as a representation of the image.
§3. Multimodal Haar Scattering Transform
We illustrate the construction of a multimodal Haar scattering transform using bimodal Haar scattering transform as our running examples. Consider modeling each data modality using separate Haar scattering transforms. The model is shown in Figure 2. In fact, In order to maintain the size of the samples, we add examples that zeros out one of input modalities,and only have the other modality available. In this study,modalities of data adopted are model 1 (the first half of a sample), model 2 (the latter half of a sample) and model 3 (the whole sample).
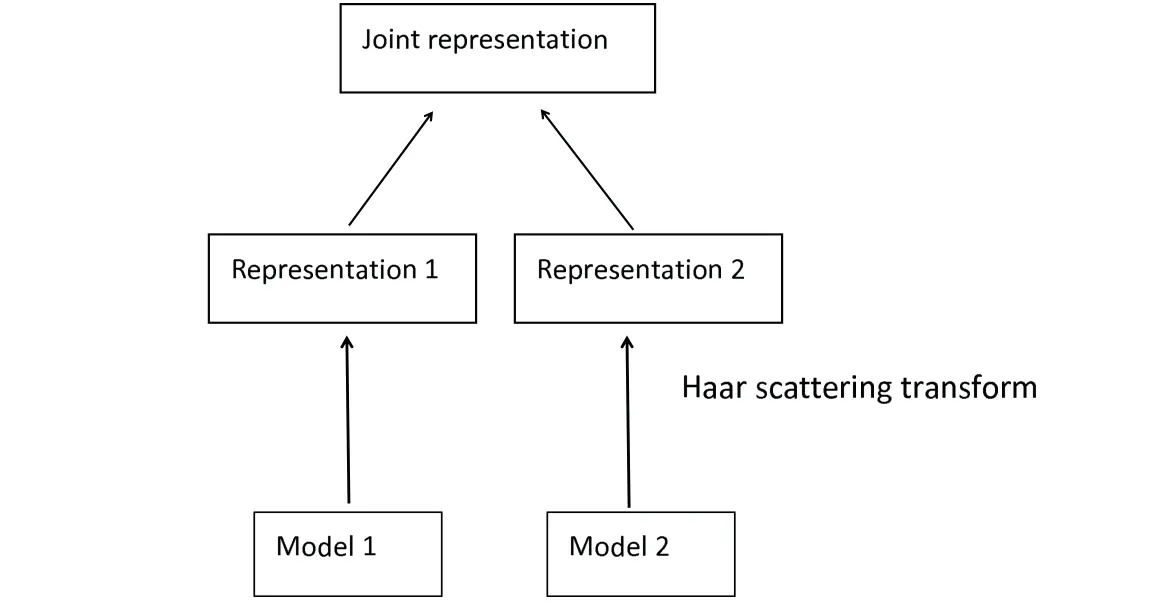
Figure 2: Multimodal Haar scattering transform. It models the joint representation over Model 1 and Model 2 inputs.
§4. Experiments
We evaluate our method on some different datasets. The performance of multimodalities learning is measured in terms of success rate. The parameters are set as follows. The number of scale is 7, and the number of layers needed is 2. A software package is available at www.di.ens.fr/data/scattering/haar.
Since we have no ready-made multimodality data,some artificial multimodality datasets are adopted in this work. In this experiment, three multimodality datasets are constructed from MNIST dataset, BSD300-images dataset and Original Brodatz dataset respectively. Firstly,MNIST dataset, which is used for training and testing in the field of machine learning [8],contains 60,000 training images and 10,000 testing images. For MNIST dataset, in order to avoid confusion, the digit “9” are removed. 1000 samples are randomly taken out from each class, size of each sample is 28*28. The first half of each sample is regarded as model 1, the latter half of each sample is used as model 2 and every whole image is considered as model 3.Therefore, the first dataset constructed contains a total of 27000 images.
The experimental results,presented in Table 1,compare the classification performance using model 1, model 2, model 1 + model 2 and model 1 + model 2 + model 3. From Table 1, we observe that when only model 1 is used, the average success rate is 38.09%, and when only model 2 is employed,the mean success rate obtained is 38.98%. Interestingly,the mean success score of 98.20%acquired by combining model 1 and model 2 is significantly above the winning score which used model 1 alone, model 2 alone, respectively. On average, the improvement is 0.41%, when model 1, model 2 and model 3 are combined.
The number of images correctly classified is shown in Fig. 3. Fig. 3 demonstrates that the quantity of images correctly classified is markedly increased by combining model 1 and model 2.

Table 1: Classification performance for bimodal classification on MNIST, under model 1, model 2, model 1 + model 2 and model 1 + model 2 + model 3.
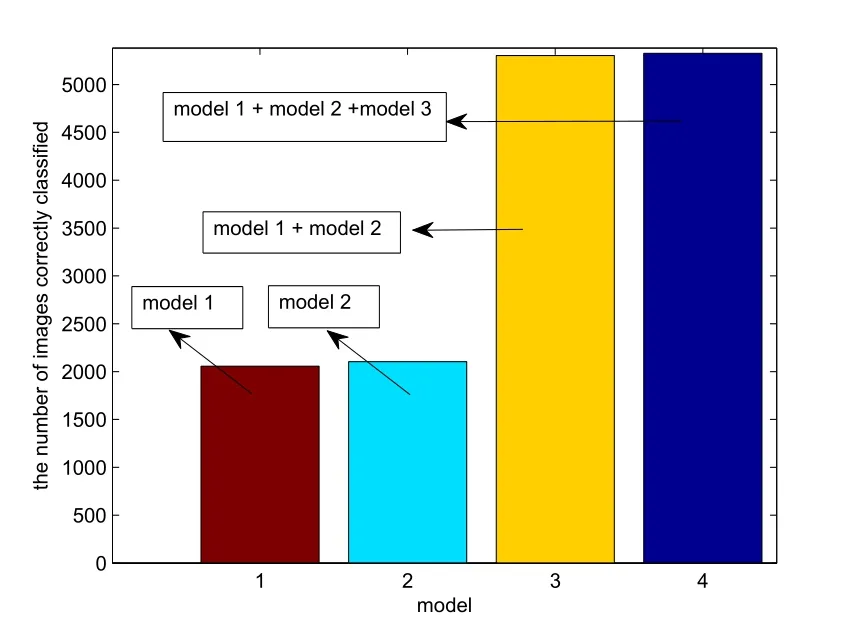
Figure 3: The number of images correctly classified on MNIST, under model 1, model 2, model 1 + model 2 and model 1 + model 2 + model 3.
Then, BSDS300-images dataset contains a training set of 200 images and a test set of 100 images [9]. For BSDS300-images dataset, randomly selecting 9 images from the training set is used in this study. 1000 image blocks each of 28*28 size of per images are randomly generated and used for the study. In a similar manner, multimodality database containing 27000 image blocks is realized.
The experimental results, exhibited in Table 2, analogously compare the classification performance using model 1,model 2,model 1+model 2 and model 1+model 2+model 3. Table 2 manifests that when only model 1 is used, the average success rate is 71.17%,and when only model 2 is adopted, the mean success rate obtained is 70.63%. Surprisingly,when model 1 and model 2 are taken together then the average success rate is 95.30%,which greatly improves the average winning score acquired by employing model 1 alone,model 2 alone,respectively. Comparing with the mean success rate obtained by combining model 1 and model 2, the increment of the average success rate is only 2.64% when model 1, model 2 and model 3 are combined.
The number of images correctly classified is shown in Fig. 4. The amount of images correctly classified is markedly increased by combining model 1 and model 2 as shown in Fig. 4.
Finally, Original Brodatz databse contains a total of 112 texture photographs [10]. For Original Brodatz dataset, 27000 image tiles are created in a similar way with the method BSD300-images dataset used.
The experimental results, exhibited in Table 3, analogously compare the classification per-formance using model 1,model 2,model 1+model 2 and model 1+model 2+model 3. Table 3 manifests that when only model 1 is used, the average success rate is 70.13%,and when only model 2 is adopted, the mean success rate obtained is 70.87%. Surprisingly,when model 1 and model 2 are taken together then the average success rate is 98.65%,which improves remarkably the average winning score employed model 1 alone, model 2 alone, respectively. Comparing with the mean success rate obtained by combining model 1 and model 2, the increment of the average success rate is only 0.04% when model 1, model 2 and model 3 are combined.

Table 2: Classification performance for bimodal classification on BSDS300-images dataset,under model 1, model 2, model 1 + model 2 and model 1 + model 2 + model 3.
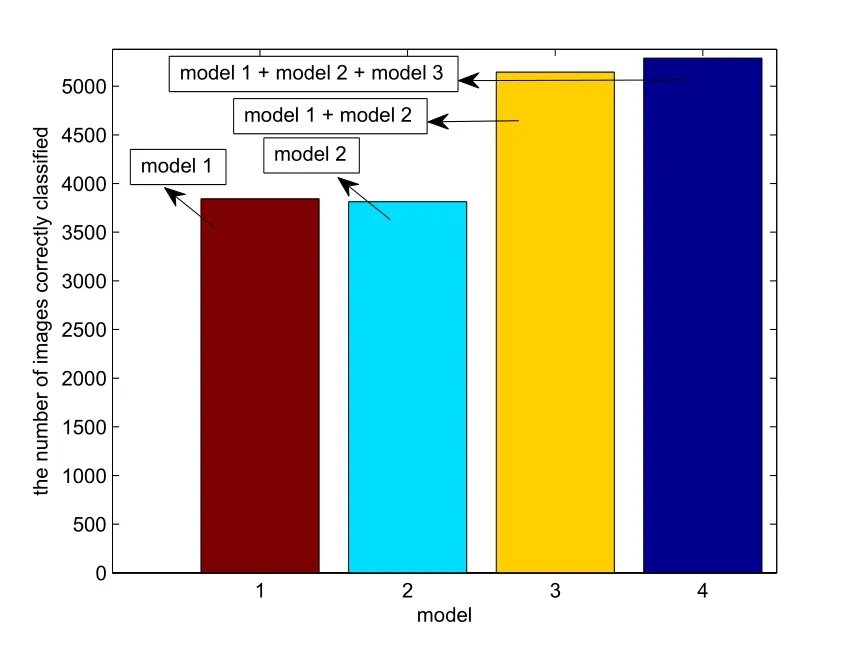
Figure 4: The number of images correctly classified on BSDS300-images dataset, under model 1, model 2, model 1 + model 2 and model 1 + model 2 + model 3.

Table 3: Classification performance for bimodal classification on Original Brodatz dataset,under model 1, model 2 and model 3.
The number of images correctly classified is shown in Fig. 5. The quantity of images correctly classified is markedly increased by combining model 1 and model 2 as shown in Fig.5.

Figure 5: The number of images correctly classified on Original Brodatz dataset, under model 1, model 2, model 1 + model 2 and model 1 + model 2 + model 3.
§5. Conclusion
In this study, multimodal Haar scattering transform is proposed, that is, Haar scattering transform is employed to learn multimodal feature from a dataset. The performance is measured in terms of success rate. The experiments show that performance of Haar scattering transform on the classification tasks can be greatly improved by combining multi models. These experimental results support the effectiveness and efficiency of multimodal Haar scattering transform.
Declarations
Acknowledgments: The author would like to thank the reviewers for their valuable comments and helpful suggestions to improve the quality of this paper. The part of this work was done while the author was visiting school of mathematics and applied statistics, University of Wollongong, Australia.
Funding: This work has been supported by Natural Science Foundation of China(No.11626 239),China Scholarship Council(No.201708410483),as well as Foundation of Education Department of Henan Province (No.18A110037).
Availability of supporting data: Not applicable.
Competing interests: The authors declare that they have no competing interests.
Authors contributions: All authors read and approved submit the manuscript.
 Chinese Quarterly Journal of Mathematics2019年3期
- Chinese Quarterly Journal of Mathematics的其它文章
- Normality Criteria of Zero-free Meromorphic Functions
- On Uniqueness Problem of Meromorphic Functions Sharing Values with Their q-shifts
- Algorithm on the Optimal Vertex-Distinguishing Total Coloring of mC9
- Finite Difference Methods for the Time Fractional Advection-diffusion Equation
- Globally Bounded Solutions in A Chemotaxis Model of Quasilinear Parabolic Type
- Triple Positive Solutions for a Third-order Three-point Boundary Value Problem