
Continental chemical weathering during the Early Cretaceous Oceanic Anoxic Event(OAE1b):a case study from the Fuxin fluvio-lacustrine basin,Liaoning Province,NE China
2020-06-23 02:35XiaoTaoXuLongYiShaoBoLanShuaiWangJasonHiltonJianYiQinHaiHaiHouandJieZhao
Journal of Palaeogeography 2020年2期
Xiao-Tao Xu,Long-Yi Shao,Bo Lan,Shuai Wang,Jason Hilton,Jian-Yi Qin,Hai-Hai Hou and Jie Zhao
Abstract
Keywords:Chemical weathering indices,Land surface temperature,Mudstone,Greenhouse conditions,Ocean Anoxic Event 1b,Black shales
1 Introduction
The Cretaceous is widely recognised as a greenhouse period in Earth history (Wang 2006; Keller 2008; Wang et al. 2014b), with temperatures in the Early Cretaceous warmer and the latitudinal temperature gradient much lower than the present day (Huber et al. 2002; Pucéat et al. 2003). However, some studies suggest that episodic cooling might also have occurred during the Early Cretaceous (e.g., Frakes 1999; Price 1999; Pucéat et al. 2003;Amiot et al. 2011), and short-term variations of atmospheric CO2suggest that equable climates may have been interrupted by periods of climatic change including Oceanic Anoxic Events (OAEs) (Jenkyns 2003; Wang et al. 2014b). Other rapidly changing geological phenomena also were likely to contribute to climatic variation at this time, including eruptions of Large Igneous Provinces(LIPs)(Coffin and Eldholm 1994),rapid increases in ocean crust production (Larson 1991) and Cretaceous Oceanic Red Beds (CORBs) (Wang et al. 2005; Hu et al. 2006).These differing palaeoclimate signals suggest that the greenhouse climates of the Cretaceous may have been transient rather than persistent(Retallack 2009).
Previous Cretaceous palaeoclimate studies have mainly focused on marine deposits (e.g., Wang et al. 2005; Hu et al. 2006; Keller 2008). This is due to the globally high sea level during the Cretaceous (Larson 1991), their overall net deposition, and good stratigraphic control (Gao et al.2017;Xi et al.2019).By contrast,little is known from continental records that are typically less complete due to sedimentary erosion and hiatuses,and are much harder to accurately correlate stratigraphically (Wang et al. 2009;Wu et al. 2014; Gao et al. 2017; Cao 2018). Wang et al.(2009) proposed that geologic records retained in continental sediments are important to establish a global climatic model throughout the Cretaceous and to gain a complete interpretation of change mechanisms for Cretaceous climates.Importantly,continental weather regimes determine the levels of nutrients flushed from continents into marine systems through run-off and river systems(Jenkyns 1999,2003;Erba 2004).In this context,continental weathering exhibits a strong influence on oceanic nutrient levels that can in turn affect marine bio-productivity(Jenkyns 1999,2003;Leckie et al.2002;Erba 2004).Therefore, systematic investigations of continental sediments during the Cretaceous deserve further attention in order to evaluate the influence of palaeoclimatically driven chemical weathering on the flux of nutrients entering into the oceans through time, and to analyse the relationship between the changing nutrient inputs and the oceanic processes such as ocean anoxic events.
Chemical weathering displays a strong sensitivity to climate, with temperature and humidity proposed as potential drivers for chemical weathering rates (Nesbitt and Young 1982). Chemical weathering strongly affects major-element geochemistry (Fedo et al. 1995). Among the major elements, mobile elements such as Ca, Na and K are leached and gradually lost in the form of ions during chemical weathering of the upper crust, while immobile elements such as Al and Ti readily accumulate in weathering residues (Nesbitt and Young 1982). The ratio of mobile to immobile elements of mudstones can potentially be used as a proxy for chemical weathering conditions, using methods such as the Chemical Index of Alteration (CIA; Nesbitt and Young 1982) and the Mafic Index of Alteration for Oxidative weathering environments (MIA(O); Babechuk et al. 2014). In addition, the bond strengths with oxygen of the most mobile alkali and alkaline elements can also be used as weighting factors for the degree of chemical weathering, such as the Weathering Index of Parker (WIP; Parker 1970).
In the present paper the geochemistry of mudstones from the Fuxin Cretaceous continental basin in NE China has been examined in order to reconstruct the timing and rates of chemical weathering using CIA,WIP and MIA(O).We use this information to evaluate conditions that control weathering rates including temperature and humidity.The Index of Compositional Variability (ICV; Cox et al.1995) is used to exclude the influence of sediment recycling and further weathering in sedimentary areas, and the effect of potassium metasomatism on chemical weathering indices is also excluded based on the A-CN-K [Al2O3-(CaO*+Na2O)-K2O]triangular diagram(Fedo et al.1995)or CIAcorr.formula (Panahi et al. 2000). We investigate the Early Cretaceous Shahai and Fuxin formations as a case study, and from our results emphasize the implications of continental chemical weathering conditions on contemporaneous lake and ocean anoxia.
2 Geological setting
The Fuxin continental faulted basin, located in western Liaoning Province in northeastern China (Fig. 1a),formed in the Late Jurassic to Early Cretaceous. The basin is situated in the northeast zone of the North China Plate, within a triangular area between the Tanlu and Chifeng-Kaiyuan faults (Fig. 1a) (Wang et al. 1998;Zhu et al. 2007). During the Middle and Late Jurassic,western Liaoning Province was in an unstable tectonic setting due to the southward movement of the Siberian Plate and the northwest subduction of the Pacific Plate(Wang et al. 2001; Zhang 2006). Magmatic activity related to a mantle plume contributed to the development of faulted basins (Okada 1999) and large-scale volcanic eruptions in the margin of eastern Asia during the Early Cretaceous. The Fuxin Basin occupied a palaeolatitude of ~45°N during the Early Cretaceous, where the overall temperature was relatively high (Boucot et al. 2009; Li and Jiang 2013).

Fig. 1 a - Location map of the Fuxin Basin,Liaoning Province,northeastern China(modified after Wang et al.1998;Zhu et al.2007).b-Stratigraphic distribution of the Fuxin Basin(modified after Sun 2006);c-Geological sketch diagram showing stratigraphy of the Early Cretaceous in Fuxin Basin and flora assemblages in Liaoxi regional stage(modified from Deng et al.2012;Wan et al.2013;Xi et al.2019).I,II,III and IV represent the first,second,third and fourth members of the Shahai Formation,respectively
The Fuxin Basin is bounded by the Lvshan Fault to the east and the Songling Fault to the west, with both faults are NNE-trending (Liu and Chen 1995). It extends from Shala city in the north to the Dalinghe Fault in the south(Fig. 1b) and overlies Archean and Middle Proterozoic strata. Within the basin sedimentary caps are represented by Cretaceous and Cenozoic strata.From the oldest to the youngest, the Lower Cretaceous strata of the Fuxin Basin comprise the Yixian, Jiufotang, Shahai, Fuxin and Sunjiawan formations (National Commission on Stratigraphy of China 2014). Wan et al. (2013) classified the Lower Cretaceous into the Jibei, Jehol and Liaoxi regional stratigraphic stages according to the stratigraphic succession and fossil assemblage from the Songliao Basin to the north of the Fuxin Basin and the northern Hebei to western Liaoning Province.Among them,the Liaoxi regional stage includes from the oldest to the youngest the Shahai,Fuxin and Sunjiawan formations (Fig. 1c), and contains the Fuxin flora.The Fuxin flora is characterized by a dominance of ferns, Ginkgoales and conifers, with abundant Cycads and Equisetales. This flora can be subdivided into three distinct assemblages, comprising in the Shahai Formation the Acanthopteris-Ginkgo coriacea assemblage, in the lower-middle part of the Fuxin Formation the Ruffordia goepperti-Dryopterites assemblage, and in the upper part of the Fuxin Formation the Ctenis lyrata-Chilinia assemblage(Deng et al.2012).
The middle and upper parts of the Yingcheng Formation and Denglouku Formation in the Songliao Basin correspond to the Shahai Formation and Fuxin Formation in the Fuxin Basin respectively (Xi et al. 2019).Huang et al. (2011) presented zircon U-Pb isotopic ages from volcanic rocks and pyroclastic rocks in the Yingcheng Formation analysed by LA-ICPMS and SHRIMP methods, which provided zircon ages with peaks at 105-112 Ma. Results show that the Yingcheng and Shahai formations were deposited during the late Aptian-early Albian. The Cicatricosisporites exilis-Hymenozonotriletes mesozoicus assemblage of the Denglouku Formation is a typical Albian flora in North China. Kraeuselisporites majus, Scopusporis lautus and Balmeisporites holodictyus in this assemblage are found in North America and Australia during the Albian (Huang et al. 2011). According to previous studies, it can be inferred that the Fuxin Formation was deposited during the Albian. The Fuxin Formation was mainly formed in alluvial fan, fan delta and fluvial depositional systems (Xu et al. 2020), while the underlying Shahai Formation represents a set of sedimentary strata mainly deposited in alluvial fan, fan delta and lacustrine depositional systems (Cai et al.2011). From the bottom to the top the Shahai Formation can be divided into the first, second, third and fourth members (Fig. 1c). We investigate mudstones in the Shahai and Fuxin formations.
3 Methods
3.1 Materials and analytical methods
The DY-1 (41° 52′ 45″ N - 121° 37′ 8″ E) and FY-1 (41°56′ 56″ N - 121° 36′ 60″ E) boreholes are located in the central part of the Fuxin Basin,near Dongliang City.From these cores 80 mudstone samples (DY-1=50; FY-1=30)were collected using a stratified sampling strategy from the bottom to the top of the Shahai and Fuxin formations.Approximately 50 m vertical distance was maintained between samples. For each sample 300 g was collected and retained in air tight,zip-lock plastic bags.Previous studies have shown that mudstones of the Shahai Formation were mainly composed of clay minerals, quartz, feldspar and carbonate minerals, with pyrite present in small amounts or absent. Identified clay minerals include mixed-layer illite-smectite, illite, chlorite and little kaolinite (Chen et al. 2018; Kang et al. 2019). Mudstones contain abundant chemical weathering products derived from their source rocks, allowing the chemical weathering history in the source area to be revealed(Garzanti et al.2013).
Analyses and tests for major and trace elements were undertaken at the Analytical Laboratory of the Beijing Research Institute of Uranium Geology. Major elements were analysed using an AB104L X-ray fluorescence spectrometer(10271), an AL104 X-ray fluorescence spectrometer(10273), and an Axiosm AX X-ray fluorescence spectrometer (10482). The test procedures followed the methods outlined in Methods for Chemical Analysis of Silicate Rocks-Part 14: Amount Measurement of Ferrous Oxide(GB/T 14506.14-2010), and Methods for Chemical Analysis of Silicate Rocks-Part 28: Determination of 16 major and minor elements content (GB/T14506.28-2010). Trace elements (including rare earth elements) were measured using an ELEMET XR plasma mass spectrometer (9443),following the Methods for Chemical Analysis of Silicate Rocks-Part 30:Determination of 44 elements.
3.2 Chemical Index of Alteration (CIA)
The CIA was defined by Nesbitt and Young (1982) based on the relationship between alumina and alkalis in mudstones, with CIA values being used to assess the chemical weathering degree of provenance. The formula for calculating the CIA using molecular proportions is as follows:

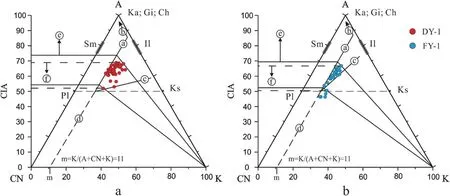
where CaO* represents CaO in silicate-bearing minerals only, and the CaO from non-silicate minerals (carbonate and phosphate) is excluded using the methodology proposed by McLennan (1993). The content of CaOrest=CaO −(10/3)×P2O5, if CaOrest High CIA values indicate that little Ca, Na and K remains during the chemical weathering process in the residue relative to stable Al and Ti, which reflects the relatively intense chemical weathering degree in warm and humid climate (Fedo et al. 1995). Conversely, low CIA values reflect the relatively weak chemical weathering degree in cold and dry climate. Fedo et al. (1995)concluded that CIA values between 50 and 60 indicate a low degree of chemical weathering, values between 60 and 80 indicate a moderate degree of chemical weathering, while the CIA values >80 indicate an extreme degree of chemical weathering. The WIP was established as a chemical weathering index based on the proportions of alkali and alkaline earth metals (sodium, magnesium, potassium and calcium).These elements are the most mobile of the major elements, and their bond strengths with oxygen are also considered (Parker 1970). According to the WIP definition, low WIP values indicate strong chemical weathering, which is the opposite of the CIA. The WIP formula,using molecular proportions, is as follows: where CaO* indicated in the WIP formulation is the same as that defined in CIA. Babechuk et al.(2014)proposed the Mafic Index of Alteration that extends the equation of the CIA to include the mafic elements Mg and Fe.Among these,the preservation form of Fe is affected by redox environment during the weathering of mafic minerals. In oxidative weathering environments, Fe is retained in the form of ferric iron(Fe3+)(Driese 2004), and total iron (total iron is expressed as Fe2O3(T)) is considered an immobile element along with Al (Babechuk et al. 2014). The Mafic Index of Alteration for Oxidative weathering environments (MIA(O)) formula using molecular proportions is as follows: where CaO* indicated in the MIA(O)formulation is the same as that defined in CIA. The high MIA(O)value indicates a high degree of chemical weathering, while the low value reflects opposite condition (Babechuk et al.2014). The ICV as proposed by Cox et al. (1995) is applied to mudstones as a measure of compositional maturity. It is used to determine whether the rocks in provenance undergo sediment recycling (Cullers and Podkovyrov 2000). The ICV formula, using molecular proportions, is as follows: Compositionally mature mudstones have low ICV values <1, whereas compositionally immature mudstones have high ICV values >1 (Cullers and Podkovyrov 2000).Furthermore, compositionally mature mudstones may undergo sediment recycling or intense chemical weathering under the first-cycle sedimentary conditions (Barshad 1966), and compositionally immature mudstones tend to be found in tectonically active settings and are first-cycle deposits(Kamp and Leake 1985). Climatic variation strongly affects chemical weathering intensity, and warm temperatures are beneficial to chemical weathering(Nesbitt and Young 1982).Li and Yang(2010)proposed that CIA values are sensitive to land surface temperature and latitude according to the analyses of suspended sediment in modern large-river estuaries. Yang et al. (2014) demonstrated a linear relationship between CIA and temperature from low to high latitudes, and the linear relationship formula is as follows: where T represents land surface temperature (in°C),which has a positive correlation with CIA. In this study,we used this linear relationship to estimate land surface temperature of the Shahai and Fuxin formations. The major element concentrations are shown in Table 1.In this study, all the major elements are normalized using Post Archean Australian Shale (PAAS) values(Taylor and McLennan 1985) and plotted in Fig. 2. The variations of major elements normalized by PAAS from the DY-1 core indicate that most of the SiO2, TiO2and Al2O3contents are lower than the PAAS, but the Na2O content is higher than the PAAS. Contents of Fe2O3, MgO and K2O are not much different from the PAAS, nevertheless, the content ranges of MnO, CaO and P2O5vary greatly (Fig. 2a). The average contents of major elements (Table 1) in the DY-1 core can be summarized as SiO2>Al2O3>Fe2O3>K2O>MgO>CaO>Na2O>TiO2>P2O5>MnO. Among them, the contents of SiO2(45.97%-65.50%, average 56.97%) and Al2O3(11.99%-19.02%, average 15.31%) are relatively high. The average contents of Fe2O3(3.43%-8.00%, average 5.71%),K2O (2.55%-5.13%, average 3.43%), MgO (1.09%-5.11%,average 2.62%), CaO (0.43%-8.80%, average 2.37%) andNa2O (0.84%-2.70%, average 1.88%) are higher than 1%.Whereas the average contents of TiO2(0.56%-1.06%,average 0.74%), P2O5(0.02%-0.64%, average 0.21%) and MnO (0.02%-0.18%,average 0.08%) are all below 1%. Table 1 Major element compositions (in wt.%) of mudstones from the Shahai and Fuxin formations in Fuxin Basin Table 1 Major element compositions (in wt.%) of mudstones from the Shahai and Fuxin formations in Fuxin Basin (Continued) Fig. 2 PAAS-normalized major element patterns for mudstones from the Shahai and Fuxin formations, Fuxin Basin, Liaoning Province,northeastern China.a -borehole DY-1;b -borehole FY-1.PAAS values used here are from Taylor and McLennan(1985) The distributions of major elements from the FY-1 borehole are presented in Fig. 2b. Most of the SiO2,TiO2, Al2O3and K2O contents are lower than the PAAS, the Fe2O3and MnO contents are similar to the PAAS. Nevertheless, the variation of MgO, CaO, Na2O and P2O5contents are relatively large, among them, the variation range of CaO content is the most obvious.According to Table 1, the order of major element average contents is as follows: SiO2>Al2O3>Fe2O3>CaO>MgO>K2O>Na2O>TiO2>P2O5>MnO. The contents of SiO2(45.65%-67.28%, average 55.13%) and Al2O3(10.03%-16.02%, average 13.86%) are relatively high. The average contents of Fe2O3(4.44%-11.64%,average 5.75%), CaO (0.88%-12.11%, average 4.36%),MgO (1.38%-8.38%, average 2.92%), K2O (2.22%-3.60%, average 2.85%) and Na2O (1.14%-3.89%, average 2.10%) are higher than 1%. While the average contents of TiO2(0.45%-0.77%, average 0.64%), P2O5(0.12%-0.31%, average 0.17%) and MnO (0.05%-0.50%, average 0.11%) are all less than 1%. The results of rare earth element (REE) analysis are given in Table 2 and are shown as chondrite-normalized patterns (Boynton 1984) in Fig.3. The chondrite-normalized REE patterns (Fig. 3a) are characterized by enriched LREE (light rare earth element; LREE=La+Ce+Pr+Nd+Sm+Eu) and depleted HREE (heavy rare earth element; HREE=Gd+Tb+Dy+Ho+Er+Tm+Yb+Lu). The LREE distribution curves are relatively steep, while the curves of the HREE are relatively flat. These curves show an obvious “V” shape at Eu, indicating negative Eu anomalies. According to Table 2, the ∑REE (total rare earth elements; ∑REE=LREE+HREE) content of mudstones from the DY-1 borehole vary from 115.14-265.76 ppm, with a mean of 189.41 ppm. The LREE contents vary from 106.49-242.74 ppm, with an average of 173.69 ppm, and account for 91.70% of the∑REE contents, while HREE contents vary from 8.65-26.81 ppm, with a mean of 15.72 ppm, and account for 8.30%. δEu (δEu=(Eu / EuN) / [(Sm / SmN)×(Gd/ GdN)]1/2) values in the DY-1 borehole core vary from 0.36-0.80, with an average of 0.65. The chondrite-normalized REE patterns of the mudstones in FY-1 borehole (Fig. 3b) are also characterized by relatively enriched LREE and depleted HREE,and negative Eu anomalies. The ∑REE contents (Table 2) in the FY-1 borehole vary from 121.01-219.66 ppm, with an average of 178.23 ppm. The LREE contents vary from 111.17-203.55 ppm, with a mean of 163.05 ppm, and account for 91.48% of the ∑REE contents, while HREE contents vary from 9.84-18.06 ppm, with a mean of 15.18 ppm, accounting for 8.52%. δEu values range from 0.59-0.75, with an average of 0.66. The geological weathering parameters CIA, WIP and MIA(O), and the land surface temperature for the Shahai and Fuxin formations are given in Table 1. In the DY-1 borehole, CIA varies from 52.0-69.0, with an average of 63.8; WIP varies from 33.2-65.5, with an average of 47.0; and MIA(O)varies from 42.6-63.7, with an average of 57.4. The land surface temperatures range from 4.9-16.1°C, with an average of 11.9°C. CIA values in the FY-1 borehole vary from 46.3-66.7, with an average of 59.3; WIP varies from 34.2-77.9, with an average of 51.5; and MIA(O)varies from 32.3-65.2, with a mean of 52.6. In the FY-1 borehole, the land surface temperatures vary between 0.6-13.1°C,with an average of 8.4°C. ? ? ? Fig. 3 Chondrite-normalized rare earth element patterns for mudstones from the Shahai and Fuxin formations in Fuxin Basin. a - borehole DY-1;b - borehole FY-1. Chondrite normalization values are from Boynton (1984). Mudstones from the two boreholes have similar REE distribution patterns which show LREE enrichment, negative Eu anomaly and flat HREE distribution The REE and immobile trace elements are widely used to discriminate the composition of parent rocks (Cullers 2000; Paikaray et al. 2008; Saha et al. 2010; Armstrong-Altrin et al. 2013; Qiu et al. 2015). Previous studies have used the concentrations of Cr and Ni in siliciclastic sediments as an indicator of source rocks (Garver et al.1996; Armstrong-Altrin et al. 2018; Hernández-Hinojosa et al. 2018; Ramos-Vázquez and Armstrong-Altrin 2019). Garver et al. (1996) proposed that high Cr and Ni abundance (Cr >150 ppm and Ni >100 ppm) are indicative of ultramafic source rocks. In addition, the Al2O3/TiO2ratio in terrigenous sediments can be used to reflect the properties of the provenance source (Girty et al.1996; Hayashi et al. 1997; Armstrong-Altrin et al. 2017).Hayashi et al. (1997) demonstrated that the Al2O3/TiO2ratios from 3 to 8 indicate mafic igneous rocks, ratios of 8-21 indicate intermediate igneous rocks, while ratios between 21 and 70 indicate felsic igneous rocks. The REE patterns and the size of the Eu anomalies in sediments have been used to infer source rock characteristics (Cullers 1994; Saha et al. 2018). Felsic igneous rocks usually contain high LREE/HREE ratios and negative Eu anomalies, whereas mafic igneous rocks contain low LREE/HREE ratios and tend to lack Eu anomalies(Cullers 1994,2000). In this study, the low Cr (38.50-143.00 ppm, average 93.40 ppm) and Ni (22.00-98.30 ppm, average 48.65 ppm) values from the DY-1 borehole and low Cr(58.80-130.00 ppm, average 91.10 ppm) and Ni (29.30-58.80 ppm, average 43.05 ppm) values from the FY-1 borehole illustrate an absence of sediments derived from ultramafic source rocks (Table 2). In the Al2O3-TiO2plot, most of the studied mudstone samples fall near the intermediate and felsic igneous rock fields (Fig. 4a).According to the La/Sc-Th/Co diagram proposed by Cullers (2002), the mudstone samples of the two boreholes mainly reveal silicic rocks as probable provenance (Fig. 4b). The mudstone samples were also plotted into the V-Ni-Th×10 plot of Bracciali et al. (2007), which shows that samples mainly fall close to the felsic rocks field while some samples shift toward the mafic rocks field (Fig. 4c). Therefore, this plot reveals the dominance of felsic source rocks and some input of mafic source rocks. REE values in the DY-1 and FY-1 boreholes suggest relatively stable geochemical properties in the sedimentary process, and similar REE patterns indicate sediments from the same type of provenance (Boynton 1984; Taylor and McLennan 1985; Cullers et al. 1987; Wang et al. 2014a).REE patterns(Fig.3a and b)of mudstone samples from the Shahai and Fuxin formations show the similar distribution curves with the enrichment of LREE and depletion of HREE. All δEu values are <1 (Table 2), and the REE patterns(Fig.3)suggest an obvious“V”shape at Eu,which indicates that the existence of obviously negative Eu anomalies. Results of REE analysis show that mudstones of the Shahai and Fuxin formations were dominated by sediments derived from the felsic igneous rocks. Furthermore, the REE patterns of the probable source rocks located nearer to the southwest areas of Fuxin Basin were compared with the REE patterns of the mudstones in the DY-1 and FY-1 boreholes (Fig. 5). The Neoarchean granitic complex in western Liaoning Province is mainly composed of porphyraceous granodiorite and quartz diorite, with a small amount of fine-grained biotite diorite and veined granite,and has the characteristics of input and mixing of mafic magma(Zhang et al.2016).In this study,the REE patterns of mudstone samples are similar to those of the Neoarchean granitic complex with a negative Eu anomaly. Fig. 4 Source rock discrimination based on plots of a - Al2O3-TiO2 (adapted from Girty et al. 1996); b - La/Sc-Th/Co (adapted from Cullers 2002)and c - V-Ni-Th×10 (adapted from Bracciali et al. 2007) for mudstone samples of Shahai and Fuxin formations. Red circle - borehole DY-1; Blue circle - borehole FY-1. In Al2O3-TiO2 plot, mudstone samples near the intermediate and felsic igneous rock fields; La/Sc-Th/Co diagram indicates a primarily silicic source;The V-Ni-Th×10 plot reveals the domination of felsic source rocks and input of mafic source rocks To summarize, the Cr and Ni abundance, Al2O3-TiO2,La/Sc-Th/Co and V-Ni-Th×10 plots and REE pattern comparison reveal that the mudstones in DY-1 and FY-1 boreholes are dominated by sediments derived from the same type of provenance, comprising mainly felsic igneous rocks and a certain amount of intermediate and basic igneous rocks (the Neoarchean granitic complex). In recent years,various investigations of chemical weathering indices and especially the CIA, have been successfully used to quantify the chemical weathering degree of provenance area and thus constrain deep-time palaeoclimatic variation (e.g., Paikaray et al. 2008; Yang and Du 2017; Cao et al.2019;Chaudhuri et al.2020).Xu and Shao(2018)proposed that the influences of sedimentary differentiation through grain size differences, sediment recycling, further weathering in sedimentary regions, pedogenesis and potassium metasomatism should be taken into account before estimating the chemical weathering intensity in the provenance area. Owing to the sedimentary differentiation of transport and deposition, clay minerals are seldom preserved in sandstones, and as a result CIA values calculated from sandstones tend to be very low compared with those calculated from mudstones. Therefore, there is no comparability between the CIA values calculated from sandstone and mudstone. In order to exclude the influence of sedimentary differentiation, all selected samples are mudstones rather than sandstones, and the calculated CIA values are compared with the CIA standard values of mudstones as proposed by Fedo et al.(1995). Fig. 5 Average chondrite-normalized rare earth element patterns for mudstones from the Shahai and Fuxin formations in Fuxin Basin. Red circle -borehole DY-1; Blue circle - borehole FY-1; Green square - Neoarchean granitic complex from the probable source areas (Zhang et al. 2016).Chondrite normalization values are from Boynton (1984). The REE patterns of mudstone samples from two boreholes are similar to the Neoarchean granitic complex with a negative Eu anomaly Sediment recycling and further weathering of mudstone in the sedimentary area superimpose the signals of chemical weathering degree, which leads to results calculated by CIA not accurately reflecting the chemical weathering degree of the provenance. Palaeosols indicate that rocks have undergone pedogenesis and leaching to the accompaniment of the loss of Ca, Na and K elements in sedimentary areas, which results in relatively high CIA values. In addition, biological activity and organic acids secreted by plant roots during pedogenesis also accelerate the chemical weathering of palaeosols (Wilson 2004; Skiba 2007; Egli et al.2008). Seat earths, a type of palaeosol found at the floor of coal seams, represent a period of sedimentary discontinuity (Shao et al. 2005) and cannot reflect the chemical weathering degree of provenance areas only by simple analysis of CIA. Consequently, the samples with high ICV values >1 belong to the first-cycle of deposition, which should be selected to exclude sediment recycling and further weathering in the sedimentary areas before CIA calculations are undertaken.In this study, the samples far away from the coal seams do not belong to seat earths, having the least influence from further weathering and pedogenesis in the sedimentary area. The ICV values of most samples are >1, except for samples 13 (0.9), 39 (0.9) and 43 (0.8) from the DY-1 borehole (Table 1), indicating that these samples belong to the first-cycle deposition under the tectonically active settings, which were selected to calculate CIA. Potassium metasomatism brings in new potassium elements during diagenesis, resulting in artificially low CIA calculation values. The A-CN-K [Al2O3-(CaO*+Na2O)-K2O]triangle diagram(Fig.6;Fedo et al.1995)or CIAcorr.formula proposed by Panahi et al. (2000) can be used to judge and correct potassium metasomatism. The CIAcorr.formula using molecular proportions is as follows: where CaO* only represents the CaO from the silicate fraction, as defined in CIA; K2Ocorr.suggests K2O content in mudstone without potassium metasomatism;m=K2O / (Al2O3+CaO*+Na2O+K2O) for the parent sample. The “m” point (Fig. 6) is the intersection point between the extended line approximately paralleling to A-CN axis and CN-K axis, representing the proportion of K2O in parent rocks. The weathering trends of some of the mudstones change toward the K2O apex (Fig. 6), which indicates that these samples underwent a certain degree of potassium metasomatism. The corrected CIA values according to the CIAcorr.formula, are increased significantly, which is given in Table 1 in detail. In this study, the CIAcorr.values in the DY-1 borehole vary from 54.7-74.7,with an average of 67.2. The CIAcorr.values in the FY-1 borehole vary from 47.0-69.3, with an average of 60.8. Through correlation of the analyses by CIAcorr., WIP and MIA(O), it is concluded that CIAcorr.is negatively correlated with WIP, while it has a positive correlation with MIA(O)(Fig. 7). The CIAcorr., WIP and MIA(O)values of the Shahai and Fuxin formations have obvious changes vertically through the geological succession (Fig. 8 and Table 1). To simplify discussion and interpretation of the results, we subdivided the change trends into four stages. In Stage A, during the first and second members of the Shahai Formation, CIAcorr.and MIA(O)values, and land surface temperature were relatively low and showed characteristic high fluctuations, while WIP values were relatively high and experienced high amplitude fluctuations. These results suggest a low degree of chemical weathering and frequent changes under relatively low temperature and dry climate conditions.During Stage B in the third member of the Shahai Formation, CIAcorr., MIA(O)and land surface temperature values increased noticeably but maintained high amplitude fluctuations, while the WIP values decreased but still fluctuated unsteadily. This stage was a transitional period that indicates fluctuating degrees of chemical weathering and palaeoclimate. In Stage C, during the fourth member of Shahai Formation, CIAcorr., MIA(O), land surface temperature and WIP values tended to be relatively stable after a transition period, which represents a stable and moderate degree of chemical weathering,and relatively warm and humid palaeoclimate. During Stage D in the Fuxin Formation, relative decreases in CIAcorr., MIA(O), and land surface temperature values are evidenced, but an increase in WIP shows that the chemical weathering intensity had a downward trend.Comparing CIAcorr., WIP and MIA(O)values, the change trend of WIP is contrary to that of CIAcorr.and MIA(O)(Fig. 7), nevertheless, these chemical weathering indices reflect the same change trends of chemical weathering. The compositions of sediments are closely related to the signature of the source area (Cullers 1994, 2000). It is necessary to show that samples have a unified protolith in order to describe palaeoclimate characteristics based on variations of chemical weathering (Cao et al. 2019).In this study, the mudstone samples of the Shahai and Fuxin formations originated from the same type of provenance close to the Fuxin Basin, which results in the similar chemical weathering degrees between provenance and sedimentary areas. Therefore, chemical weathering characteristics in provenance area can approximately reflect the chemical weathering change in the sedimentary area.Through the analysis of CIAcorr.,WIP and MIA(O),it is concluded that the trends of these chemical weathering indices are highly consistent and can be divided into four stages in vertical direction(Fig.9). Fig. 6 A-CN-K ternary diagrams (Fedo et al., 1995) for mudstones from the Shahai and Fuxin formations, Fuxin Basin, Liaoning Province,northeastern China. Red circle - borehole DY-1; Blue circle - borehole FY-1. The CIA scales are shown at the left side of each diagram for comparison. Ideal weathering trends are given by solid lines ⓐand ⓑ, where solid line ⓐis parallel to the A-CN; Solid line ⓒis the Kmetasomatism trend that resulted from the diagenetic K addition to the samples. Dotted line ⓓis the reverse extension line of solid line ⓐ.Solid line ⓔshows premetasomatized CIA value. Dotted line ⓕrepresents CIA value after K-metasomatism. Ideal compositions of minerals labelled:Pl,plagioclase; Ks,K-feldspar;Il,illite;Sm, smectite; Ka,kaolinite;Gi,gibbsite;Ch,chlorite Fig. 7 Correlation of CIAcorr. with other weathering indices, including WIP and MIA(O). Red circle - borehole DY-1; Blue circle - borehole FY-1. In the two boreholes,CIAcorr. is negatively correlated with WIP,nevertheless,it has a positive correlation with MIA(O) Weissert and Lini (1991) provided the data on carbonate carbon isotopes in the Early Cretaceous, which shows the global climate became relatively cold during the middle and late Aptian. Wan et al. (2017)proposed that the palynoflora in northeastern China was dominated by herbaceous and coniferous forests during the early Liaoxi regional stage (late Aptian),indicating relatively low temperature and humidity(Fig. 9). The weakening trend of chemical weathering in Stage A could represent a response to relatively global climate cooling during the late Aptian. Volcanic eruptions occurred frequently in western Liaoning Provence during the Early Cretaceous,occurring in four separate intervals respectively at 132±1 Ma, 126±1 Ma, 122±2 Ma and 115±2 Ma (Ji 2004; Cai et al. 2010). Of these, the fourth period of volcanic activity (~115±2 Ma) occurred during the late Aptian. Volcanic eruptions released large quantities of CO2into the atmosphere, aggravating the greenhouse effect (Kerr 1998; Larson and Erba 1999;Jenkyns 2003; Yevenes et al. 2019). Furthermore, this triggered the acceleration of the hydrological cycle,involving greater evaporation and precipitation, and consequently intensified chemical weathering and transport rates of nutrients from continents into lakes and oceans where it increased productivity in the surface waters (Jenkyns 1999, 2003; Erba 2004; Leckie et al. 2002). Ultimately, nutrients are flushed through rivers into lakes and oceans, where decaying organic matter on the surface water consumes oxygen in the descent process, which in turn leads to the anoxia of the water (Weissert 1989). In such a context, black shale can be formed in lakes and oceans with the strengthening of the anoxic zone in bottom waters.An Ocean Anoxic Event occurred during the late Aptian-early Albian (OAE1b: ~113-109 Ma; Leckie et al. 2002), which correlates with the increasing(Stage B, latest Aptian) and intense chemical weathering (Stage C, early Albian) in the Fuxin Basin. Elevated weathering levels and high temperatures during Stage C in particular would have produced high nutrient levels that were flushed into lakes and ultimately into oceans through the hydrological cycle,contributing to anoxia and black shales in lake and marine systems. Fig. 8 Chemical weathering trends indicated by chemical weathering indices CIAcorr., WIP and MIA(O) of mudstones from the Shahai and Fuxin formations, which can be divided into four stages in vertical direction: A, B, C and D. T is land surface temperature in °C, which is calculated by the linear relationship of CIA-temperature provided by Yang et al. (2014). Humidity and temperature characteristics of palaeoclimate are inferred from palynoflora (modified after Wan et al. 2017). Green shading represents the location of OAE1b. Red circle - borehole DY-1; Blue circle -borehole FY-1.I,II,III and IV represent the first,second,third and fourth members of the Shahai Formation,respectively The purpose of this study is to characterize and reconstruct the chemical weathering degree in the Fuxin continental basin during the Early Cretaceous, and to further constrain palaeoclimate conditions by analysing chemical weathering proxies for this time interval. Mudstone samples of Fuxin Basin provide an opportunity to reconstruct chemical weathering changes. Cr and Ni abundance, Al2O3-TiO2, La/Sc-Th/Co and V-Ni-Th×10 plots,as well as rare earth elements analysis indicate that the mudstones in DY-1 and FY-1 boreholes originated from the same type of provenance consisting mainly of felsic igneous rocks. The trends of chemical weathering reflected by CIAcorr., WIP and MIA(O)permit the identification of four stages vertically through the geological succession. In Stage A during the early part of the late Aptian, weak chemical weathering correlates with relatively cool global climates supported by palynofloras that are dominated by herbaceous and coniferous forests in northeastern China during the early Liaoxi regional stage. Stage B during the latest Aptian was a transitional period and chemical weathering and land surface temperature increased but maintained high amplitude fluctuations. By contrast, conditions in Stage C during the early Albian were stable and showed enhanced chemical weathering and warm, humid climates. This stage correlates with Ocean Anoxic Event 1b, inferring that enhanced chemical weathering at this time produced high nutrient levels that were flushed into lakes and marine systems,triggering anoxia and deposition of black shales. Finally,in Stage D during the middle and late Albian, conditions returned to low chemical weathering rates and lower land surface temperatures. Fig. 9 Average variation trends of chemical weathering, land surface temperature and palaeoclimate across the Shahai and Fuxin formations,which can be divided vertically into stages A, B, C and D. Green shading represents the location of OAE1b. Chemical weathering trend (orange line) was indicated by chemical weathering indices CIAcorr., WIP and MIA(O) of mudstones from the Shahai and Fuxin formations. Land surface temperature (red line) was calculated by the linear relationship of CIA-temperature provided by Yang et al. (2014). The change trend of palaeoclimate (green line) inferred from palynological data is from Wan et al. (2017). I, II, III and IV represent the first, second, third and fourth members of the Shahai Formation,respectively Of these stages, only the early Albian was characterized by intensified chemical weathering, high temperatures and high humidity which were associated with the flux of high nutrients into lakes and ultimately oceans,contributing to eutrophication and anoxia in lacustrine and marine systems. Abbreviations CIA: Chemical Index of Alteration; WIP: Weathering Index of Parker;MIA(O): Mafic Index of Alteration for Oxidative weathering environments;OAEs: Oceanic Anoxic Events; OAE1b: Oceanic Anoxic Event 1b; LIPs: Large Igneous Provinces; CORBs: Cretaceous Oceanic Red Beds; NE: North-east;REE: Rare earth element; LREE: Light rare earth element; HREE: Heavy rare earth element; ICV: Index of Compositional Variability; A-CN-K: Al2O3-(CaO* +Na2O)-K2O Acknowledgements We thank the Editor-in-Chief, Zeng-Zhao Feng, editor Yuan Wang and Xiu-Fang Hu, reviewers Santanu Banerjee and John S. Armstrong-Altrin for their constructive comments to improve the manuscript. Authors’ contributions Xiao-Tao Xu carried out the data analysis and drafted the manuscript. Long-Yi Shao conceived the study and helped to revise the manuscript. Bo Lan performed the experiment analysis. Shuai Wang participated in the design and coordination. Jason Hilton helped to revise the manuscript and polish it in English language. Jian-Yi Qin helped to the statistical analysis. Hai-Hai Hou helped to revise the manuscript. Jie Zhao helped to collect samples from boreholes. All authors read and approved the final manuscript. Funding This study was supported by the Yue Qi Scholar Fund of China University of Mining and Technology (Beijing), the National Natural Science Foundation of China (41572090), and Shandong Key Laboratory of Depositional Mineralization & Sedimentary Mineral, Shandong University of Science and Technology (DMSM20190015). Availability of data and materials All data generated or analysed during this study are included in the manuscript. Competing interests The authors declare that they have no competing interests. Author details 1College of Geoscience and Surveying Engineering, China University of Mining and Technology (Beijing), Beijing 100083, China.2Shandong Key Laboratory of Depositional Mineralization & Sedimentary Mineral, Shandong University of Science and Technology, Qingdao 266590, China.3Northeast China Coalfield Geology Bureau 107 Exploration Team, Fuxin 123000, China.4School of Geography, Earth and Environmental Sciences, University of Birmingham, Edgbaston, Birmingham B15 2TT, UK.5College of Mining,Liaoning Technical University, Fuxin 123000, China. Received: 16 September 2019 Accepted: 5 March 20203.3 Weathering Index of Parker (WIP)
3.4 Mafic Index of Alteration (MIA)
3.5 Index of Compositional Variability (ICV)

3.6 Palaeotemperature estimates
4 Results
4.1 Major elements


4.2 Rare earth elements
4.3 Weathering proxies and palaeotemperature
5 Discussion
5.1 Sedimentary provenance


5.2 Evaluating influence factors of chemical weathering indices


5.3 Characteristics of chemical weathering, land surface temperature and palaeoclimate change
5.4 Interpretation of chemical weathering fluctuations


6 Conclusions


 Journal of Palaeogeography2020年2期
- Journal of Palaeogeography的其它文章
- Asia-Gondwana connections indicated by Devonian fishes from Australia:palaeogeographic considerations
- Morphology and features of Cambrian oncoids and responses to palaeogeography of the North China Platform
- Palynomorph assemblage biozonation of Paleogene strata in Bende-Umuahia Area,Niger Delta Basin,southeastern Nigeria
- Ancient rip current records and their implications:an example from the Cretaceous Ukra Member,Kutch,India
- Large soft-sediment deformation structures(SSDS)in the Permian Barren Measures Formation,Pranhita-Godavari Valley,India:potential link to syn-rift palaeoearthquake events
- Thickening-upward cycles in deep-marine and deep-lacustrine turbidite lobes:examples from the Clare Basin and the Ordos Basin