
Pan-cancer analyses demonstrate that ANKRD6 is associated with a poor prognosis and correlates with M2 macrophage infiltration in colon cancer
2021-03-13 09:12RuiBaiDehaoWuZhongShiWangxiongHuJuanLiYuanyuanChenWeitingGeYingYuan1ShuZheng
Rui Bai,Dehao Wu,Zhong Shi,Wangxiong Hu,Juan Li,Yuanyuan Chen,Weiting Ge,Ying Yuan1,,Shu Zheng
1Department of Medical Oncology,Key Laboratory of Cancer Prevention and Intervention,Ministry of Education,the Second Affiliated Hospital of Zhejiang University School of Medicine,Hangzhou 310009,China;2Cancer Institute,Key Laboratory of Cancer Prevention and Intervention,Ministry of Education,the Second Affiliated Hospital of Zhejiang University School of Medicine,Hangzhou 310009,China;3 Department of Medical Oncology,Institute of Cancer and Basic Medicine (ICBM) Chinese Academy of Sciences,Cancer Hospital of the University of Chinese Academy of Sciences,Hangzhou 310022,China;4Department of Radiation Oncology,Hangzhou Cancer Hospital,Hangzhou 310002,China
Abstract Objective:Ankyrin repeat domain-containing protein 6 (ANKRD6) is an ankyrin repeat-containing protein which is structurally related to vertebrate inversin and Drosophila Diego.However,the correlations between ANKRD6 and tumor-infiltrating immune cells in cancers is not clear.Methods:ANKRD6 expression was analyzed by Oncomine,Tumor Immune Estimation Resource (TIMER) and Gene Expression Profiling Interactive Analysis (GEPIA).PrognoScan and GEPIA were used to evaluate the influence of ANKRD6 on clinical prognosis.TIMER and CIBERSORT were used to analyze correlations between ANKRD6 expression levels and tumor immune cell infiltrates.Immunohistochemical analysis of the relationship between ANKRD6 expression and overall survival,as well as the relationship between ANKRD6 expression and M2 macrophage infiltration,was performed.Results:High level of ANKRD6 expression was associated with poor prognosis of colon cancer.ANKRD6 expression level was positively correlated with infiltrating levels of CD8+T cells,CD4+T cells,macrophages,neutrophils and dendritic cells in colon cancer by using TIMER.Using CIBERSORT,we found that in plasma cells,CD8+T cells,CD4+memory resting T cells,follicular helper T cells and activated natural killer cells were significantly lower in the ANKRD6-high group than in the ANKRD6-low group.M0 and M2 macrophages were significantly higher in the ANKRD6-high group than in the ANKRD6-low group.Immunohistochemistry confirmed that M2 macrophage infiltration in the ANKRD6-high group significantly increased.Conclusions:The high ANKRD6 expression is associated with poor prognosis of colon cancer.ANKRD6 expression is positively correlated with M2 macrophage infiltration in colon cancer.
Keywords:ANKRD6;colon cancer;pan-cancer;prognosis;tumor-infiltrating
Introduction
According to the 2015 China Cancer Statistics,colorectal cancer has high morbidity and mortality rates and is the fifth most common malignant tumor (1). Immune checkpoint inhibitors,such as anti-programmed cell death 1 (PD-1)-inducing antibodies,anti-programmed cell death 1 ligand (PD-L1) inhibitory antibodies,and anti-cytotoxic T-lymphocyte-associated protein 4 (CTLA-4) antibodies,alter cancer treatment.Efforts have been made to eliminate tumor immune interactions and identify prognostic predictors.
Ankyrin repeat domain-containing protein 6(ANKRD6),also known as Diversin,is an ankyrin repeat protein that activates nonneural planar cell polarity (PCP)signals while inhibiting typical pathways.ANKRD6 is a modular protein located on chromosome 6 (q14.2-q16.1)and a member of the ankyrin repeat domain protein family.The ankyrin repeat domain protein family mediates physiologically important protein-protein interactions and acts as an adapter for signaling pathways (2).ANKRD6 is localized in the Xenopus ectoderm and mammalian cell centrosome (3).ANKRD6 is highly expressed in non-small cell lung cancer (NSCLC),breast cancer,and human gliomas (4-6).ANKRD6 overexpression is a predictor of poor prognosis of NSCLC and breast cancer (4,5).ANKRD6 promotes cell proliferation and invasion through the c-Jun N-terminal kinase (JNK) pathway (4,5).ANKRD6 has a stronger cytotoxic effect on 5,637 cells(bladder cancer cells) than human dermal fibroblast(HDF1) and human foreskin fibroblast (HFF3) cells(normal cells) (7).
WNT signals are transduced to the β-catenin pathway or PCP pathway.PCP is an important branch of WNT signaling (8) and is highly involved in embryogenesis and is essential for human disease (9,10).It activates the cytoskeletal pathway (11) to affect organ morphogenesis and cell polarization movement.The WNT-β-catenin pathway is related to tumorigenesis,and the WNT-PCP pathway is related to cell movement and metastasis and promotes tumor invasion,survival,and treatment resistance(12,13).The WNT-β-catenin pathway and the WNT-PCP pathway affect T-cell factor/lymphoid enhancer-binding factor (TCF/LEF) and AP-1 (14) and regulate the immune response of tumors (15,16).The AP-1 components (c-Jun,JunB,c-Fos,Batf),by binding to the enhancer region (15),induce the expression of genes encoding cosuppressive immune checkpoints (PD-1,PD-L1).WNT inhibitors reduce PD-L1 expression,and WNT agonists enhance PD-L1 expression at the transcription and protein levels(17).TCF/LEF shows dynamic expression during T cell maturation,and the constitutive activation of the Wnt/βcatenin pathway reduces the expansion of mature cytotoxic T cells (18).So we speculate that ANKRD6 may affect the immune microenvironment through the WNT pathway.
The tumor immune microenvironment is mediated by immune cells infiltrating the tumor.Immunotherapy for tumors acts on the immune microenvironment,and the heterogeneity of the tumor immune microenvironment is bound to have a close relationship with the different response rates of immunotherapy.The immune microenvironment is expected to serve as a biomarker to guide clinical treatment and screen tumor patients who can benefit from immunotherapy.The correlations between ANKRD6 and tumor-infiltrating immune cells in cancers remain unclear.In this study,we evaluated the expression of ANKRD6 on clinical prognosis and analyzed correlations between ANKRD6 expression levels and tumor immune cell infiltrates.
Materials and methods
Analysis of differential expression in tumor and matched normal tissues
Oncomine database analysis
ANKRD6 expression in cancers was analyzed with the Oncomine database (https://www.oncomine.org/resource/login.html) (19).This database has identified the genes across 412 unique analyses of gene expression microarrays,spanning the majority of cancer types and subtypes.The threshold was determined as follows:P-value of 0.001,fold change of 1.5,and gene ranking of“ALL”.
Tumor Immune Estimation Resource (TIMER) database analysis
TIMER is a comprehensive resource for systematic analysis of immune infiltrates (https://cistrome.shinyapps.io/timer/)(20).TIMER consists of six functional modules,including the association of tumor-infiltrating immune cell (TIIC)abundance with gene expression (Gene),overall survival(Survival),somatic mutations (Mutation),DNA somatic copy number alterations (SCNA),differential gene expression (DiffExp) and gene-gene correlations(Correlation).The data comprise 10,897 samples across 32 cancer types from The Cancer Genome Atlas (TCGA).The gene expression levels are displayed using box plots,and the statistical significance of differential expression levels was evaluated using the Wilcoxon test.We can identify genes that are up-or down-regulated in the tumors compared to normal tissues for each cancer type,as displayed in gray columns,when normal data are available.
Relationship between ANKRD6 expression and prognosis
PrognoScan database analysis
A PrognoScan database analysis of the correlation between ANKRD6 expression and survival in cancers was performed (http://dna00.bio.kyutech.ac.jp/PrognoScan/)(21).Cancer microarray datasets with clinical annotations were intensively collected from the Gene Expression Omnibus (GEO),ArrayExpress and individual laboratory web sites with the following criteria:1) patient information on survival events and duration;2) large enough sample sizes to enable survival analysis;3) derived from a“whole genome”platform and has no missing values so quantile normalization can function properly;and 4) derived from a platform for which probe annotations for a public identifier is available.The relationships between gene expression and patient overall survival (OS),disease-specific survival (DSS)and disease-free survival (DFS) were evaluated across publicly available cancer microarray datasets. The relationship between gene expression and prognosis was investigated using the minimum P-value approach.The threshold was adjusted to a Cox P<0.05.
Gene Expression Profiling Interactive Analysis (GEPIA)database analysis
GEPIA (http://gepia.cancer-pku.cn/index.html) (22) was used to obtain survival curves,including OS and DFS curves,based on gene expression with the log-rank test and the Mantel-Cox test in 33 types of cancer.The GEPIA web server features are divided into seven major tabs:General,Differential Genes,Expression DIY,Survival,Similar Genes,Correlation and PCA based on TCGA and GTEx data.GEPIA is a web-based tool that delivers fast and customizable functionalities based on TCGA and GTEx data.GEPIA uses the log-rank test,sometimes called the Mantel-Cox test,for hypothesis evaluation.The group cutoff“median”was determined.The Cox proportional hazard ratio (HR) and 95% confidence interval (95% CI)information can also be included in the survival plot.
Relationship between ANKRD6 expression and infiltrating immune cells
TIMER database analysis
TIMER applies a previously published statistical method to infer the abundance of six TIIC subsets [B cells,CD4 T cells,CD8 T cells,macrophages,neutrophils and dendritic cells (DCs)]from the gene expression profiles of six TIIC subsets that are precalculated for 10,897 tumors across 32 cancer types from the TCGA.Tumor purity is the key to selecting genes that contribute to the deconvolution of immune cells in tumor tissue and is inferred from DNA SNP array data using the R package CHAT (23).Cancer and blood cell lines diluted to known ratios (24) verified the tumor purity.The ANKRD6 expression was negatively correlated with tumor purity and TIIC subsets when Pearson’s r≤-0.2 and P≤0.05,and positively correlated when Pearson’s r≥0.2 and P≤0.05.
CIBERSORT analysis
The relative abundance of 22 tumor-infiltrating lymphocytes (TILs) in colon cancer with different ANKRD6 expression levels (TCGA) was estimated by the CIBERSORT algorithm,a computational approach for inferring leukocyte representation in bulk tumor transcriptomes (25).Using a group cutoff“median”,low and high ANKRD6 expression groups were formed,and 135 patients were included.The TILs were compared between two groups by Student’sttest using GraphPad Prism software (Version 8.0;GraphPad Software,Inc.,LaJolla,USA).
Immunohistochemistry (IHC)
The experimental protocol was established according to the ethical guidelines of the Helsinki Declaration.This study was approved by the Institutional Review Board of Clinical Research,the Ethics Committee of the Second Affiliated Hospital of Zhejiang University School of Medicine.The ethics approval number is 2018-159.Written informed consent was obtained from each subject before collection of tissue samples and clinical information.Detailed clinical data for each individual human subject are shown inSupplementary Table S1,2.Survival curves of IHC were generated by GraphPad Prism software version 8.0.
IHC of samples from the Second Affiliated Hospital of Zhejiang University School of Medicine:IHC staining and semiquantitative analysis were performed as described in a previous work.The 4 μm sections were incubated with the anti-ANKRD6 (1:200,Proteintech,24333-1-AP),anti-CD68 (1:500,Huabio,EM1706-11) and CD163 (1:800,Huabio,ER1804-03) antibodies.
ANKRD6 expression scores were blindly evaluated by two pathologists using the immunoreactivity score,based on the percentage of positive cells and the intensity of staining.The percentage of positive cells was graded as follows:0 (negative),1 (<10%),2 (10%-50%),3(51%-80%),4 (>80%).The intensity of staining was graded as follows:0 (no color reaction),1 (mild reaction),2(moderate reaction),3 (intense reaction).The scores of the first two parts are added together,and the final positive result is divided into 0-3 levels:0 (0-1),1 (2-3),2 (4-5),3(6-7).ANKRD6 expression was defined as low (0,1,2) or high (3).
M2 macrophages:The whole section was observed under lowpower fields (magnification,×100);hot spots with a large number of CD68+/CD163+tumor-associated macrophages (TAMs) were selected,and the positive cells were counted in 5 fields of view in the hot spots under highpower fields (magnification,×400).The average value was taken as the count value of CD68+/CD163+TAMs.
Statistical analysis
The results of survival curves are displayed with HR (95%CI) and P or Cox P-values from a log-rank test.The results generated in Oncomine are displayed with P-values,fold changes and ranks.The gene expression correlation was evaluated by Spearman’s correlation or Pearson’s correlation and statistical significance,and the strength of the correlation was used the following guide:0-0.19“very weak”,0.20-0.39“weak”,0.40-0.59“moderate”,0.60-0.79“strong”,and 0.80-1.00“very strong”.Two-sided P<0.05 was considered statistically significant.
Results
mRNA expression of ANKRD6 in different types of human cancers
As shown inFigure 1A,the expression of ANKRD6 mRNA in different tumors and normal tissues was analyzed by Oncomine (gene expression microarray data).ANKRD6 expression is higher in brain and central nervous system(CNS) cancer,breast cancer,colorectal cancer,kidney cancer,lymphoma,myeloma,pancreatic cancer,sarcoma and other cancer tissues than in normal tissues.In some data sets,ANKRD6 expression is low in bladder cancer,brain and CNS cancer,breast cancer,colorectal cancer,head and neck squamous cell carcinoma,kidney cancer,leukemia,liver cancer,lung cancer,lymphoma,melanoma,prostate cancer,sarcoma and other cancers.The results of ANKRD6 expression are summarized inSupplementary Table S3.
As shown inFigure 1B,the differential expression of ANKRD6 mRNA between tumor and normal tissues was analyzed by TIMER (TCGA gene expression RNA-seq data).Compared with normal tissues,bladder urothelial carcinoma (BLCA),breast invasive carcinoma (BRCA),colon adenocarcinoma (COAD),head and neck squamous cell carcinoma (HNSC),kidney chromophobe (KICH),kidney renal papillary cell carcinoma (KIRP),lung adenocarcinoma (LUAD),prostate adenocarcinoma(PRAD),lung squamous cell carcinoma (LUSC),rectum adenocarcinoma (READ),stomach adenocarcinoma(STAD),and uterine corpus endometrial carcinoma(UCEC) tissues had significantly lower ANKRD6 expression.However,the expression of ANKRD6 was significantly higher in cholangiocarcinoma (CHOL) and thyroid carcinoma (THCA) tissues than in normal tissues.We also used GEPIA to compare tumor and normal tissues in colon cancer.The expression of ANKRD6 was significantly lower in colon adenocarcinoma (COAD) than in normal tissues (P<0.05) (Supplementary Figure S1).
Prognostic potential of ANKRD6 in cancers
In Affymetrix microarrays (HG-U133A/HG-U133_Plus_2),ANKRD6 was present in 204671_s_at and 204672_s_at.Based on the Affymetrix microarray,we used PrognoScan technology to study the relationship between ANKRD6 expression and the prognosis of different cancers.The results are shown inSupplementary Table S4(Cox P<0.05).ANKRD6 expression significantly affects the prognosis of colorectal cancer (Figure 2).GSE17536 and GSE17537 showed that high ANKRD6 expression was associated with a poor prognosis.GSE14333 204672_s_at showed that high ANKRD6 expression was associated with poor DFS(HR=2.03,95% CI,1.33-3.09;Cox P<0.001).In other cancers,such as brain,breast and lung cancers,low ANKRD6 expression is associated with a poor prognosis,and high ANKRD6 expression is associated with a poor prognosis in skin cancer (Supplementary Figure S2).

Figure 1 ANKRD6 expression levels in different types of human cancers.(A) Increased or decreased ANKRD6 in data sets of different cancer tissues compared with normal tissues in Oncomine;(B) ANKRD6 expression in different tumor types from TCGA database was determined by TIMER.*,P<0.05;**,P<0.01;***,P<0.001.ANKRD6,ankyrin repeat domain-containing protein 6;TCGA,The Cancer Genome Atlas;CNS,central nervous system;ACC,adrenocortical carcinoma;BLCA,bladder urothelial carcinoma;BRCA,breast invasive carcinoma;HER2,human epidermal growth factor receptor 2;CESC,cervical squamous cell carcinoma and endocervical adenocarcinoma;CHOL,cholangiocarcinoma;COAD,colon adenocarcinoma;DLBC,lymphoid neoplasm diffuse large B-cell lymphoma;ESCA,esophageal carcinoma;GBM,glioblastoma multiforme;HNSC,head and neck squamous cell carcinoma;HPV,human papillomavirus;KICH,kidney chromophobe;KIRC,kidney renal clear cell carcinoma;KIRP,kidney renal papillary cell carcinoma;LAML,acute myeloid leukemia;LGG,brain lower grade glioma;LIHC,liver hepatocellular carcinoma;LUAD,lung adenocarcinoma;LUSC,lung squamous cell carcinoma; MESO,mesothelioma; OV,ovarian cancer; PAAD,pancreatic adenocarcinoma; PCPG,pheochromocytoma and paraganglioma;PRAD,prostate adenocarcinoma;READ,rectum adenocarcinoma;SARC,sarcoma;SKCM,skin cutaneous melanoma;STAD,stomach adenocarcinoma;TGCT,testicular germ cell tumors;THCA,thyroid carcinoma;THYM,thymoma;UCEC,uterine corpus endometrial carcinoma;UCS,uterine carcinosarcoma;UVM,uveal melanoma.
TCGA-RNA sequencing data were also used to analyze the prognostic potential of ANKRD6 in different cancers by GEPIA (Figure 3,Supplementary Figure S3).In colorectal cancer,high levels of ANKRD6 expression are associated with poor OS (P=0.001) and DFS (P=0.001)(Figure 3A).In colon cancer,high levels of ANKRD6 expression are associated with poor OS (P=0.002) and DFS(P=0.002) (Figure 3B).However,high levels of ANKRD6 expression are not associated with poor OS (P=0.400) and DFS (P=0.480) in rectal cancer (Figure 3C).We also analyzed the data of TCGA colon cancer by multivariate analysis.The results showed that ANKRD6 expression was an independent prognostic factor (P=0.008) (Supplementary Table S5).High ANKRD6 expression leads to a poor prognosis in patients with colon cancer.
ANKRD6 expression is correlated with immune infiltration levels in cancers
Using TIMER,we investigated the correlations between ANKRD6 expression and immune infiltration levels.The ANKRD6 expression level had significant positive correlations with CD8+T cells (r=0.119,P=1.66E-02),CD4+T cells (r=0.344,P=1.40E-12),macrophages(r=0.512,P=2.26E-28),neutrophils (r=0.241,P=1.04E-06)and DCs (r=0.305,P=4.50E-10) (Figure 4A).ANKRD6 may play a special role in immune invasion in colon cancer,especially in the infiltration of CD4+T cells,macrophages and DCs.
In other 6 cancers,ANKRD6 expression has significantly negative correlations with tumor purity.ANKRD6 expression has significant positive correlations with B cell infiltration levels in 9 cancers,CD8+T cells in 11 cancers,CD4+T cells in 16 cancers,macrophages in 16 cancers,neutrophils in 12 cancers and DCs in 8 cancers(Supplementary Table S6).
Correlation analysis between different ANKRD6 expression levels and infiltrating immune cells in colon cancer

Figure 2 Kaplan-Meier survival curves comparing high and low expression of ANKRD6 in different types of colorectal cancer in PrognoScan.(A-E) Colorectal cancer GSE17536 showed that high ANKRD6 expression was associated with poor prognosis (204671_s_at DFS:HR=2.14,95% CI=1.31-3.50,P=0.003;DSS HR=1.66,95% CI=1.09-2.54,P=0.018;204672_s_at DFS:HR=2.64,95%CI=1.60-4.36,P<0.001;DSS:HR=1.89,95% CI=1.25-2.85,P=0.002;OS:HR=1.58,95% CI=1.07-2.33,P=0.021);(F) GSE14333 204672_s_at showed that high ANKRD6 expression was associated with poor DFS (HR=2.03,95% CI=1.33-3.09,P<0.001);(G-J) Colorectal cancer GSE17537 showed that high ANKRD6 expression was associated with poor prognosis (204671_s_at DFS:HR=2.59,95%CI=1.40-4.78,P=0.002;OS:HR=2.18,95% CI=1.07-4.43,P=0.031;204672_s_at DFS:HR=2.60,95% CI=1.19-5.68,P=0.017;OS:HR=2.89,95% CI=1.27-6.57,P=0.011).ANKRD6,ankyrin repeat domain-containing protein 6;DFS,disease-free survival;HR,hazard ratio;95% CI,95% confidence interval;DSS,disease-specific survival;OS,overall survival.
Using the CIBERSORT algorithm,we evaluated the abundance of TILs in the colon microenvironment using the TCGA gene expression data.We found that the number of plasma cells (P=0.010),CD8+T cells (P=0.011),CD4+memory resting T cells (P=0.001),follicular helper T cells (P=0.001) and activated NK cells (P=0.047) were significantly lower in the ANKRD6-high group than in the ANKRD6-low group.The number of M0 macrophages(P<0.001) and M2 macrophages (P=0.020) was significantly higher in the ANKRD6-high group than in the ANKRD6-low group (Figure 4B).We used IHC to analysis the correlation between different ANKRD6 expression levels and OS and M2 macrophages in colon cancer.To probe the correlations among CD68,CD163 and ANKRD6,we use serial paraffin sections and the represent images of CD68,CD163 and ANKRD6 showed are serial paraffin sections from the same case (Figure 5A).Combining the results of TIMER and CIBERSORT,we speculated that ANKRD6 is related to M2 macrophage infiltration,which was verified by IHC.M2 macrophages were significantly higher in ANKRD6-high group than in ANKRD6-low group (P=0.014,Figure 5B).In colon cancer,high levels of ANKRD6 IHC expression are associated with poor OS(Figure 5C).
Discussion
ANKRD6 is a cytoplasmic protein with eight N-terminal ankyrin repeat domains,a conserved central domain and Cterminal domain.Noncanonical WNT signaling through Frizzled or ROR receptors activates DVL-dependent Rho-ROCK and Rac-JNK cascades (WNT/PCP signaling).The function of ANKRD6 as a PCP activator is mediated by its ankyrin repeat domain.ANKRD6 binds to CKIε through its central domain and binds to Conductin or Axin through its C-terminal domain. This leads to the recruitment of CKIε to the β-catenin degradation complex.Then,β-catenin is phosphorylated and degraded,and βcatenin/TCF signaling is subsequently inhibited (14,26).
The WNT signaling pathway is involved in embryonic development and normal adult homeostasis.Mutated or deregulated expression of the WNT signaling pathway components can induce disease,including tumors (27).Loss of E-cadherin is a major contributor to the epithelialmesenchymal transition (EMT) process and is largely influenced by WNT/β-catenin signaling.An E-cadherin/βcatenin complex maintains epithelial integrity,and disturbances to this complex and the WNT/β-catenin pathway will ultimately lead to the nuclear translocation of β-catenin and transcription of EMT-promoting genes (28).Cancer cells undergoing EMT have been shown to promote immune suppression through several aspects,including the following:1) PD-L1/PD-L2 expression;2)increased autophagy;3) reduced sensitivity to the cell death receptor pathway;4) immunoproteasome deficiency and pMHC reduction;5) reduced E-cadherin expression;6)immunological synapse dysfunction;and 7) other known or still unknown mechanisms (29).Here,we report that ANKRD6 expression correlates with the prognosis of different cancers.The high expression of ANKRD6 correlates with a poor prognosis in colon cancer.This may be because ANKRD6 can promote the EMT of tumors,which may lead to the invasion and metastasis of tumors.On the other hand,EMT may lead to the suppression of tumor immunity,which may lead to poor patient prognoses.
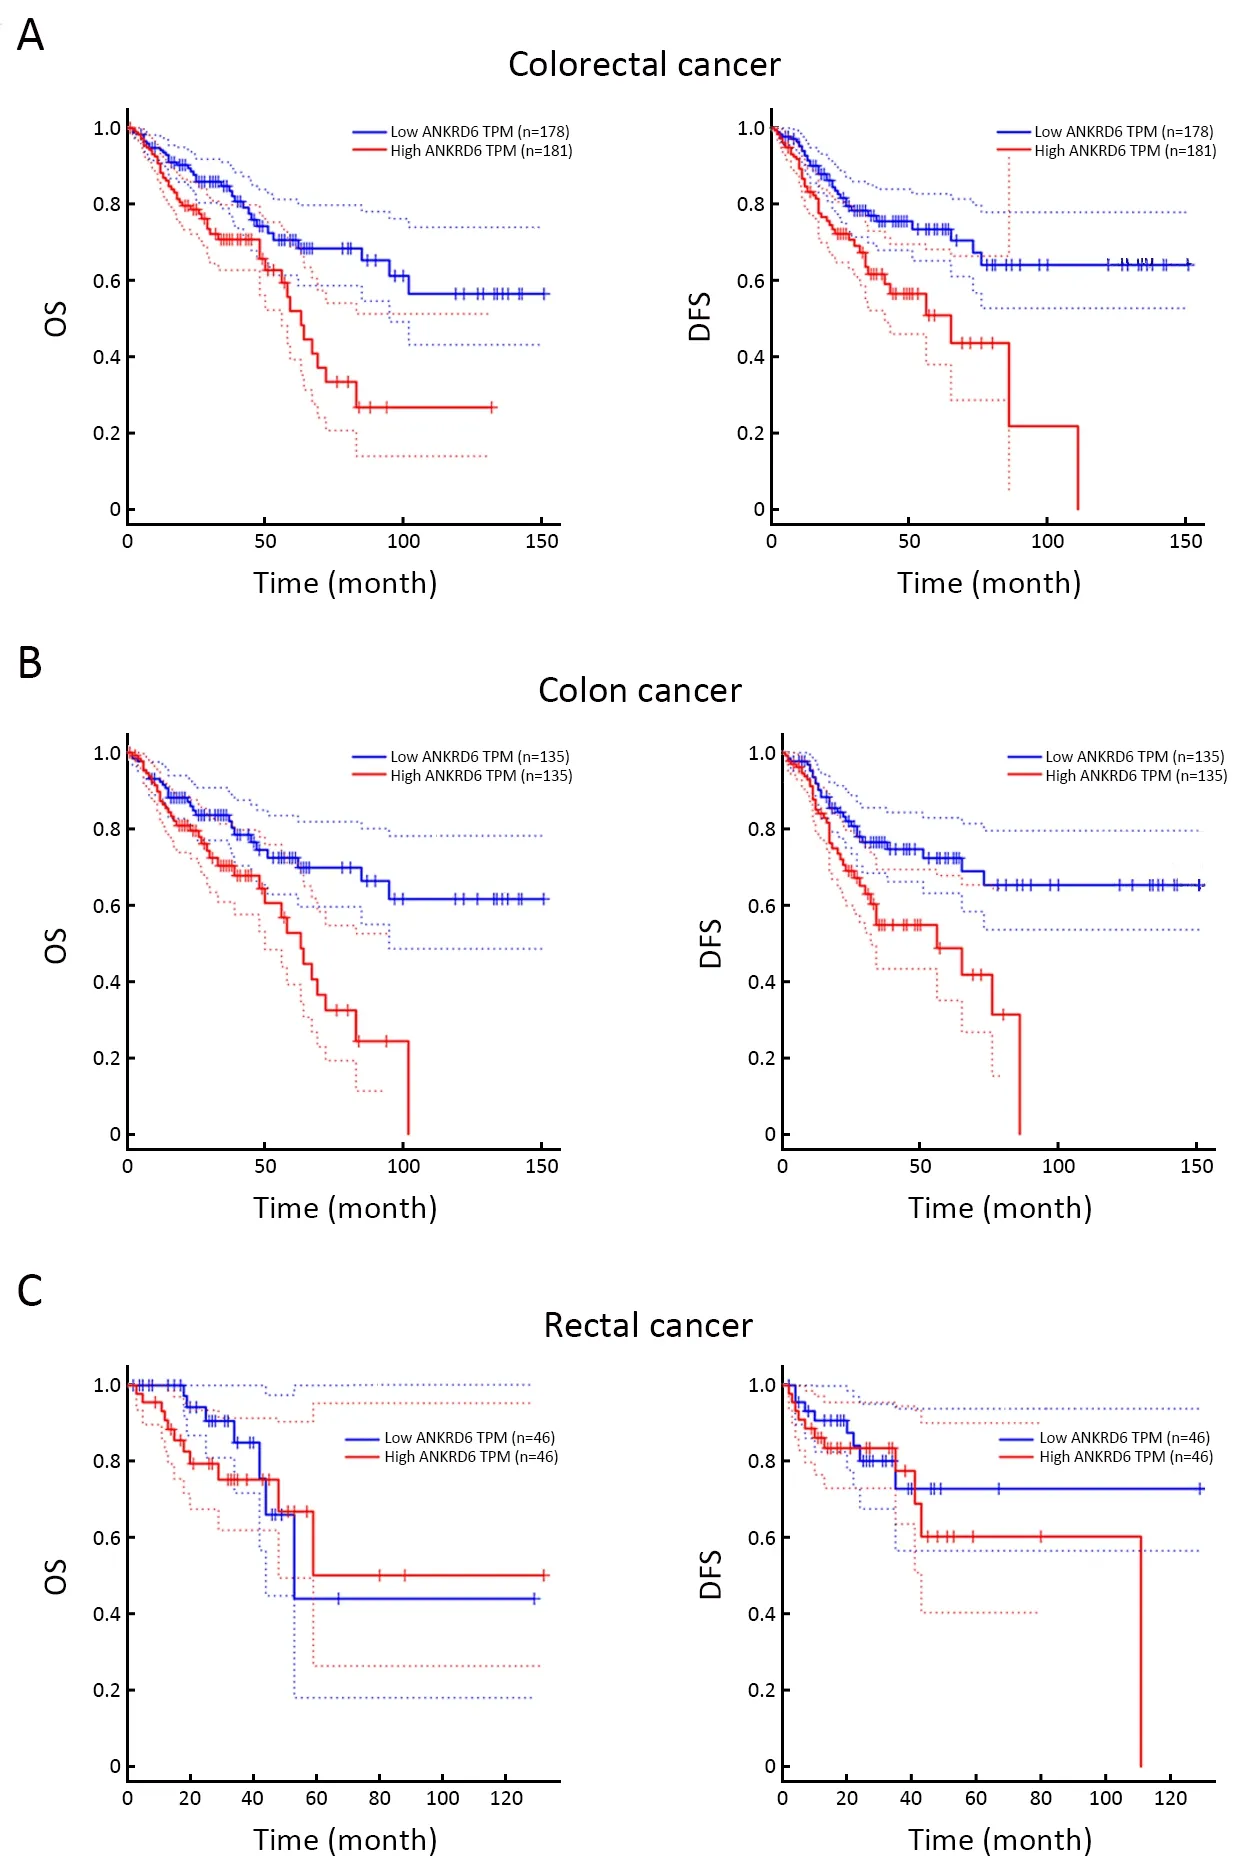
Figure 3 Kaplan-Meier survival curves comparing high and low expression of ANKRD6 in GEPIA databases.(A) Colorectal,high levels of ANKRD6 expression are associated with poor OS(P=0.001,HR=2.0) and DFS (P=0.001,HR=2.1);(B) Colon cancer,high levels of ANKRD6 expression are associated with poor OS (P=0.002,HR=2.1) and DFS (P=0.002,HR=2.1);(C)Rectal cancer,high levels of ANKRD6 expression are not associated with poor OS (P=0.400,HR=1.5) and DFS (P=0.480,HR=1.4).
There are many methods to study the immune microenvironment of tumors.Sequencing and bioinformatics analyses are the current strategies.Through transcriptome sequencing,we can obtain the expression data of different genes in tumor samples.Through corresponding bioinformatics software,we can obtain the expression of various cells to classify tumor microenvironment (TME),identify infiltrating immune cell subsets,compare expression of different subsets,and further screen microenvironment by combining survival analysis subtypes or immune cell subsets as biomarkers.At present,there are three basic algorithms for immune analysis:1) Marker genes (TIminer,xCellandMCP-counter);2) Deconvolution algorithms (CIBERSORT,TIMER,EPIC and quanTIseq);and 3) Nonnegative matrix factorization(NMF,deconf,ssKL and ssFrobenius).TIMER can quickly determine the immune invasion of various tumors,but to ultimately focus on colon cancer to distinguish the types of immune infiltration in more detail,we used the same algorithm in CIBERSORT.
In recent years,breakthroughs have been made in tumor immunotherapy,and research on tumor immunotherapy has attracted much attention.The immune system recognizes and clears abnormal cells,but tumor cells can avoid recognition and cell death by the immune system through various immune escape mechanisms,leading to the occurrence and development of tumors.In recent years,PD-1-,PD-L1-and CTLA-4-targeted antibodies have significantly improved the response rate of tumors such as melanoma,lung cancer and colorectal cancer.TME consists of tumor cells,fibroblasts,stromal cells,blood vessels,immune cells and the extracellular matrix.Immune cell infiltration plays a variety of roles in promoting or delaying tumor progression (30).Which immune cells are involved in the expression of ANKRD6 in the TME?Using TIMER,we easily determined the relationship between ANKRD6 expression and infiltrating immune cells from a pan-cancer analysis.
ANKRD6 plays an important role in the recruitment and regulation of colon cancer infiltrating immune cells.Recent studies have provided possible mechanisms to explain why ANKRD6 expression is associated with immune infiltration and a poor prognosis.Many studies have reported that immune infiltration may affect patient survival.ANKRD6 may be related to M2 macrophage.Therefore,the high expression of ANKRD6 promotes M2 macrophages infiltration,leading to a poor prognosis.It is worth noting that macrophages in TME exhibit an M2-like phenotype and help tumor growth and development through cancer cell proliferation,angiogenesis and metastasis (31).

Figure 4 ANKRD6 expression and immune infiltration in colon cancer.(A) Correlation between ANKRD6 expression and immune infiltration level in colon cancer.ANKRD6 expression is significantly negatively related to tumor purity (r=-0.241,P=9.11E-07) and has significant positive correlations with infiltrating levels of CD8+T cells (r=0.119,P=1.66E-02),CD4+T cells (r=0.344,P=1.40E-12),macrophages (r=0.512,P=2.26E-28),neutrophils (r=0.241,P=1.04E-06) and DCs (r=0.305,P=4.50E-10) in colon cancer,other than B cells(r=0.027,P=5.94E-01) (n=457);(B) Relative abundance of tumor infiltrating immune cells in ANKRD6-low expression group vs.ANKRD6-high expression group.Plasma cells (P=0.010),CD8+T cells (P=0.011),CD4+memory resting T cells (P=0.001),follicular helper T cells (P=0.001) and activated NK cells (P=0.047) are significantly lower in ANKRD6-high group than in ANKRD6-low group.Macrophages M0 (P<0.001) and Macrophages M2 (P=0.020) are significantly higher in ANKRD6-high group compared to ANKRD6-low group.ANKRD6,ankyrin repeat domain-containing protein 6;DC,dendritic cell.
Conclusions
In colon cancer patients,the infiltration of M2 macrophages can lead to immunosuppression,which can result in tumor recurrence and metastasis,affecting patient survival.High ANKRD6 expression is associated with poor prognosis of colon cancer,and ANKRD6 expression is positively correlated with M2 macrophage infiltration in colon cancer.Therefore,ANKRD6 will be a very simple and widely used marker for colon cancer prediction and individualized immunotherapy.
Acknowledgements
This work was supported by Zhejiang Basic Public Welfare Research Project (No.LGF18H160040).
Footnote
Conflicts of Interest:The authors have no conflicts of interest to declare.

Figure 5 M2 infiltrating macrophages immune cells in ANKRDlow group and ANKRD6-high group.(A) Represent images of CD163,CD68 and ANKRD6 showed are serial paraffin sections from the same case (×100);(B) M2 macrophages are significantly higher in ANKRD6-high group compared to ANKRD6-low group (P=0.014);(C) High levels of ANKRD6 IHC expression are associated with poor OS.ANKRD6,ankyrin repeat domaincontaining protein 6;IHC,immunohistochemistry;OS,overall survival.
Table S1 Patient and tumor characteristics for ANKRD6 IHC survival analysis

Table S2 Patient information for ANKRD6 and M2 macrophages IHC

Table S3 ANKRD6 expression in cancers vs. normal tissues in Oncomine database

Table S3(continued)

Table S4 Relationship between ANKRD6 expression and patient prognosis Cox P<0.05 in PrognoScan database
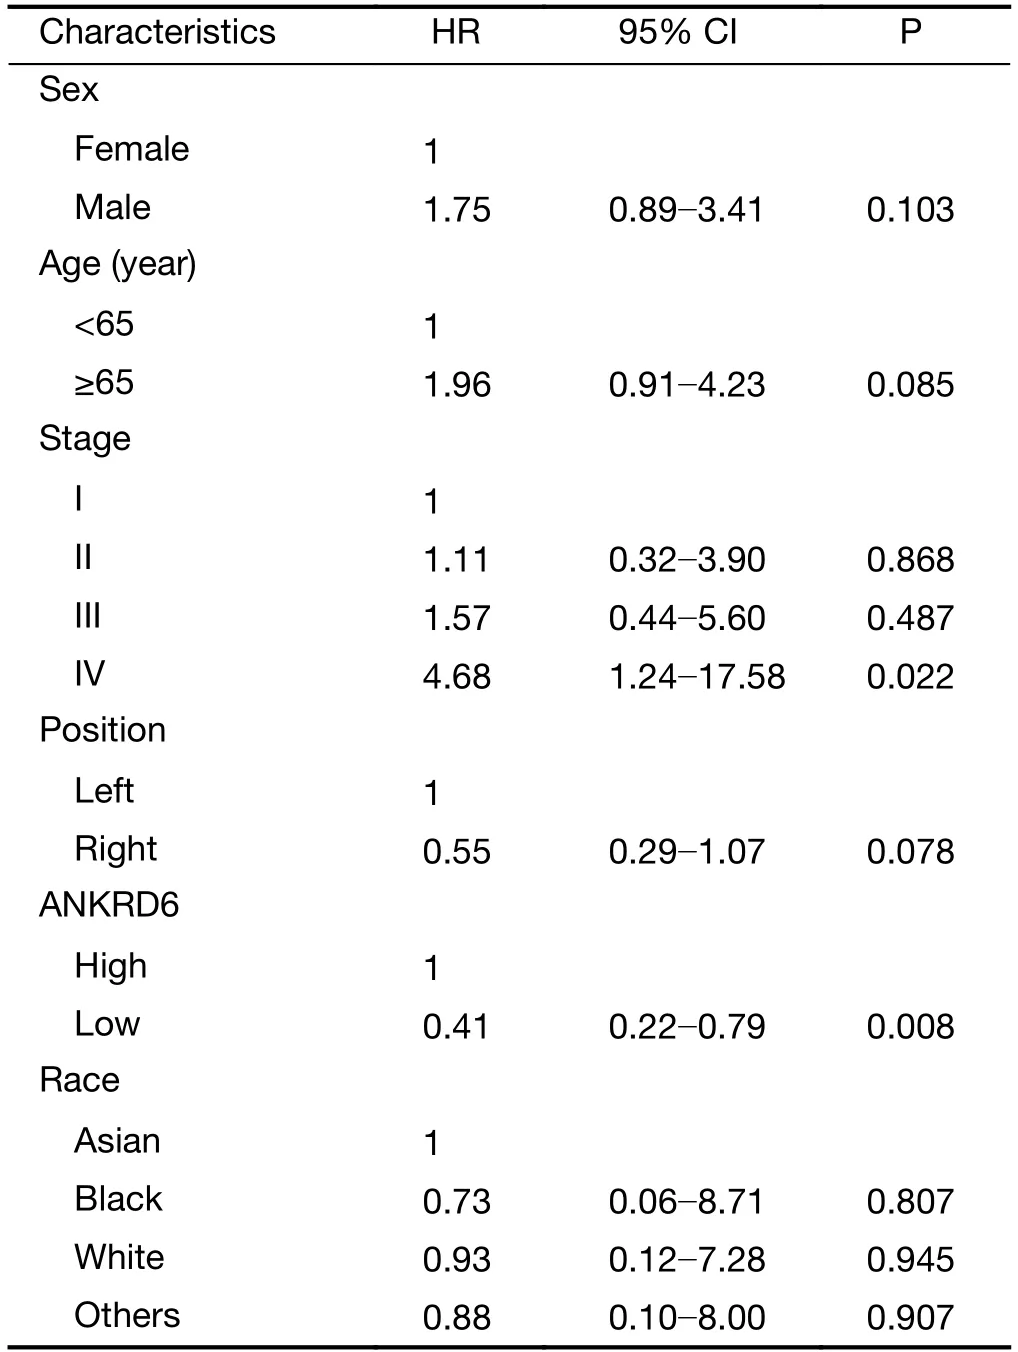
Table S5 Data of TCGA colon cancer by multivariate analysis
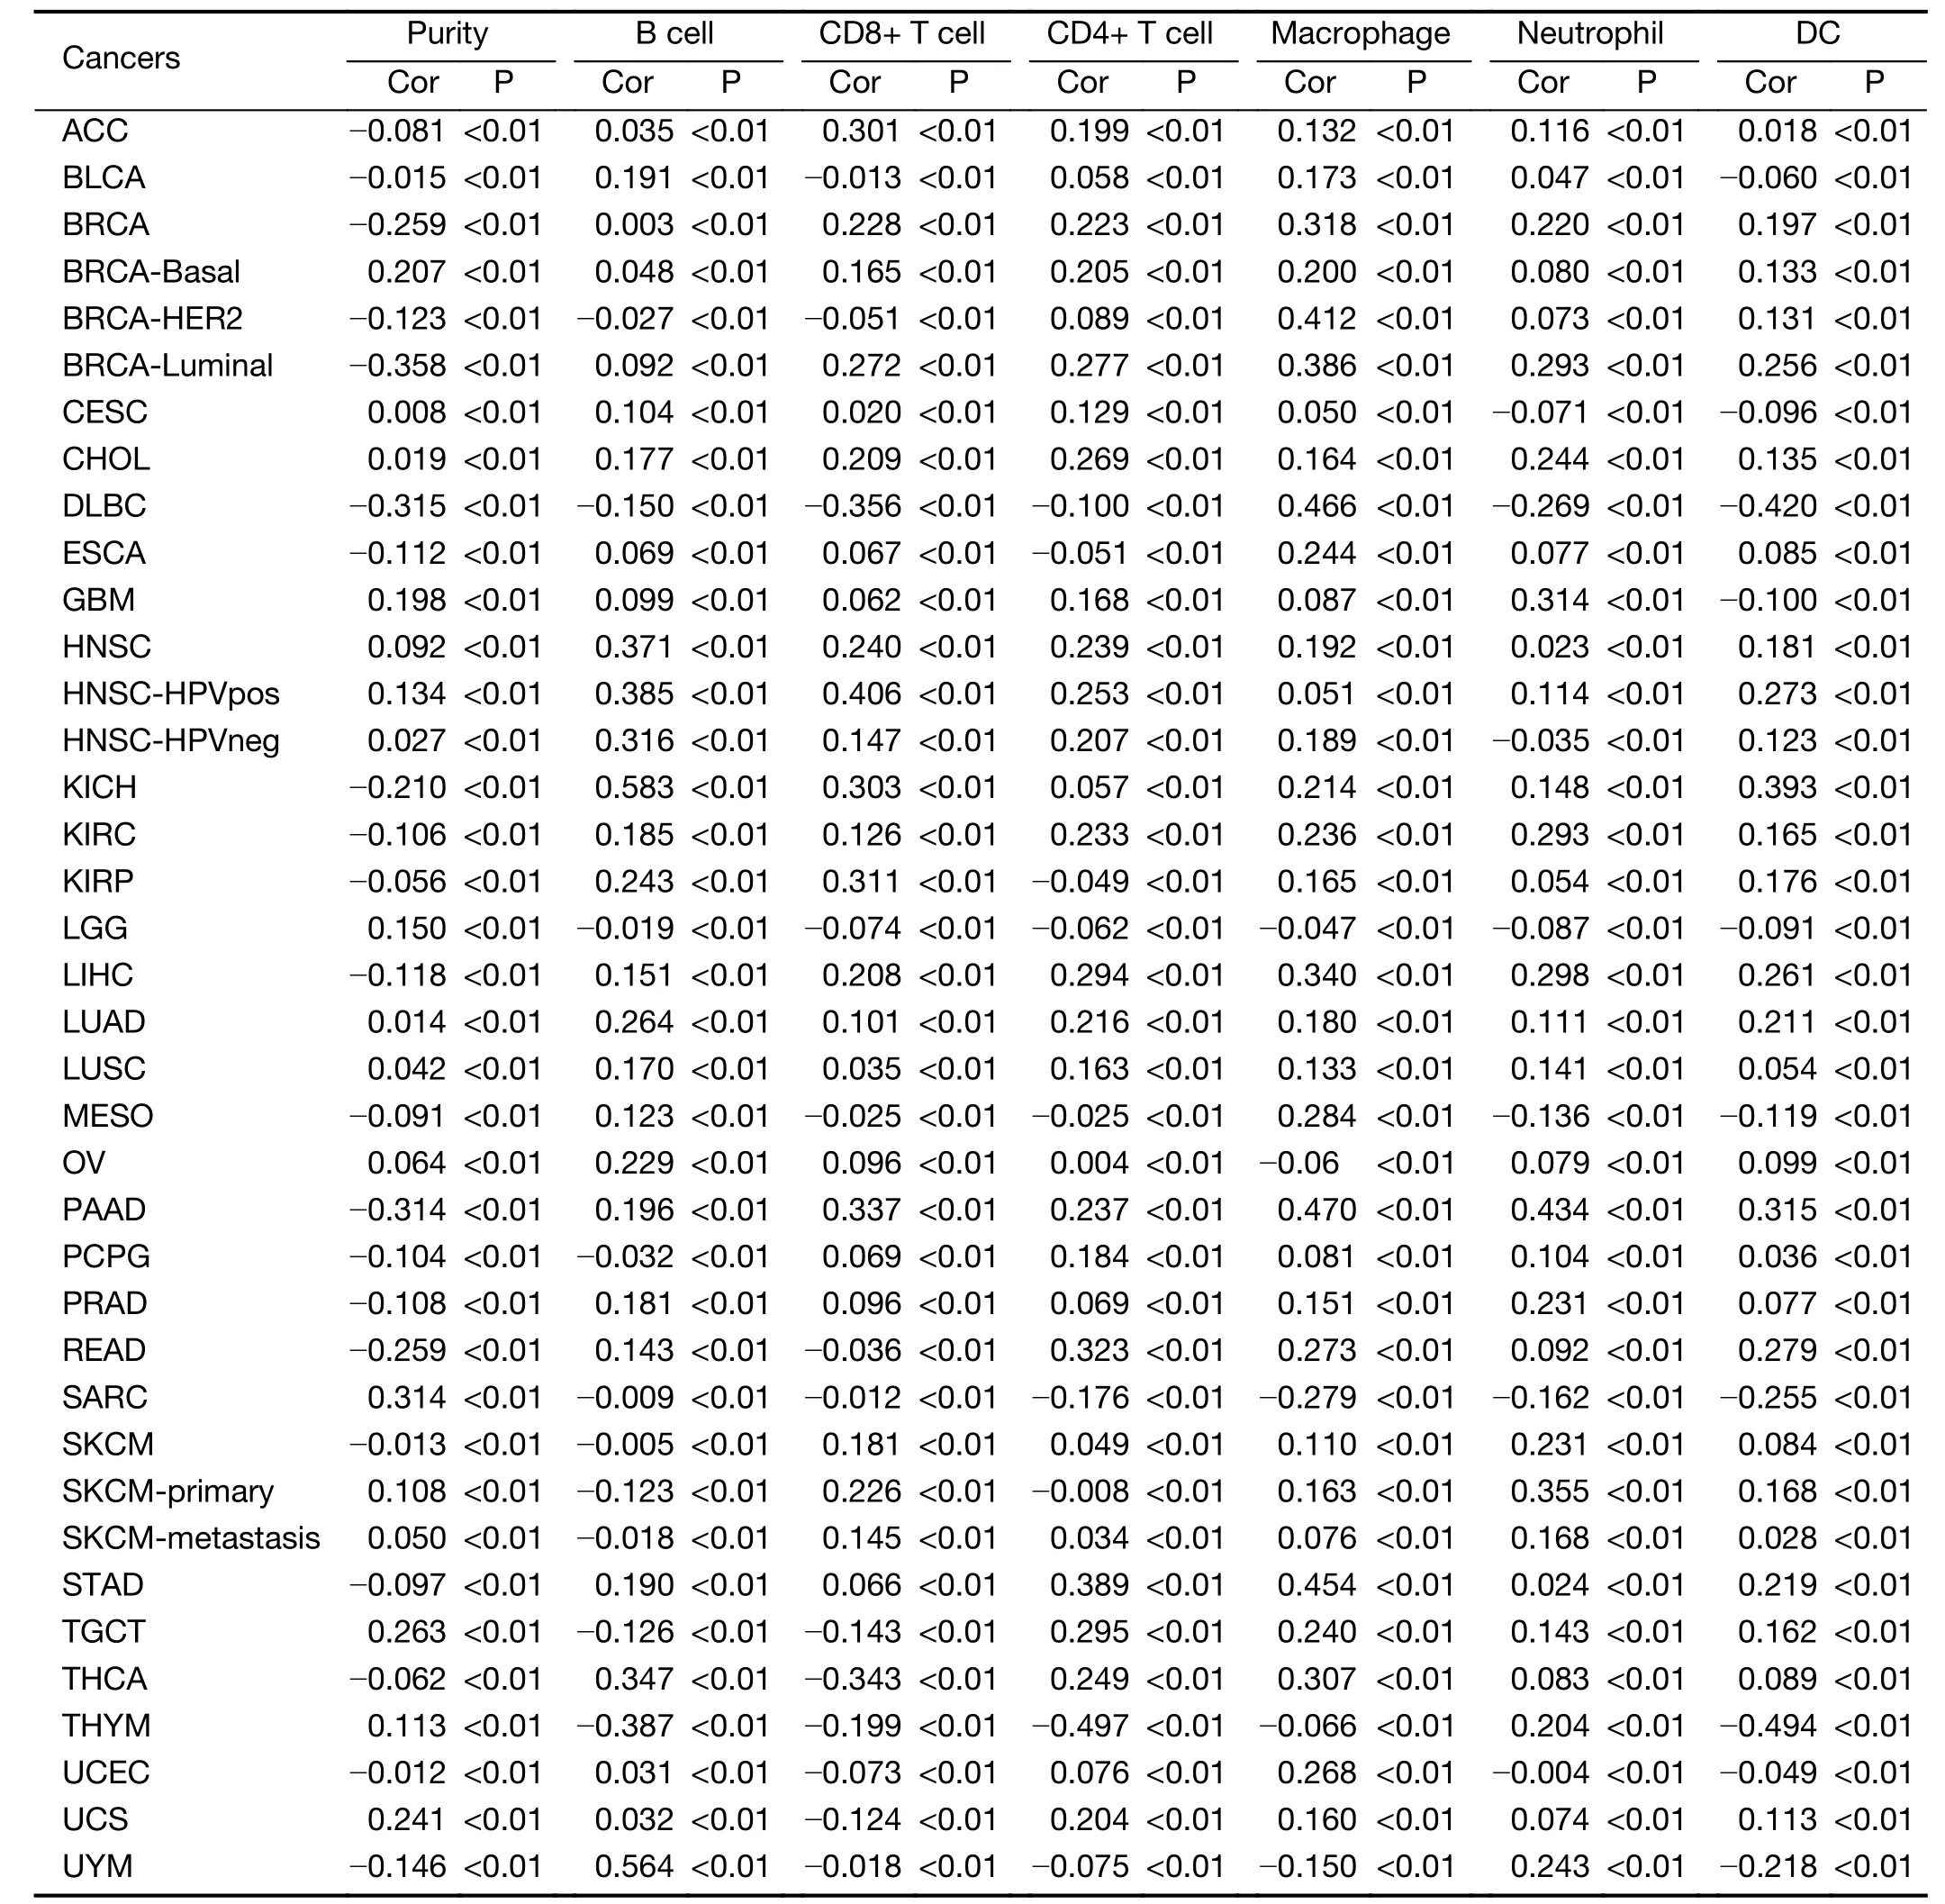
Table S6 Correlation of ANKRD6 expression with immune infiltration in other cancers (without COAD)

Figure S1 Expression of ANKRD6 was significantly lower in COAD than in normal tissues (P<0.05).ANKRD6,ankyrin repeat domain-containing protein 6;COAD,colon adenocarcinoma.

Figure S2 Kaplan-Meier survival curves comparing high and low expression of ANKRD6 in brain,breast,lung and skin cancer in PrognoScan.(A) Brain cancer GSE4412-GPL96 showed that low ANKRD6 expression was associated with poor prognosis (204671_s_at OS:HR=0.48,95% CI=0.25-0.94,P=0.032);(B-E) Breast cancer GSE1456-GPL96 showed that low ANKRD6 expression was associated with poor prognosis (204671_s_at OS:HR=0.48,95% CI=0.27-0.85,P=0.012;204672_s_at DSS:HR=0.46,95% CI=0.24-0.88,P=0.020;204671_s_at DFS:HR=0.62,95% CI=0.42-0.90,P=0.012;204672_s_at DFS:HR=0.56,95% CI=0.33-0.95,P=0.033);(F-H) Lung cancer GSE31210 and GSE4573 showed that low ANKRD6 expression was associated with poor prognosis (GSE31210 204671_s_at PFS:HR=0.40,95% CI=0.22-0.72 P=0.002;GSE4573 204672_s_at OS:HR=0.59,95% CI=0.36-0.96 P=0.032;GSE31210 204672_s_at PFS:HR=0.40,95% CI=0.22-0.72,P<0.001);(I) Skin cancer GSE19234 high ANKRD6 expression was associated with poor prognosis.(204671_s_at OS:HR=2.51,95% CI=1.17-5.36,P=0.018).
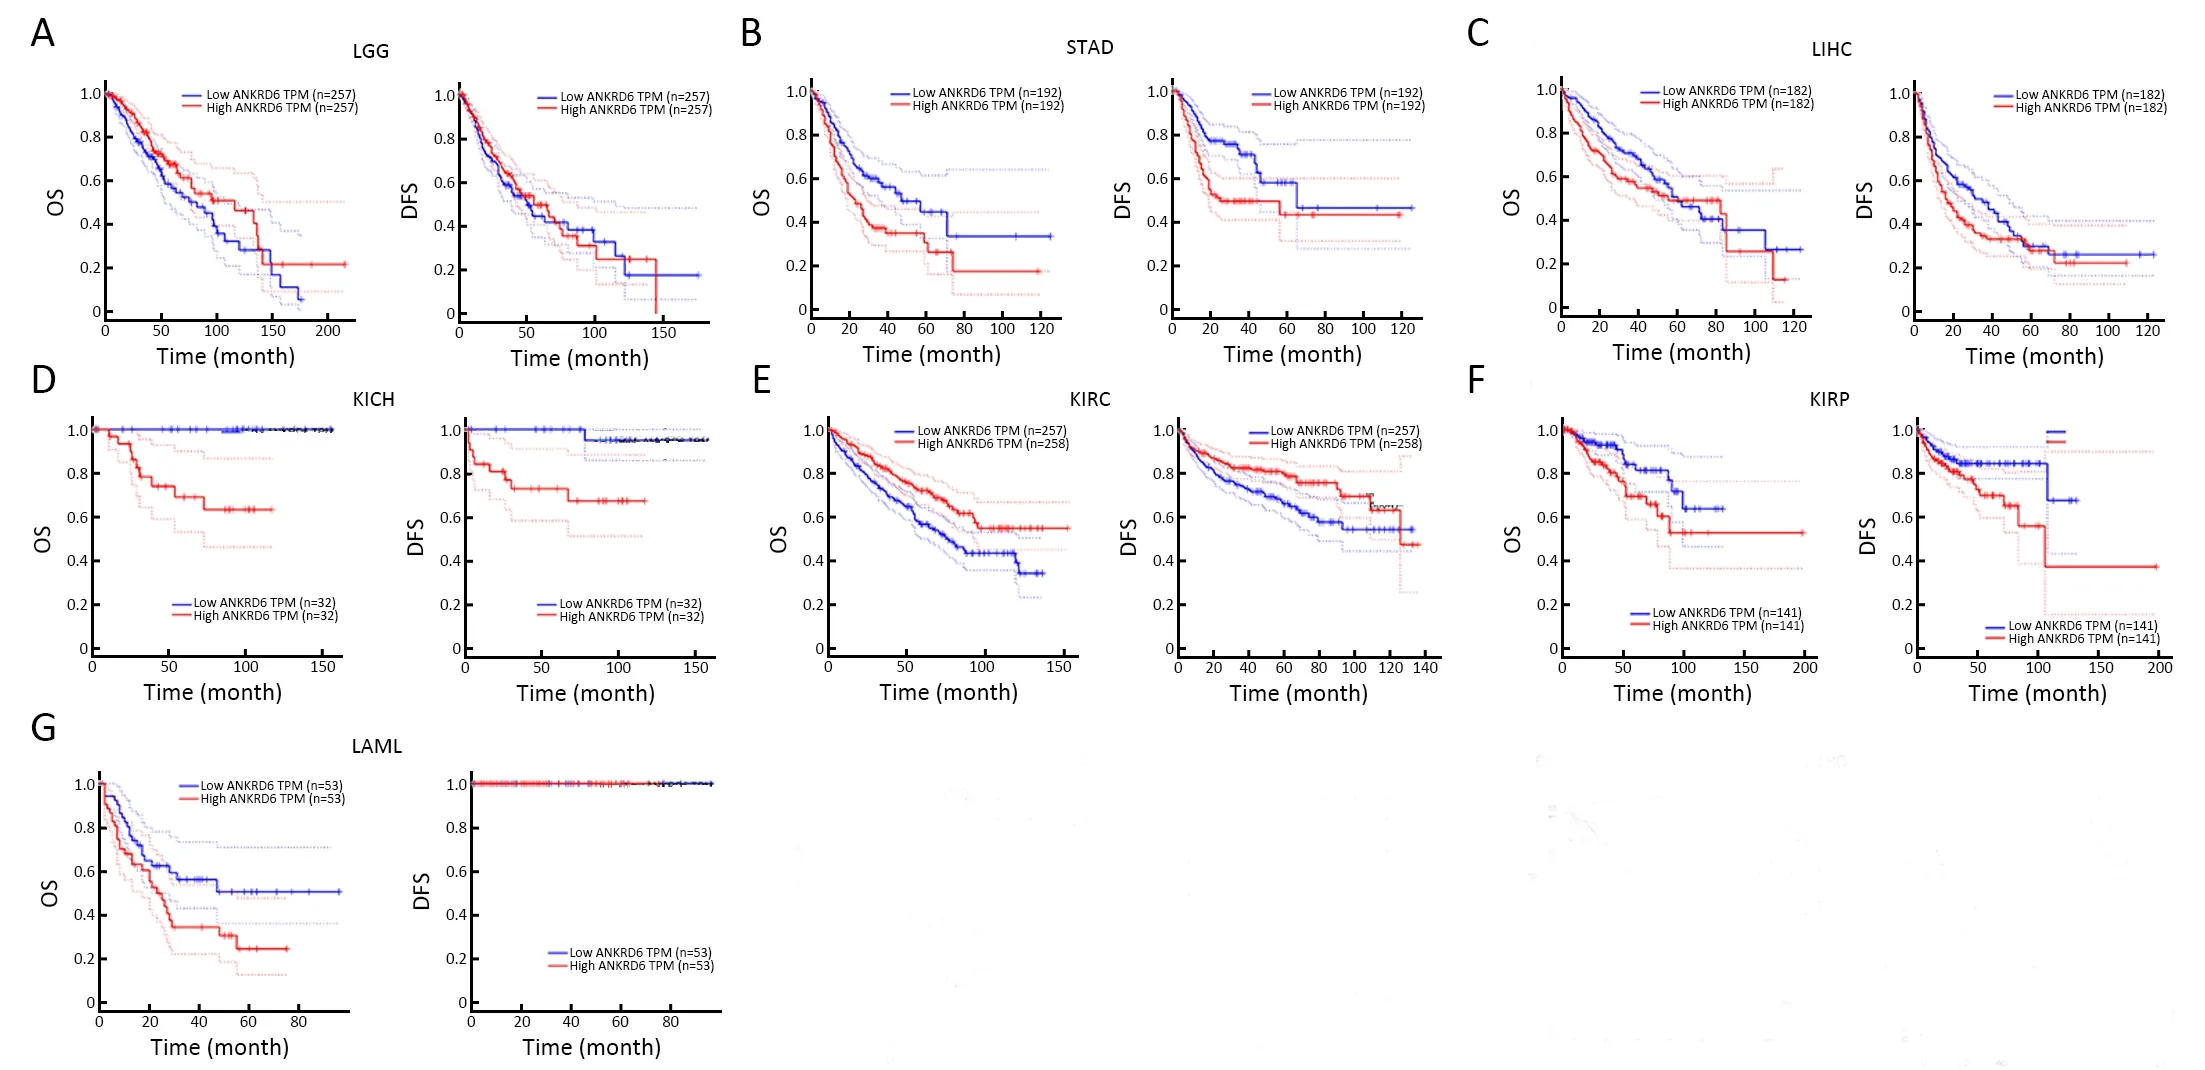
Figure S3 Kaplan-Meier survival curves comparing high and low expression of ANKRD6 in LGG,STAD,LIHC,KICH,KIRC,KIRP,LAML in GEPIA databases.(A) LGG,low levels of ANKRD6 expression is associated with poor OS (P=0.031);(B) STAD,high levels of ANKRD6 expression are associated with poor OS (P<0.001) and DFS (P<0.001);(C) LIHC,high levels of ANKRD6 expression are associated with poor OS (P=0.049) and DFS (P=0.035);(D) KICH,high levels of ANKRD6 expression are associated with poor OS(P<0.001) and DFS (P=0.003);(E) KIRC,low levels of ANKRD6 expression are associated with poor OS (P=0.001) and DFS (P=0.013);(F)KIRP,high levels of ANKRD6 expression are associated with poor OS (P=0.030) and DFS (P=0.029);G) LAML,high levels of ANKRD6 expression is associated with poor OS (P=0.042).LGG,brain lower grade glioma;STAD,stomach adenocarcinoma;LIHC,liver hepatocellular carcinoma;KICH,kidney chromophobe;KIRC,kidney renal clear cell carcinoma;KIRP,kidney renal papillary cell carcinoma;LAML,acute myeloid leukemia.
 Chinese Journal of Cancer Research2021年1期
- Chinese Journal of Cancer Research的其它文章
- Colorectal cancer burden and trends:Comparison between China and major burden countries in the world
- Changing trends of disease burden of gastric cancer in China from 1990 to 2019 and its predictions:Findings from Global Burden of Disease Study
- Clinical characteristics and clinicopathological correlations of bilateral breast cancer in China:A multicenter study from Chinese Society of Breast Surgery (CSBrS-006)
- Multi-center investigation of breast reconstruction after mastectomy from Chinese Society of Breast Surgery:A survey based on 31 tertiary hospitals (CSBrS-004)
- Laparoscopic vs. open surgery for gastrointestinal stromal tumors of esophagogastric junction:A multicenter,retrospective cohort analysis with propensity score weighting
- Radiotherapy combined with nimotuzumab for elderly esophageal cancer patients:A phase II clinical trial