
具有Holling-II型和非局部时滞的植被模型斑图动力学
2021-08-08 01:20郭尊光
工程数学学报 2021年4期
梁 娟, 李 莉, 崔 亮, 郭尊光
(1-太原工业学院理学系,太原 030008; 2-中北大学大数据学院,太原 030051;3-中北大学理学院,太原 030051;4-山西大学计算机与信息技术学院,太原 030006;5-山西财经大学资源环境学院,太原 030006)
1 Introduction
The growth and distribution of vegetation are mainly affected by climate and human factors[1,2].Vegetation pattern can directly reflect the distribution of vegetation in timeand space,especially in arid or semi-arid areas,and providebasis for vegetation protection and desertification early warning[3–5].At present,a number of researchers made efforts to support vegetation pattern research.Some scholars have studied the formation mechanism of vegetation pattern,such asscaledependent mechanism,nonlocal diffusion mechanism,soil water diffusion feedback,infiltration feedback,absorption feedback,root extension feedback and so on[6–9].The structure of vegetation pattern is divided into dot,stripe,labyrinth and bare ground[10,11].Different pattern structures reflect different functions[12–14].K´efiet al[15]found that power law distribution occurred with the increase in the intensity of grazing and could be used as an early warning of desertification.Some scholars have also studied the effect of slope on vegetation[16].
The above models were all based on the reaction-diffusion equation.However,in reality,in the process of absorbing water at the root of vegetation,the roots not only absorbs the water at the current position,but also absorbs the water nearby through a certain period of time[17].Therefore,it is more reasonable to add nonlocal delay term into model.Similarly,the nonlocal delay term is also applicable to the epidemic model[18,19].
To describe the above phenomenon,we introduce a nonlocal delay term

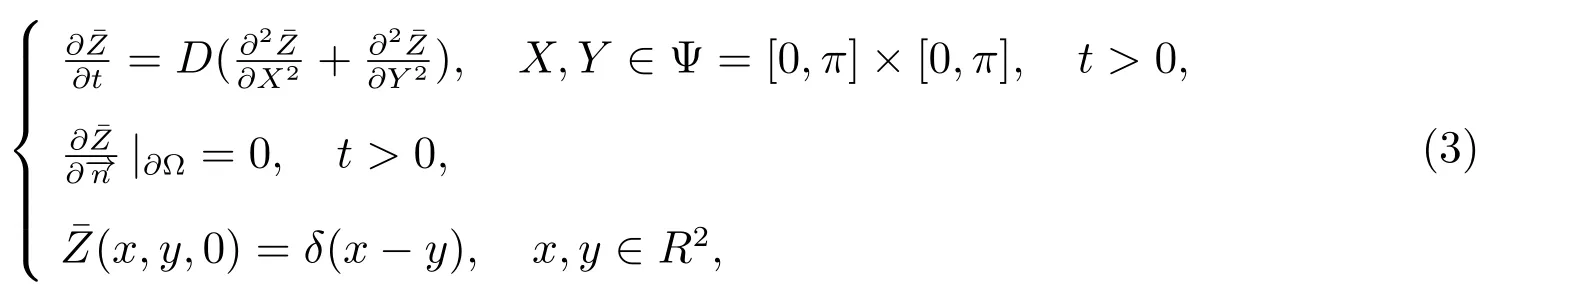
whereΩ=[a1,a2]×[a1,a2],x,y∈Ω.Vrepresents the weighted average of water uptake at root at different positions before the current moment. ¯Z(x,t)f(t)is the weight of water from other locations to the current location before timet.At present,some scholars have studied the reaction-diffusion equation with nonlocal delay[20–22].However,there is little research on nonlocal delay in vegetation systems.
To sum up,models added nonlocal delay term have more practical significance for predicting the growth of vegetation.In this paper,a vegetation-water model with Holling-II functional response function and nonlocal delay is established.The organization of the article is as follows.Firstly,we derive the mathematical model.Secondly,we study the stability of the equilibria and derive the conditions for the emergence of Turing pattern.Finally,the relevant conclusions are given through numerical simulations.
2 M odel derivation
Klausmeier[23]proposed a system of vegetation(N)and water(W)which was considered the presence of a slope in 1999:


Figure 1 Nonlocal action diagram of vegetation and water

Figure 2 The diagram of Holling-II functional response function
Therefore,the model(1)can be rewritten as follows
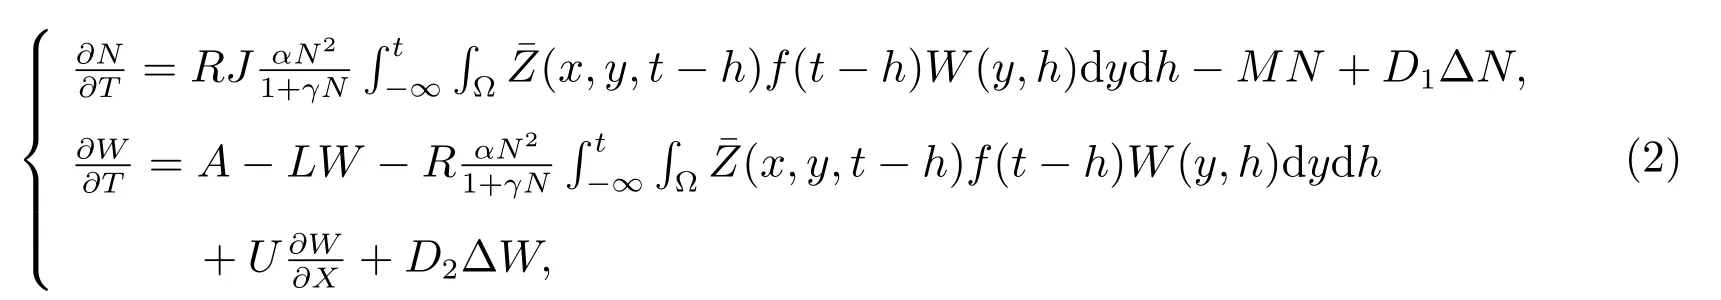
whereD1andD2are the diffusion coefficients ofNandW,respectively.f(t)is the weak kernel and the expression is as follows[24]

The expression of nonlocal delay is as follows

and

According to the properties ofδfunction and equation(3),the above equation can be derived as follows

Based on theabovederivation,thesystem(2)can betransformed into thefollowing form

Considering the growth of vegetation on flat land,we supposeU=0.The model(4)is converted into

We perform nondimensionalization as follows

Then the system(5)becomes the following form

Three equilibria of the model(6)can be obtained through calculation
E0=(0,a,a),
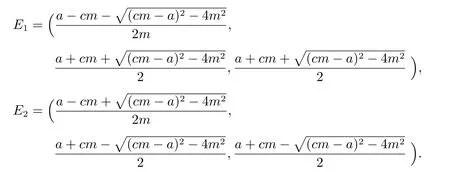
E0represents the bare ground equilibrium point.The equilibriaE1andE2exist if and only ifa>(2+c)mholds.
3 Linear analysis and Turing p atterns
3.1 Stability analysis of equilibrium E 1
The linearized system of(6)at equilibriumE1is

where
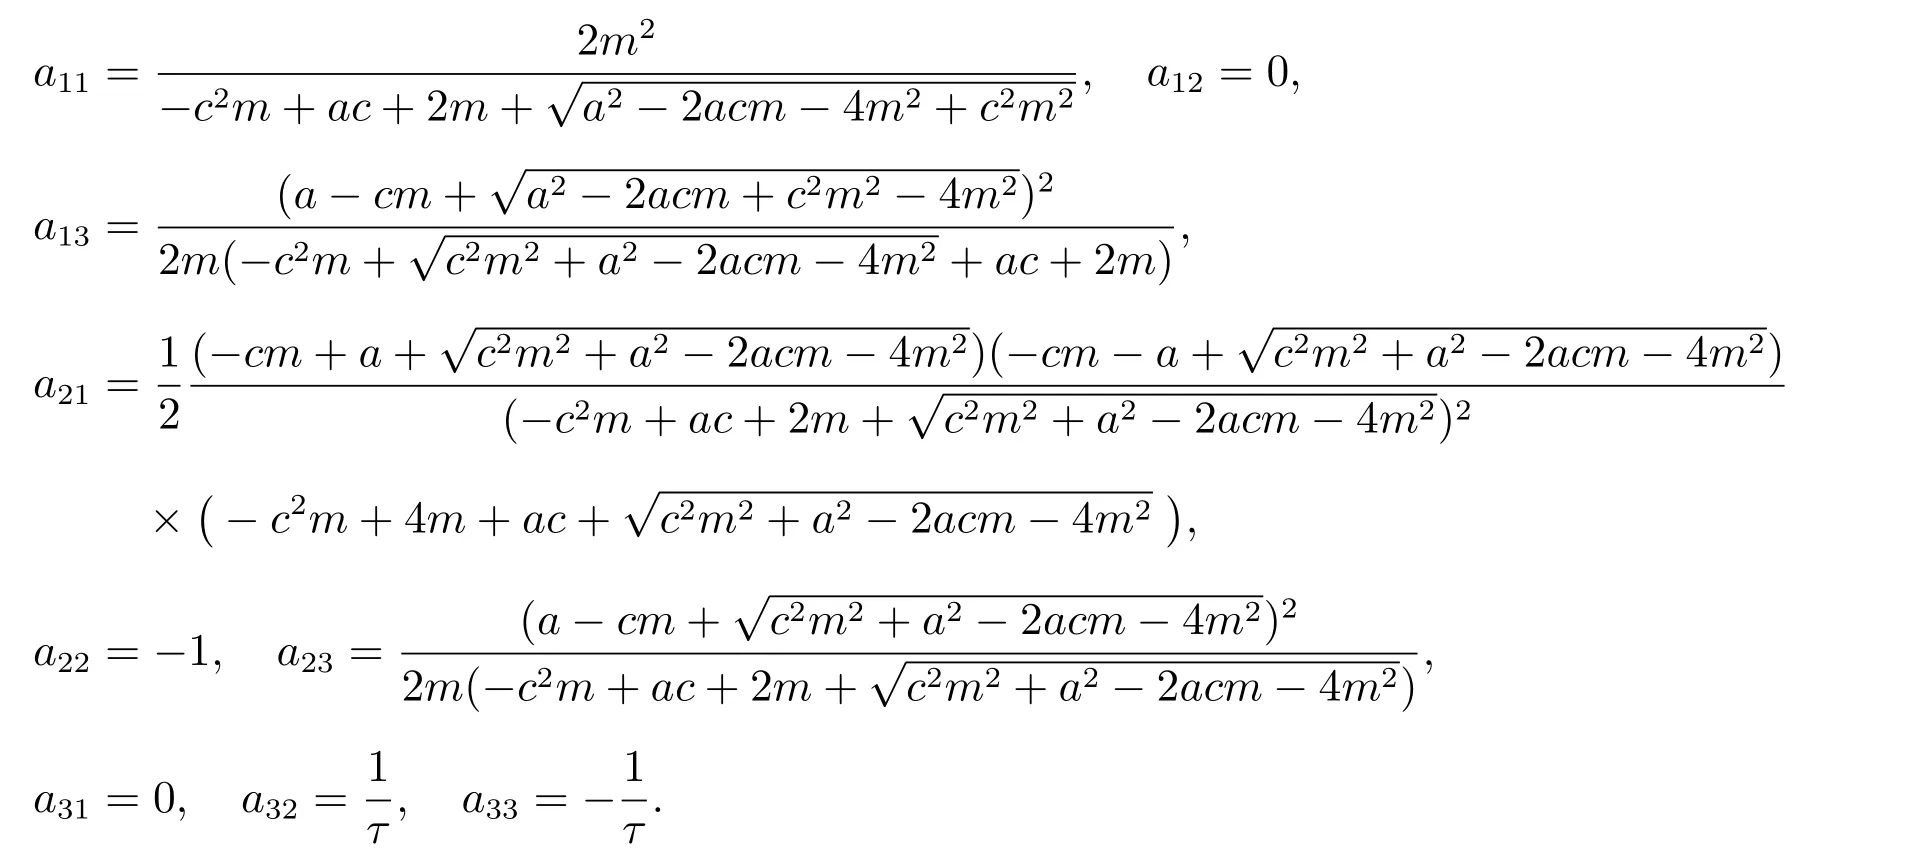
According to the system(7),the following characteristic equation can be obtained
According to the Routh-Hurwitz criterion,the equilibriumE1is stable under the following conditions[25]

By calculation,the three conditions in(8)cannot be satisfied at the same time,soE1is unstable.
3.2 Stability analysis of equilibrium E 2
The linearized system of(6)at equilibriumE2is as follows

with
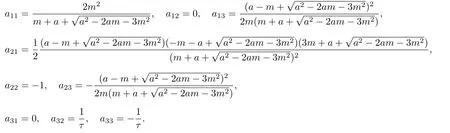
Let

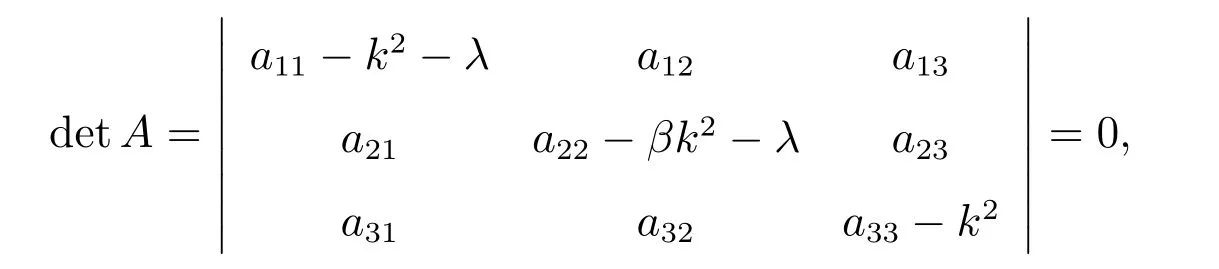
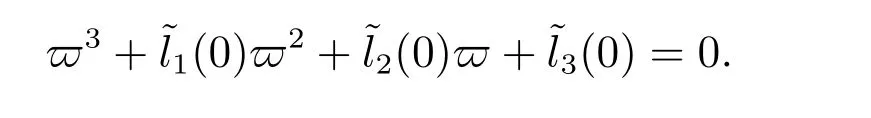
which is equivalent to
λ3+l1(k)λ2+l2(k)λ+l3(k)=0.
Thecharacteristic equation of thesystem(9)without thediffusion term isasfollows
λ3+l1(0)λ2+l2(0)λ+l3(0)=0.
According to Routh-Hurwitz criterion,we have the stable condition of equilibriumE2as follows
The conditions for the production of Turing pattern are that equilibrium is stable without diffusion and unstable with diffusion.We discuss the following three cases by the condition for generation of vegetation pattern.
Case 1l1(k)>0
Sincel1(k)=(β+d+1)τk2+l1(0),it is easy to obtain thatb1(k)>0 is always established whenl1(k)>0.
Case 2l3(k)>0
Letl3(k)=F(z),z=k2,thenF(z)=f1z3+f2z2+f3z+f4.
F(z)has two extreme points
z1,z2are the minimum and maximum points ofF(z),respectively.
In conclusion,Turing pattern is induced under the condition of(10)combined with the following inequality

Case 3l1(k)l2(k)−l3(k)>0
LetP(z)=l1(k)l2(k)−l3(k),z=k2,thenP(z)=p1z3+p2z2+p3z+p4,andp1,p2,p3,p4are known.
P(z)has two extreme points

z1is the minimum point.
In summary,sufficient condition for generating Turing pattern are(10)combined with the following inequality

Figure 3 shows the region of Turing pattern,which is composed of parametersmandτ,the other parameters are:a=3.5,β=50,c=1,d=1.In the regionT,a rich steady state pattern can be generated.
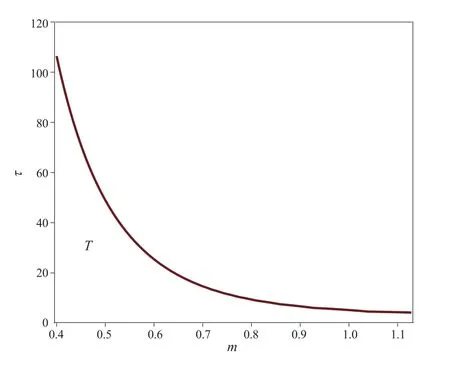
Figur e 3 Bifurcation diagram of system(6)
4 Numerical results
In this part,the dynamic behavior of system(6)is analyzed by numerical simulation.The boundary condition is Neumann boundary.The selected space region is[0,100]×[0,100]and the time interval is[0,300].We mainly study the influence of delayτon vegetation through numerical simulation.The parameters selected should satisfy the conditions for generation of Turing pattern.
4.1 The effect of delayτon the formation of vegetation pattern
In this subsection,we study the effects of different delayτon vegetation pattern.Figure 4 and Figure 5 show the succession of vegetation pattern whenτ=1.98 andτ=2.45,respectively.Other parameters area=3.5,m=1.0,β=50,c=1,d=1.It can be seen from these two figures,the vegetation pattern is evenly distributed at the beginning.With the increase of time,the vegetation distribution becomes uneven.When the time is large enough,regular patterns will appear,which indicates that vegetation will eventually gathers together and form mixed patterns.
Figure 6 shows the vegetation pattern in the final stablestate with different delays.As seen from Figure 6,with the gradual increase ofτ,the structure of the vegetation pattern changes significantly.When the delay is large enough,the vegetation pattern shows a band structure.
Figure 7 shows the two-dimensional spatial distribution of vegetation under different delays,which can intuitively reflect the change of vegetation with space.In order to more accurately simulate the change of vegetation density with delay.Figure 8 is given.One can conclude from this figure that the influence of delay on vegetation density presents“parabolic phenomenon”.Obviously,there is a threshold value of delayτ.Whenτis less than the threshold value,the vegetation density will decrease with the increase ofτ.Whenτis greater than this threshold,the vegetation density will increase with the increase ofτ.
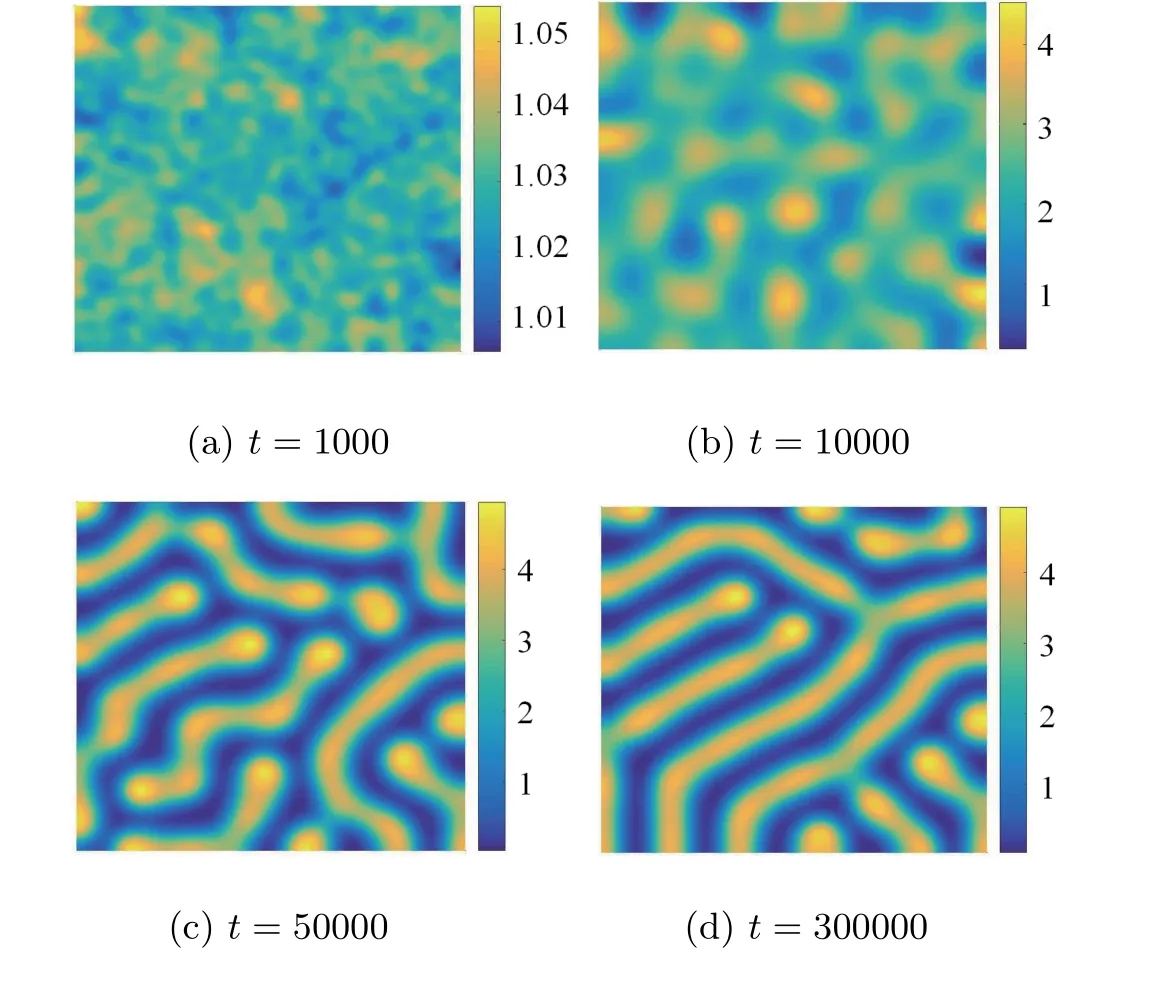
Figure 4 Whenτ=1.98,the evolution of vegetation density over time

Figure 5 Whenτ=2.45,the evolution of vegetation density over time
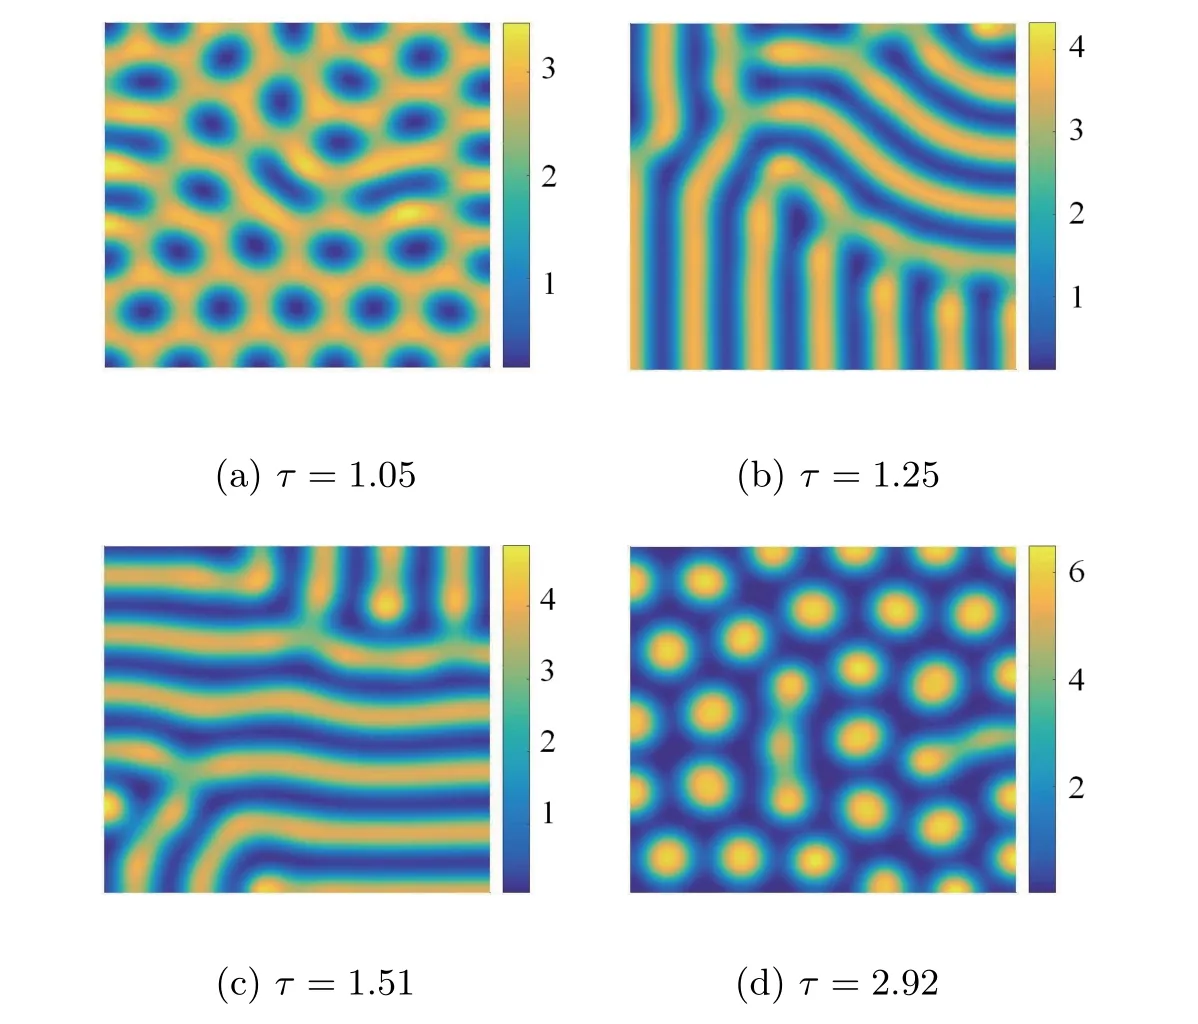
Figur e 6 When a=3.5,m=1.0,β=50,c=1,d=1,differentτ corresponds to the vegetation patterns

Figure 7 when a=3.5,m=1.0,β=50,c=1,d=1,differentτ corresponds to the spatial distribution of vegetation

Figure 8 The change process of the average density of the vegetation with parameterτ
4.2 The effect of parameter c on formation of vegetation p attern
In the ecological sense,functional response function also plays an important role in the formation of vegetation pattern.Consequently,the effect of parametercis analyzed through numerical simulation.Figure 9 verifies the relationship betweencand average vegetation density,which indicatesthat parametercispositively correlated with averagevegetation density:cislarger,theaveragevegetation density ismorelager;On the contrary,the average vegetation density is smaller.Besides,with the increase of time,the average vegetation density tends to a constant.It is worth noting that whenc=0 which means that there is no Holling-II functional response function in the model,the average vegetation density is the lowest.It can be concluded that the average density of vegetation can be increased by adding Holling-II functional response function into vegetation models.
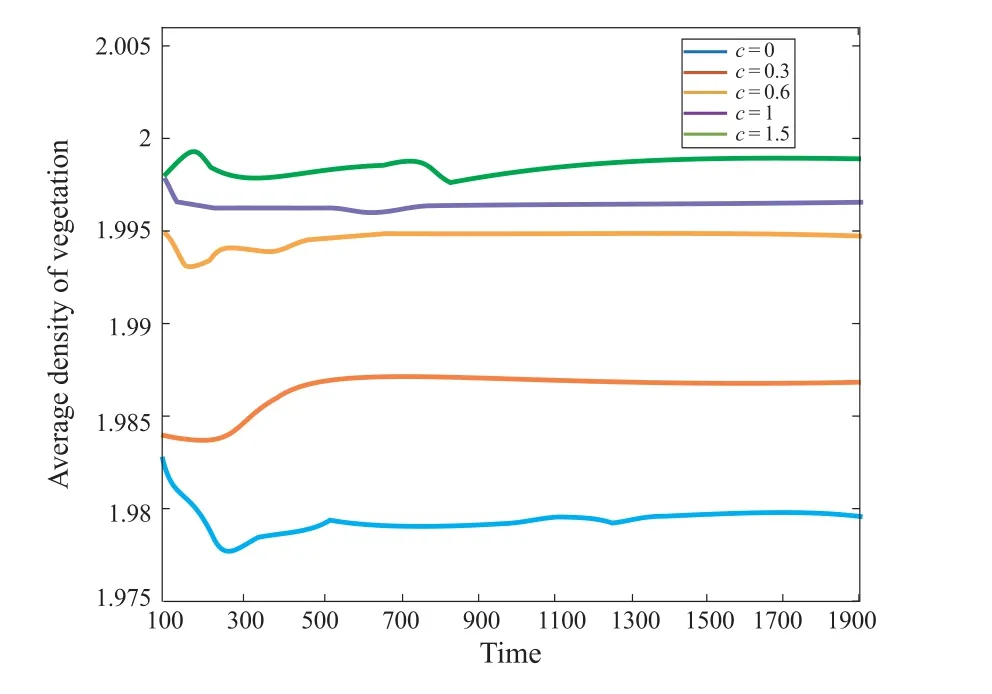
Figure 9 Relationship between average vegetation density and parameter c,other parameters are fixed as a=3.5,m=1,β=50,d=1,τ=1.51,respectively
5 Conclusions and discussion
In the process of vegetation roots absorbing water,it not only absorbs the water at the current position,but also absorbs the water in the vicinity over a certain period of time.In addition,vegetation has a saturation effect on water.In order to study the effects of nonlocal delay and saturation effect on vegetation pattern,the model with nonlocal delay term and Holling-II functional response function is established.The model is a reaction diffusion equation with two variables and the boundary condition is Neumann boundary.This two-variable model is converted into a three-variable model by mathematical derivation.Through mathematical analysis,the stability of the positive steady state is proved,and the conditions for generation of Turing pattern are obtained.The corresponding vegetation pattern under different delays is given by numerical simulations.
The simulation results show that when delay is less than the threshold,asτincreases,the average density of vegetation decreases.Conversely,the average density of vegetation will increase with the increase ofτ.With the gradual increase of delay,vegetation pattern is transformed from uniform distribution to nonuniform distribution,and banded pattern appears.The minimum average density of vegetation is obtained at the threshold of delay and desertification is more likely to occur.Besides,the spatial distribution of vegetation under different delays is simulated.
It is interesting that parametercis positively correlated with average vegetation density.This means that in arid or semi-arid areas where water resources are scarce,vegetation models with Holling-IIfunctional response function aremore likely to reflect a greater and morethorough absorption of water by vegetation.Thepaper’s conclusion provides a theoretical basis for the protection of vegetation.
In this paper,the impact of precipitation on vegetation is mainly considered.However,with the climate change and the emergence of extreme weather in recent years,there are many uncertain factors for vegetation growth.At the same time,other meteorological factors also have impact on vegetation.In the next research,we will integrate different meteorological factors into the vegetation model based on the observation data.Moreover,our research can also be applied to other fields of biological mathematics,such as infectious disease model and population model.
猜你喜欢
国家教育行政学院学报(2022年5期)2022-06-30
无机化学学报(2021年7期)2021-07-10
高校应用数学学报A辑(2021年1期)2021-03-16
科学导报(2021年91期)2021-01-11
中北大学学报(自然科学版)(2019年6期)2019-11-22
会计之友(2019年21期)2019-11-07
无机化学学报(2019年5期)2019-05-07
———理学院
西安航空学院学报(2018年1期)2018-02-05
会计之友(2016年24期)2017-01-09
浙江科技学院学报(2012年4期)2012-11-05
