
Effects of mesoscale eddies on the spatial coherence of a middle range sound field in deep water
2022-11-21 09:29FeiGao高飞FangHuaXu徐芳华andZhengLinLi李整林
Chinese Physics B 2022年11期
关键词:芳华
Fei Gao(高飞) Fang-Hua Xu(徐芳华) and Zheng-Lin Li(李整林)
1Department of Earth System Science,Ministry of Education Key Laboratory of Earth System Modeling,Institute for Global Change Studies,Tsinghua University,Beijing 100084,China
2Naval Research Institute,Tianjin 300061,China
3School of Ocean Engineering and Technology,Sun Yat-Sen University,Zhuhai 519000,China
Mesoscale eddies have a remarkable influence on the underwater sound field.Many previous studies have investigated the effects of eddies on transmission loss,the convergence zone,time delay,etc. However,the effects of eddies on spatial coherence are less well studied and remain unclear.In this paper,the effects of eddies on spatial coherence at the subsurface in deep water are investigated. The eddy environments are simulated with Gaussian eddy equations,the complex pressure field is obtained using a range-dependent parabolic equation model and the associated mechanism is analyzed based on ray theory and models. The results show that cold/warm mesoscale eddies affect spatial coherence in a high-intensity zone by changing the locations and width of the convergence zone. In the shadow zone, the horizontal correlation radius and the vertical correlation radius increase with range and decrease with depth, and they are increased by warm eddies and decreased by cold eddies,mainly caused by variation of the multipath structure.
Keywords: mesoscale eddy,horizontal coherence,vertical coherence,multipath arrivals
1. Introduction
Spatial coherence,in a horizontal or vertical direction,[1,2]describes the level of similarity of an acoustic signal between two positions, and is usually quantified using a correlation coefficient.[3]With strong spatial coherence, the target signal with a small signal to noise ratio (SNR) can be recognized well,and this is crucial for SONAR signal processing,detection,localization and communication,etc. It is of great importance to understand the spatial coherence of sound fields.
Mesoscale eddies, ubiquitous in the world’s oceans, are very important for ocean circulation and material exchange in the oceans. These rotating and propagating water masses[4]have a horizonal scale of about 100 km, a vertical scale of about 1000 m and a lifespan ranging from weeks to years.Mesoscale eddies are accompanied by temperature and salinity anomalies,[5,6]resulting in abnormal sound speed fields.Therefore,it is crucial to study of effects of mesoscale eddies on the sound field and spatial coherence.
In the past several decades, the influence of mesoscale eddies on the sound field has concerned both acousticians and oceanographers. The early studies that started in the 1970s were mainly based on the results of acoustic numerical modeling and theory derivation. Some classic features were discovered about the effects of eddies on transmission loss (TL),[7]the convergence zone,[8]refraction,[9]and time delay.[10]With the development of theoretical acoustic models and underwater acoustic experiments in deep water, many features have been interpreted theoretically and validated within situacoustic data and synchronous hydrographic data.[11,12]It has been found that mesoscale eddies can change the normal modes or the propagation path of acoustic rays. Meanwhile,the impacts of mesoscale eddies on long-range acoustic deflection, pulse width and arrival patterns have also been studied using highresolution ocean reanalysis data or ocean models,[13,14]indicating that the eddies make the arrival patterns of sound fields complex so that it is hard to resolve individual arrivals.
However, little of this prior work has been about the effects of eddies on acoustic spatial coherence. In this paper,horizontal and vertical coherence in cold or warm eddy environments is studied, and variations of the horizontal correlation radius(HCR)and vertical correlation radius(VCR)with range and depth are also analyzed. In addition,the mechanism of propagation is analyzed from the phase and amplitude terms of the complex pressure.
This paper is organized as follows. Section 2 introduces the methods for construction of mesoscale eddy environments,calculation of correlation coefficients and the model configuration. The numerical results are presented in Section 3. In Section 4,discussion and interpretation of the results are provided. The main conclusions are presented in Section 5.
2. Model and method
2.1. Construction of the eddy environment
Mesoscale eddies can be classified into cyclonic eddies and anticyclonic eddies. In the northern hemisphere,cyclonic eddies rotate anticlockwise with the temperature inside being often lower than that outside of the eddy range. The features of anticyclonic eddies are opposite to those of cyclonic eddies.Cyclonic(anticyclonic)eddies are also called cold(warm)eddies.
The three-dimensional structure of an eddy is often‘bullet-shaped’,[15]with a radius at the subsurface bigger than that in deeper layers. In general, the temperature or salinity anomalies decay exponentially with distance from the eddy core. The maximum anomalies of temperature and salinity can be bigger than 7.7°C and 1.0 psu (practical salinity unit),respectively,generating a sound speed anomaly of about 20.5 m/s.
The Gaussian eddy model is a simplified ideal hydrology model[16]that is widely used to describe the structure of mesoscale eddies and its effects on underwater acoustic propagation.[7,11,12]In a cylindrical coordinate system, the Gaussian eddy model comprises two simple parts

wherec0is the mean sound speed profile,which is a function of depthzand represents a range-independent environment for acoustic propagation. Δcis the sound speed perturbation term caused by the mesoscale eddy, and it is a function ofzand ranger. So, the results forcrepresent a range-dependent environment that contains sound speed perturbations superimposed on a deep-water sound speed profile. For the Munk sound speed profile,c0(z)can be expressed as

whereη= 2(z-zcx)/zcx, withzcxbeing the depth of the deep-sea sound channel.DCis the intensity of the eddy,reandzeare the locations of the eddy core andRandZare,respectively, the horizontal and vertical radii of the eddy. According to the reported mesoscale eddy features,[4–6]eddy intensityDC,horizontal rangereand vertical depthzeof the eddy core,horizontal radiusRand vertical radiusZare taken to be 10 m/s(warm eddy),-10 m/s(cold eddy),50 km,150 m,50 km,and 700 m,respectively. The eddy environments calculated with a Gaussian eddy model are presented in Fig.1.

Fig.1. Sound speed calculated based on a Gaussian eddy model: (a)observed mean sound speed profile,(b)cold eddy environment,(c)warm eddy environment.
The data shown in Fig. 1(a) represent a summer sound speed profile observed in the South China Sea. The sound speeds at the surface and bottom are 1538.2 m/s and 1529.4 m/s, and the minimum sound speed is 1484 m/s at a depth of 1180 m; it is an incomplete sound channel environment. The maximum sound speed perturbations in cold and warm eddy environments are 10 m/s and-10 m/s.
2.2. Model configuration and fundamental knowledge
Figure 2 shows a schematic of the numerical modeling configuration. The sound source is set at the edge of the eddy at a depth of 150 m and sound speed 1515.1 m/s,so the sound waves can propagate from outside to inside the eddy.With this configuration, the first convergence zone appears at about a range of 50 km from the source,close to the eddy core. Meanwhile,the horizontal sound speed gradient is monotonic,ranging from 0 km to 50 km.Therefore,the eddy has the maximum effect on the sound field.
The sea floor is set to be flat and the water depth is 4200 m. The parameters of the sediment layer are as follows:thickness 20 m,sound speed 1550 m/s,density 1.5 g/cm3,attenuation coefficient 0.25 dB/λ. The parameters of the base layer are as follows:sound speed 1700 m/s,density 2.0 g/cm3,attenuation coefficient 2 dB/λ.
It is necessary to provide some fundamental knowledge about the sound field structure and multipath patterns, which are closely connected with the spatial coherence features analyzed in the following. The area for analysis is focused on a depth of 0 m–300 m and a range of 0 km–60 km. The complex sound field structure,in a no eddy environment,is shown in Fig. 3(a). It can be seen that the direct zone, the shadow zone and the convergence zone exist in the ranges 0 km–3 km,3 km–48 km,and 48 km–60 km,respectively.
Since the amplitude of the reflected arrivals is much smaller than that of the direct arrivals, most energy in the direct and convergence zones is primarily from direct arrivals(Figs. 3(b) and 3(d)). The arrivals in the shadow zone are mainly made up of two groups of rays (Fig. 3(c)). Each ray group consists of bottom reflected rays and bottom–surface reflected rays. When both the source and receivers are in the shallower parts of deep water it is hard to distinguish the arrivals in each group.

Fig.2. A sketch map of acoustic numerical modeling in an eddy environment.

Fig.3. Numerical results of TL versus range and depth(a)and amplitude versus time delay at a depth of 150 m at three different ranges: (b)1.5 km,(c)25 km,and(d)55 km.
2.3. Coherence function
The coherence of underwater acoustic signals can be quantified by correlation coefficients and correlation radii.The correlation coefficientCof complex sound pressurepin the frequency domain is defined as[17]

wherepr,z,ωandpr+Δr,z+Δz,ωare the sound pressures of two different points(r,z)and(r+Δr,z+Δz),randzare the horizontal range and vertical depth in cylindrical coordinates,ω1andω2are the lower and upper angular frequencies of the integral interval and*denotes complex conjugation. If Δz=0,Crepresents the horizontal correlation coefficient. If Δr=0,Crepresents the vertical correlation coefficient. The range or the depth are defined as the correlation radius,whereCdrops to less than 0.7. Re denotes the real part. eiφ0is the phase correction term to obtain the maximum value ofC, which is crucial for numerical calculation.
The parabolic equation (PE) theory model and ray theory model are used in this work. The PE model can handle sound speed with horizontal variation and achieve high precision with calculation stability,fit for modeling acoustic propagation in the range-dependent environment of a mesoscale eddy. The ray model calculates the time delay of different arrivals with different source/receiver angles,providing data for feature analysis and interpretation.
We set the source frequency to be 175 Hz–225 Hz and the frequency interval to be 1 Hz,and ran the acoustic model with different source frequencies in cold eddy, no eddy and warm eddy environments to obtain the sound pressure.
3. Numerical results
This section presents the numerical results for horizontal and vertical coherence. Due to the close connection of the high-intensity zone with spatial coherence, the effects of a mesoscale eddy on spatial coherence in the shadow zone and high-intensity zone are analyzed separately.
3.1. Horizontal coherence
Figure 4 shows the horizontal correlation coefficients in cold, no and warm eddy environments in the range of 0 km–45 km.In all subplots,the correlation coefficient contours vary from 0.7(equal to the coherence radius)to 1,with a horizontal range of 0 km–45 km from the source and a horizontal separation of 0 m–600 m.
It can be seen that the horizontal coefficient oscillates with range and horizontal separation,consistent with the findings of previous studies.[18,19]The sound field in the direct zone is strongly correlated and the HCR is greater than 1 km.The direct zone appears at the edge of the eddy, so the effect of eddies on the HCR in the direct zone is very weak.
Comparing the subplots in Fig.4, it can be seen that the horizontal coefficient increases significantly with range and decreases rapidly with depth. At a depth of 150 m in the no eddy environment(Fig.4(e)),the HCR increases from 0 m to 634 m over a horizontal range of 3 km–36 km. At the same time,the HCR in the 25 km range in the no eddy environment drops from 381 m(Fig.4(b))to 141 m(Fig.4(h)). It should be noted that the numerical modeling is carried out in the absence of noise,and spatial coherence in the far field will decrease due to the smaller SNR in real ocean environments.
Comparing the horizontal coefficients in Fig.4 in different environments, it is found that the differences are not so significant in the near field and become apparent as the range increases. According to the model configuration in Subsection 2.2, the source is 50 km from the eddy core and the sound pressure disturbance increases with propagation toward the eddy core,resulting in larger differences in the coherence coefficients in different eddy environments.
To verify this conclusion,another simulation experiment was carried out using the same environment as before, while the source was placed at the eddy core and the sound allowed propagate outward from the eddy core; the numerical results are shown in Fig. 5. When the source is at the eddy core,the differences in the horizontal coefficient between different eddy environments are larger compared with when the source is placed at the edge of the eddy.

Fig. 4. Horizontal correlation coefficients in the shadow zone in cold, no and warm eddy environments (panels from left to right) at three receiver depths:(a)–(c)50 m,(d)–(f)150 m,and(g)–(i)300 m.
In addition, the HCR in the warm eddy environment is the greatest when the source is at the edge of the eddy, while it is smallest when the source is at the eddy core, due to the opposite sound speed gradient.
Figure 6 shows the horizontal correlation coefficients near and in the convergence zone(range 45 km–60 km)for different environments. The HCR becomes complex with depth,range and environment,and is closely related to the spatial variability of the convergence zone. First,the horizontal coherence is strong and the maximum HCR can be larger than 2 km, consistent with the findings in Ref.[20]. Second,cold eddies can bring a larger HCR to shallower depths (Fig. 6(a)), and the larger HCR range increases sequentially in cold,no and warm eddy environments (Figs. 6(d)–6(f)). Third, two HCR peaks appear at ranges of 49 km and 58 km for the no eddy environment with a horizontal shadow between them(Fig.6(g)),and in the no and warm eddy environments their positions move toward a larger range(Figs.6(h)and 6(i)).
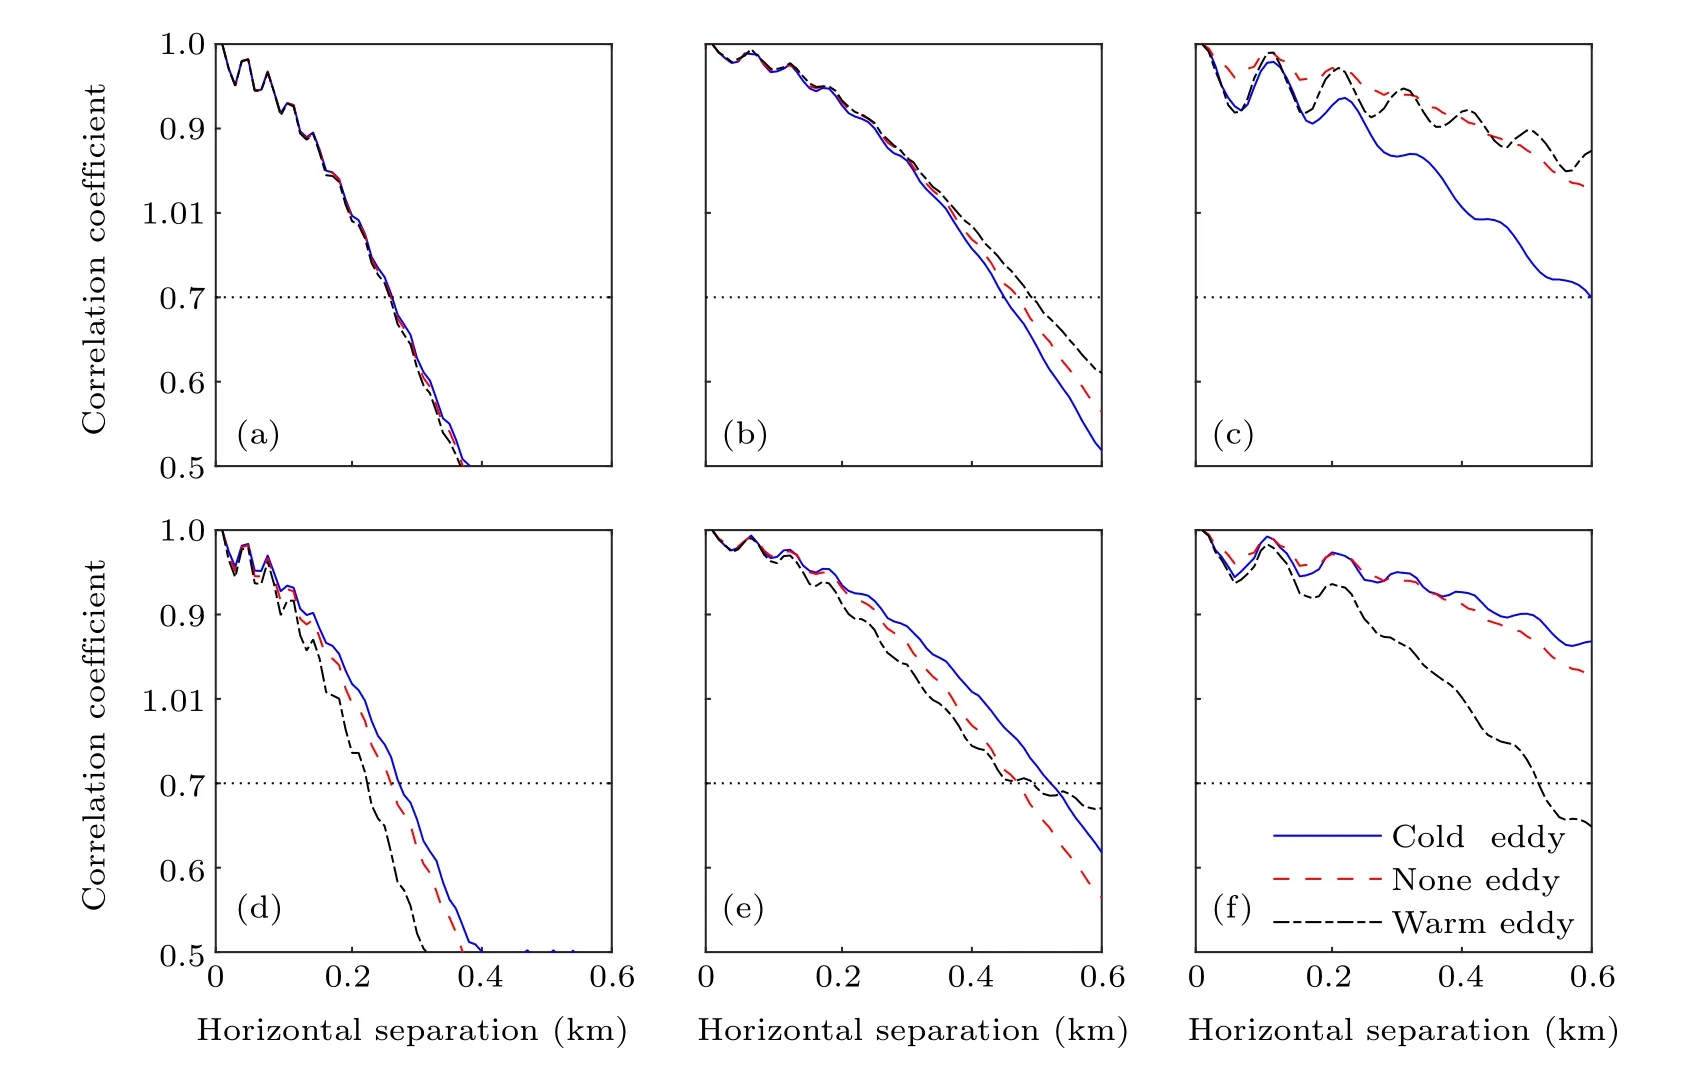
Fig.5. Correlation coefficients versus horizontal separation for two source–receiver configurations at three receiver ranges: (a)–(c)are at receiver ranges of 15 km,20 km,and 35 km,respectively,with the source at the eddy edge;and(d)–(f)are at receiver ranges of 15 km,20 km,and 35 km,respectively,with the source at the eddy core.

Fig.6. Horizontal correlation coefficients in the convergence zone in cold,no and warm eddy environments(panels from left to right)at three receiver depths:(a)–(c)50 m,(d)–(f)150 m,and(g)–(i)300 m.
3.2. Vertical coherence
Figure 7 shows the vertical correlation coefficients in the shadow zone at three ranges, 15 km, 25 km, and 35 km, in cold,no and warm eddy environments,respectively. By comparing the subplots of different ranges in Fig.7 it can be seen that the VCR also increases with range and decreases with depth, and differences in VCR between different eddy environments increase with range. The VCR in the warm eddy environment is the biggest,corresponding to the variation features of HCR analyzed above.
Figure 8 shows the vertical correlation coefficients in the convergence zone at two reference ranges,53 km and 58 km,in cold,no and warm eddy environments,respectively. Overall,the vertical coherence is much stronger than in the shadow zone,and the correlation coefficients increase with depth. By comparing the VCR in different eddy environments,it can be seen that cold eddies make the VCR shallower and warm eddies deepen it. For example, the strong vertical coherence layer starts from depths of 38 m, 60 m, and 80 m in cold, no and warm eddy environments,respectively.
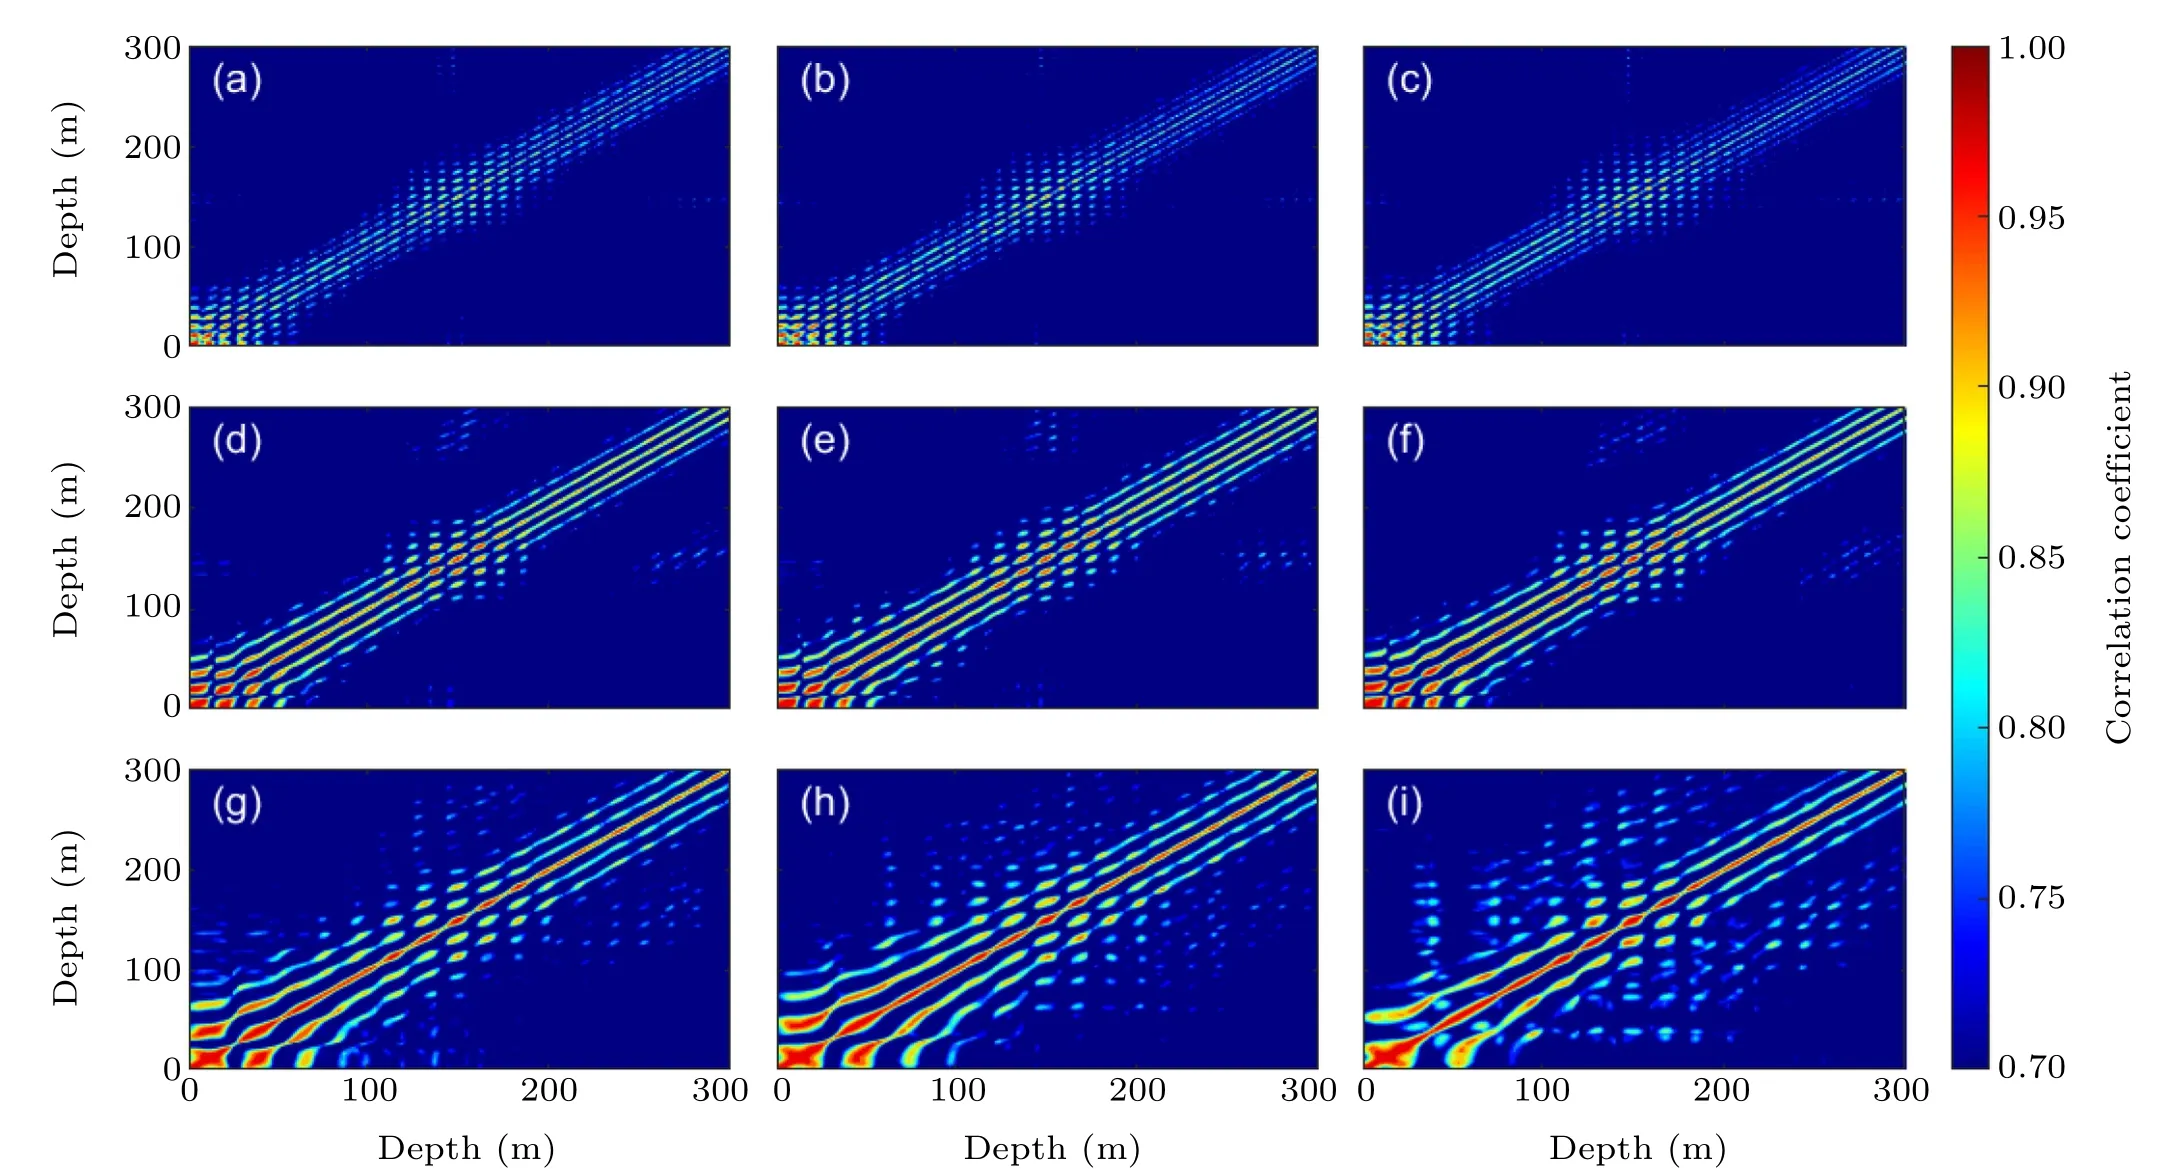
Fig. 7. Vertical correlation coefficients (shaded) in the shadow zone in cold, no and warm eddy environments (panels from left to right) at three receiver ranges: (a)–(c)15 km,(d)–(f)25 km,and(g)–(i)35 km.

Fig.8. Vertical correlation coefficients(shaded)in the convergence zone in cold,no and warm eddy environments(panels from left to right)at two receiver ranges: (a)–(c)53 km and(d)–(f)58 km.
4. Discussion
The complex pressurepat the site(r,z)and angular frequencyωcan be written in the form of a product of a slowly evolving amplitudeAand a rapid changing phaseφ
wheren=1,2,...,N,Nbeing the total number ofωpoints to be calculated. Set themth arrivalpr,ω,m=Ar,ω,meiφr,ω,mandpis the sum of multipath arrivals

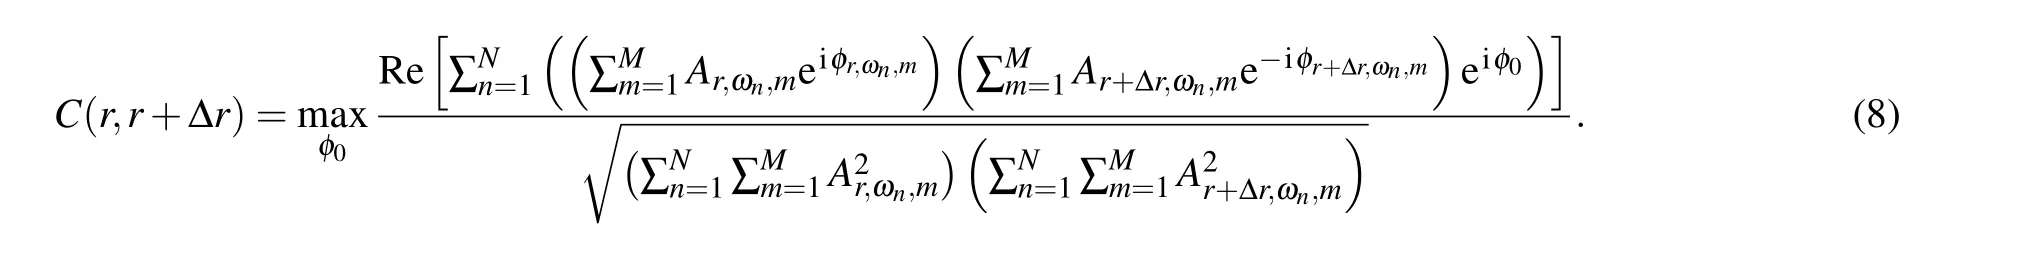
wherem=1,2,...,M,Mbeing the total number of arrivals,and it can be seen that the amplitude and phase ofpr,ωare affected by each arrival. Substituting the multipath complex pressure from Eq.(7)into Eq.(6),the correlation coefficient is calculated as
The multipath arrivals are divided into two groups of eigenrays, group 1 containing only arrivals that do not interact with the boundary and group 2 containing arrivals that are reflected from the surface or the bottom boundary.
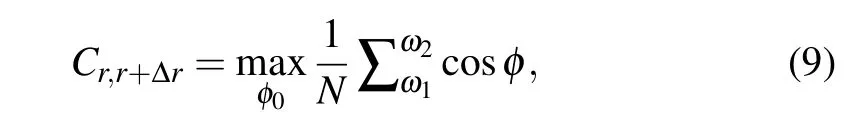
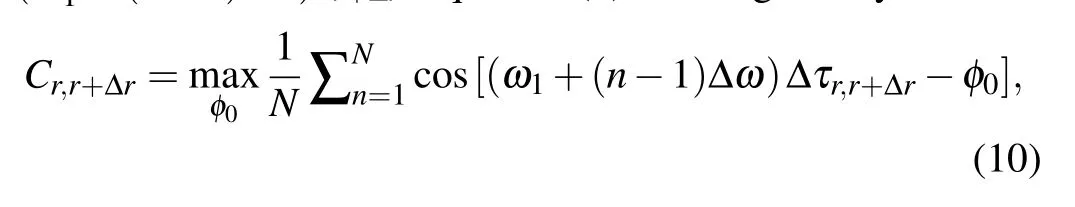
Under realistic conditions,the multipath arrivals received by a hydrophone can be divided into two main cases: the first case is that multipath arrivals,including group 1 and group 2,are received,which is the actual situation in the high intensity zone; the second case is when only the eigenrays of group 2 are received,and this is consistent with the shadow zone.
4.1. Interpretation for the high intensity zone
Considering the first case, a hydrophone receives multipath arrivals, including group 1 and group 2, with group 1 having a much larger amplitude than group 2 (Ar,ω,group1≫Ar,ω,group2), i.e.,Ar,ω ≈Ar,ω,group1,φr,ω ≈φr,ω,group1, andφr+Δr,ω ≈φr+Δr,ω,group1,and this corresponds to the real conditions in the high-intensity zone.
If the volume attenuation of water absorption is neglected,the amplitude termAr,ω,group1evolves slowly in small range of narrow angular frequency bands (Fig. 9(a)), soAr,ω,group1≈Ar+Δr,ω+Δω,group1. Then,pr,ω ≈Ar,ω,group1eiφr,ω,group1andpr+Δr,ω+Δω ≈Ar,ω,group1eiφr+Δr,ω+Δω,group1. One can simplify Eq.(8)as
whereφ=φr,ω-φr+Δr,ω+φ0. Then, the correlation coefficient function is only related to the function cos(·). The
phaseφr,ωandφr+Δr,ω, for group 1, is just the function of angular frequency and arrival time, which varies periodically and decreases uniformly with increasing angular frequency(Fig. 9(b)). Since the eigenray propagates without interaction with the boundary,φr,ωdepends only on the arriving time delayτr. Settingφr,ω=(ω1+(n-1)Δω)τrandφr+Δr,ω=(ω1+(n-1)Δω)τr+Δr,equation(9)can be given by
where Δτr,r+Δris the relative time delay between two different receivers and Δωis the angular frequency interval. If the angular frequency band and interval are fixed, the spatial coherence will depend on Δτr,,r+Δr. By adjustingφ0, the maximumCr,r+Δrcan be obtained. Equation (10) is suitable for explaining the strong spatial coherence in the direct and convergence zones(Fig.9(c)),which can also be interpreted as a high-intensity zone leading to high spatial coherence.
Many papers on the effect of mesoscale eddies on acoustic propagation have reported that the location (range and depth) and width of the convergence zone change in a mesoscale eddy environment. The simulation results of TL,with a source frequency of 200 Hz according to the environments in Fig. 1 and model configuration in Fig. 2, are presented in Fig. 10, in which the blue and white lines are the direct rays and bottom reflected rays,respectively.
Mesoscale eddies lead to fluctuations of the sound speed in the horizontal direction, which changes the reversal depth of the ray. In a cold eddy environment,the sound speed gradually decreases in the horizontal direction from the source to the eddy core, making the reversal depth shallower. Apparently, a cold eddy brings the convergence zone closer to the source by about 2.2 km,moving it up towards the sea surface by about 30 m, and reduces its width (Fig. 10(a)) compared with the no eddy environment(Fig.10(b)). The influence of a warm eddy environment on the convergence zone is opposite to that of a cold eddy(Fig.10(c)). Based on the close connection between the convergence zone and high spatial coherence,the influence of mesoscale eddies on the spatial coherence of the high-intensity zone can be well explained.
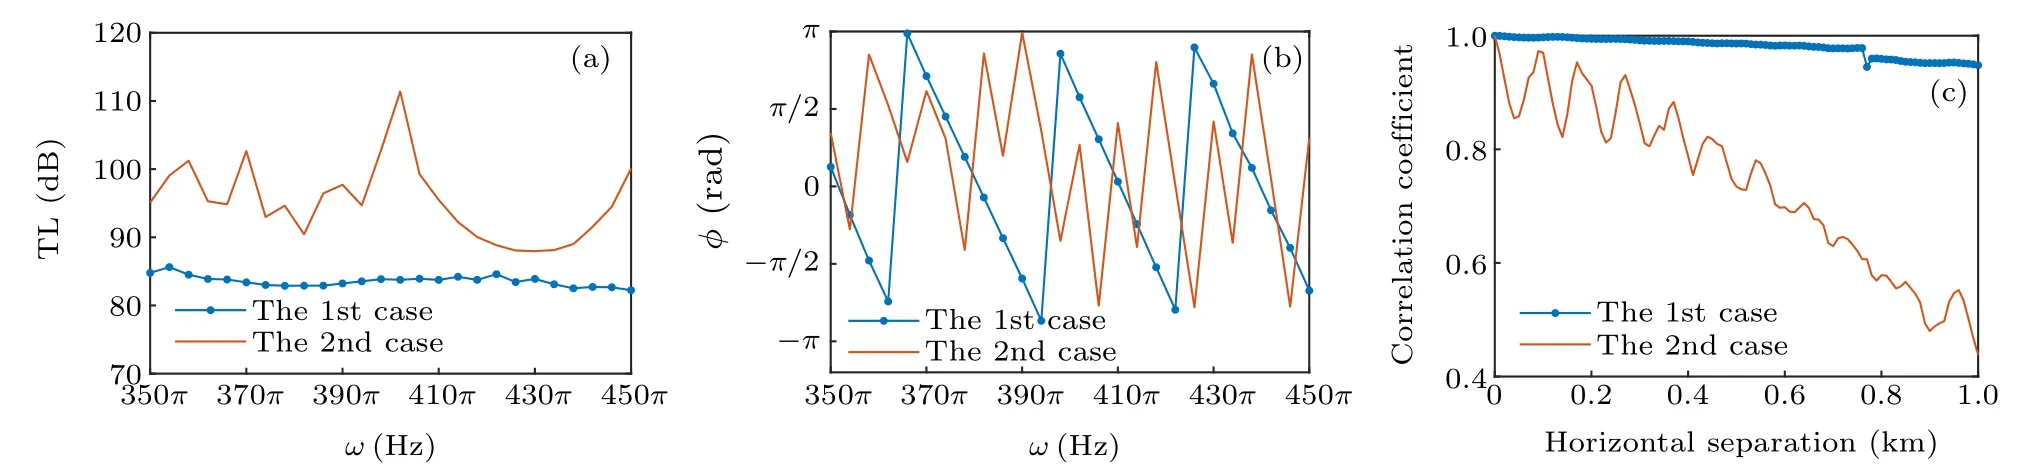
Fig. 9. Comparison of the results of the two cases: (a) TL versus angular frequency, (b) phase versus angular frequency, (c) correlation coefficient versus horizontal separation.

Fig.10. TL versus range and depth in different environments: (a)cold eddy environment,(b)no eddy environment,and(c)warm eddy environment.
4.2. Interpretation for shadow zone
Considering the second case, only group 2 eigenrays are received by the receiver,and it this corresponds to real conditions in the shadow zone.pr,ωin Eq.(7)depends on more arrivals along a different path.Ar,ωandφr,ωbecome complicated and disordered over an angular frequency band(Figs.9(a)and 9(b))as a consequence of boundary reflection,volume refraction and absorption, etc., resulting in a rapid decay of spatial coherence(Fig.9(c)).
TheAr,ω,mandφr,ω,min the shadow zone vary with horizontal range, angular frequency and propagation path. The simplified method for deriving Eq.(8)in Subsection 4.1 is not appropriate for the shadow zone,so it is hard to obtain a simple form to quantify the characteristics of the spatial coherence.
A simple numerical experiment is carried out to compare the influence ofAr,ωandφr,ωon the correlation coefficient by calculatingC,CφwithAr,ω=1 andCAwithφr,ω=0. Figure 11 shows the correlation coefficients versus horizontal separation for depth 150 m at three receiver ranges,10 km,25 km,and 45 km,in a no eddy environment with a source frequency of 200 Hz.
Three apparent features can be concluded by comparingC,Cφ, andCA. Firstly, the curves forCφincrease with range and are similar toCas a whole,which corresponds to the features of horizontal coherence in Fig.4(a).Secondly,the curves forCAare larger than forC, andCAdecreases with range.Thirdly,Cφvaries much faster thanCA,especially for the near field. Overall,φr,ωis the main factor affectingC, compared withAr,ω.

Fig.11. Correlation coefficient versus horizontal separation of at three receiver ranges: (a)10 km,(b)25 km,and(c)45 km.
Based on the conclusions above, a possible explanation for the physical mechanism of the variation of spatial coherence with range and depth is provided, which is focused onφr,ωand multipath structures.
In general, most of the energy of the complex pressurepr,ω, in the shadow zone comes from two sets of arrivals, the once-reflected arrivals and the twice-reflected arrivals(Fig.3(c)).If the eigenrays are reflected from the boundary more than twice, their complex sound pressure is far less than the first two sets of arrivals and their effects onφr,ωcan be neglected. Since the variation of the relative time delay Δτbetween the arrivals is similar,the Δτof the first set of arrivals,which consist of bottom reflected arrivals and bottom-surface reflected arrivals, is taken for the analysis. Δτis calculated using the ray theory model with a source frequency of 200 Hz.

Fig.12. Relative time delay(Δτ)of multipath arrivals: (a)Δτ versus range and(b)Δτ versus depth.
Figure 12(a) shows the relative time delay (Δτr,ω=τr,ω,2-τr,ω,1) versus range at three receiver depths, 20 m,150 m, and 300 m, and it can be seen that Δτdecreases with range, i.e., the shallower the receiver depth, the smaller Δτ. Figure 12(b) shows the relative time delay (Δτz,ω=τz,ω,2-τz,ω,1) versus depth for three receiver ranges, 10 km,25 km,and 45 km,and it is seen that Δτincreases with depth,i.e.the further the receiver range,the smaller Δτ.A smaller Δτindicates a shorter length of time for which the acoustic pulse is in the time domain,which implies simpler multipath structures and a slower spatial variation ofφr,ω, leading to higher spatial coherence.
In addition, the number of arrivals decreases with range,because the eigenrays of large source angles decay rapidly and cannot propagate to the far field;this also leads to simpler multipath structures and higher spatial coherence.
The coherent TL reflects multipath interference, and the more complex multipath structure leads to smaller spatial intervals of TL stripes and correlation lengths. To show more clearly the TL stripe of the shadow zone, figure 13 presents the 200 Hz sound field for a 50 m thick surface layer. It can be found that the spatial intervals of TL stripes decrease with increasing depth and increase with increasing range,which is consistent with the variation features of HCR and VCR analyzed above.
In addition, the spatial intervals of TL stripes are the largest in a warm eddy environment compared with cold eddy and no eddy environments,which can well explain the characteristics of HCR and VCR influenced by mesoscale eddies.

Fig.13. Coherent TL versus range and depth in the shadow zone in cold(a),no(b)and warm(c)eddy environments.
5. Conclusion
This paper presents insights into spatial coherence and its physical mechanism in medium ranges through mesoscale eddy environments. The results are given by numerical simulation using an empirical formula for mesoscale eddy environments and an acoustic numerical model for sound fields.The experimental configuration is designed to make acoustic waves propagate from outside to inside the mesoscale eddy,and allows the first convergence zone to be close to the eddy core. Several key conclusions are obtained as follows.
First,the spatial coherence is closely connected with multipath structures;a simpler multipath structure results in regular phase variation and unchanging amplitude over the angular frequency integral interval. The phase of the complex pressure is the main factor affecting spatial coherence compared with the amplitude.In addition,the phase depends on the main arrivals of the multipath structure.
Second,a mesoscale eddy changes the location and width of the convergence zone,thus significantly affecting spatial coherence in the high-intensity zone. The influences on spatial coherence from cold and warm eddies are opposite,and warm eddies deepen and widen the strongly correlated area, which also improves spatial coherence.
Third,a warm eddy environment increases the HCR and VCR while a cold eddy decreases them. HCR and VCR increase with range and decrease with depth, which can be interpreted by the spatial intervals of TL stripes and relative time delay between the bottom reflection arrival and bottom surface reflection arrival.
It should be noted that the results and conclusions are obtained based on the numerical configuration. The source/receiver/mesoscale eddy geometry and the intensity,radius and depth of the mesoscale eddy are all important parameters affecting the spatial coherence. Therefore,we have paid attention to the general features and their physical mechanism and do not provide quantified results.
Acknowledgments
Project supported by the National Key Research and Development Program of China(Grant No.2020YFA0607900),the National Natural Science Foundation of China (Grant Nos.42176019 and 11874061),and the Youth Innovation Promotion Association CAS(Grant No.2021023).
The authors are grateful to Chinese Academy of Sciences,Institute of Acoustics and personally to Dr Mengyuan Wang and Fanchen Dong for the provision of correlation coefficient code and discussions.The authors also wish to thank Dr Jun Li of the China State Shipbuilding Corporation and Dr Peng Xiao of the Southern Marine Science and Engineering Guangdong Laboratory for useful advice about the manuscript.
猜你喜欢
读者欣赏(2022年6期)2022-07-11
心声歌刊(2021年4期)2021-10-13
海峡姐妹(2020年12期)2021-01-18
华人时刊(2020年13期)2020-09-25
音乐世界(2020年4期)2020-09-10
金桥(2019年12期)2019-08-13
电影(2018年9期)2018-10-10
水上消防(2018年4期)2018-09-18
军营文化天地(2018年1期)2018-08-15
海峡姐妹(2018年2期)2018-04-12

- Chinese Physics B的其它文章
- A design of resonant cavity with an improved coupling-adjusting mechanism for the W-band EPR spectrometer
- Photoreflectance system based on vacuum ultraviolet laser at 177.3 nm
- Topological photonic states in gyromagnetic photonic crystals:Physics,properties,and applications
- Structure of continuous matrix product operator for transverse field Ising model: An analytic and numerical study
- Riemann–Hilbert approach and N double-pole solutions for a nonlinear Schr¨odinger-type equation
- Diffusion dynamics in branched spherical structure