
Pattern transition and regulation in a subthalamopallidal network under electromagnetic effect
2022-11-21 09:30ZiluCao曹子露LinDu都琳HonghuiZhang张红慧YuzhiZhao赵玉枝ZhuanShen申转andZichenDeng邓子辰
Chinese Physics B 2022年11期
Zilu Cao(曹子露) Lin Du(都琳) Honghui Zhang(张红慧) Yuzhi Zhao(赵玉枝)Zhuan Shen(申转) and Zichen Deng(邓子辰)
1School of Mathematics and Statistics,Northwestern Polytechnical University,Xi’an 710129,China
2School of Aeronautics,Northwestern Polytechnical University,Xi’an 710072,China
3MIIT Key Laboratory of Dynamics and Control of Complex Systems,Xi’an 710129,China
Although the significant roles of magnetic induction and electromagnetic radiation in the neural system have been widely studied, their influence on Parkinson’s disease (PD) has yet to be well explored. By virtue of the magnetic flux variable, this paper studies the transition of firing patterns induced by magnetic induction and the regulation effect of external magnetic radiation on the firing activities of the subthalamopallidal network in basal ganglia. We find: (i) The network reproduces five typical waveforms corresponding to the severity of symptoms: weak cluster,episodic,continuous cluster,episodic,and continuous wave. (ii)Magnetic induction is a double-edged sword for the treatment of PD.Although the increase of magnetic coefficient may lead the physiological firing activity to transfer to pathological firing activity,it also can regulate the pathological intensity firing activity with excessive β-band power transferring to the physiological firing pattern with weak β-band power. (iii) External magnetic radiation could inhibit continuous tremulous firing and β-band power of subthalamic nucleus(STN),which means the severity of symptoms weakened. Especially,the bi-parameter plane of the regulation region shows that a short pulse period of magnetic radiation and a medium level of pulse percentage can well regulate pathological oscillation. This work helps to understand the firing activity of the subthalamopallidal network under electromagnetic effect. It may also provide insights into the mechanisms behind the electromagnetic therapy of PD-related firing activity.
Keywords: subthalamopallidal network, magnetic induction and radiation, pattern transition, regulation of pathological oscillation
1. Introduction
Parkinson’s disease (PD) is one of the most common neurodegenerative diseases, which mainly occurs in the elder, whereas the incidence in the young has grown in recent years. The main clinical characteristics include motor symptoms (e.g., tremors and bradykinesia), behavioral symptoms(e.g.,mood and sleep disorder,anxiety,and depression),cognitive symptoms,and autonomic symptoms(e.g.,constipation and orthostatic hypotension),[1]which would worsen with the development of PD.[2]Different PD neuropathologies cause different symptoms. Specifically, the loss of dopamine neurons and their projections to the striatum are believed to produce core motor symptoms of PD and contribute to some of the cognitive and behavioral features.[1]Besides, positron emission tomography(PET)studies in PD patients also show that the loss of serotonergic and noradrenergic signaling is related to some nonmotor symptoms (e.g., depression, sleep disturbances, and cognitive deficits) in PD.[1]Additionally, neurodegeneration in limbic and neocortical areas is common in PD and correlates strongly with cognitive decline.
Although nonmotor symptoms have gained considerable relevance and interest recently, motor symptoms define the main core of PD and are essential for clinical diagnosis. The dynamic features of pathological oscillation related to the symptom severity in the basal ganglia (e.g., bursting of the individual neuron, synchronization between neurons, and excessive oscillations inβ-band(13 Hz–30 Hz)in PD)provide a physiological basis for modeling studies.[2]There are several kinds of current therapeutic methods for the relief of PD symptoms, such as medication, surgical procedures, deep brain stimulation (DBS),[3]optogenetics stimulation,[4,5]and electromagnetic stimulation. Based on the stimulation techniques,plenty of dynamic models are used to study the therapeutic effect of deep brain stimulation and optogenetics in PD-related neural circuit.[2]For example, the classical deep brain stimulation technology has been verified and optimized in the basal ganglia-thalamic(BGTH)circuit[6,7]and the cortex-thalamusbasal ganglia (CTBG) circuit[8,9]model, considering various waveforms and targets. Zhanget al.[4]found that the pathological firing patterns in a subthalamopallidal network can be destroyed and even eliminated under appropriate conditions of ultrafast optogenetic control. Whereas the underlying mechanism of noninvasive electromagnetic stimulation in the treatment of PD remains to be elucidated.
Despite the rare study of electromagnetic effect modeling in PD-related circuits, the electromagnetic effect in the neural system has been extensively studied in the past decades.Considering neuronal morphologies,Radmanet al.[10,11]modeled the electromagnetic field as an additional depolarization membrane voltage in the conductance-based neural model.Jinet al.[12]found that the transcranial magnetic stimulationinduced electric field leads to the competition between neural ion currents with different kinetic behaviors in sub-threshold potential,which induces different neural excitabilities. Based on neuronal energy theory, Liet al.[13]modeled the membrane current of neurons resulting from electromagnetic radiation and found the mode transformation induced by radiation.Funget al.[14,15]and Wilsonet al.[16,17]modeled neural plasticity with transcranial magnetic stimulation in the spatially uniform neural field model. Inspired by the memristor effect,which could transfer electromagnetic field signal into a current signal, Maet al.[18,19]suggested that magnetic flux variable and induction current can be used to describe the intrinsic effect of electromagnetic induction and radiation when ions are pumped and propagated. A series of subsequent studies have demonstrated that electromagnetic induction and radiation can adjust the synchronization[20]and induce mode transition[21]as well as nonlinear resonance[21]in the nervous system. As for the electromagnetic effect on neural disease,Zhaoet al.[22]recently found that the double-edged sword role of magnetic induction[22]which could expand and eliminate epileptiform waves in epileptic seizures.
Mainly motivated by the significant role of magnetic induction and radiation in neural system[19,20,23]and epileptic seizures,[22]the electromagnetic induction and radiation effect are introduced to a classical subthalamopallidal network[24]by the magnetic flux variable to understand electromagnetic therapy.
This paper is organized as follows: In Section 2, the improved model of the subthalamopallidal network containing electromagnetic induction and radiation effect is proposed.Section 3 investigates the firing activity and properties of the network. And then, how the magnetic coefficient influences the firing patterns of the network and how the external magnetic radiation regulates the pathological firing activities are explored. Section 4 summarizes the results and discusses the perspective of this work.
2. Model
2.1. The neuron model of STN and GPe
In the nervous system, neurons in the same population,composed of similar structures and functions, could be modeled as a similar neural model. So far, many conductancebased neural models, such as Hodgkin–Huxley model,[25]Hindmarsh–Rose model,[26]and Morris–Lecar model,[27]are employed in revealing the underlying mechanisms of brain function. In our work,we focus on the critical neural populations,i.e.,STN and GPe,in the cortico-basal ganglia-thalamus circuit, which can maintain self-sustained oscillatory activity and induce the onset of abnormal oscillation in basal ganglia(BG).[24]The membrane potential of STN and GPe neurons are modeled as the Hodgkin–Huxley model.

Table 1. Parameter’s value.[24]
The ion current of STN and GPe consist of the leak currentIL, the sodium currentINa, potassium currentIK, lowthreshold T-type calcium currentIT, high-threshold calcium currentICa, and the “afterhyperpolarizing” currentIAHP. So that the electrical activity of a single neuron in the STN–GPe circuit is modeled as

wheren,h,rare the ion variables,and[Ca]is the calcium concentration. The input from the striatum to GPe is described as a constant currentIapp. Details and parameter values of the network are consistent with Ref.[24], which are listed in Table 1.
2.2. The model of magnetic effect
Electromagnetic induction and radiation could affect the electrical activity of neurons. According to Maet al.,[18]the electromagnetic effect could cause changes in intercellular and extracellular ion concentrations and further induce the change of membrane voltage. Due to Faraday’s law,magnetic induction results in fluctuations in membrane potential. Electromagnetic induction can be introduced into the computational model to adjust the membrane potential with an additional induction currentImf. We introduce Ma’s model[18–20]to describe the influence of electromagnetic effects in this study as
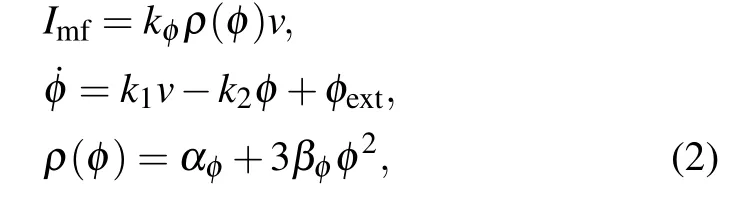
magnetic flux variableφis introduced to denote magnetic induction effects.Imfis the current induced by the magnetic induction. The magnetic coefficientkφis set to the same value for STN and GPe neurons.k1=0.0001, andk2=0.01 are the parameters that denote the feedback gain of the magnetic induction model. Functionρ(φ)represents the memory conductance value related to the magnetic flux.αφ= 0.1 andβφ=0.03 are constants in the magnetic induction model.φextis the external magnetic induction, which is composed of the magnetic induction coupling flow and the environment magnetic induction. The magnetic coupling within each nucleus is not considered here. Thus,φextonly includes the magnetic induction of the environment if it exists, which is usually regarded as 0 if there is no external electromagnetic field. Considering the response of neurons in STN and GPe under magnetic induction,the neural membrane is improved as follows:
Cm ˙v=-IL-INa-IK-IT-ICa-IAHP+Iapp-Imf.(3)
2.3. The model of subthalamopallidal network
Oscillatory neuronal activity in the basal ganglia has an essential role in the pathophysiological mechanisms underlying Parkinson’s disease.[28]The STN–GPe circuit plays an important role in basal ganglia as a potential pacemaker. It was demonstrated in a coculture model that the interaction between GPe and STN neurons produces spontaneously occurring slow synchronized oscillatory bursts of neuronal spikes. Besides,as reported in the brain slice recordings in rats and modeling studies of the STN–GPe interaction, striatal inputs could modulate the coherence within the STN–GPe network. Therefore, our work focus on this specific STN–GPe circuit of the indirect pathway within the basal ganglia area. Although the STN–GPe model is limited,it is based on the known anatomical and physiological data and incorporates rhythmicity mechanisms resulting from the recurrent excitation and inhibition in STN–GPe circuit.[4]
Computational modeling of the subthalamopallidal network[24]is adopted to study the electromagnetic effect and further investigate the mechanisms of magnetic treatment in PD. As shown in Fig. 1, the subthalamopallidal network,which has a sparse connection structure, consists of 10 STN neurons(blue circles)and 10 GPe neurons(red circles). Each STN neuron receives inhibitory Gamma-aminobutyric acid(GABA)-mediated GABAergic synaptic projections (red arrows)from two GPe neurons.Besides,there is no internal projection in STN.In contrast,each GPe neuron receives excitatoryα-amino-3-hydroxy-5-methyl-4-isoxazolepropionic acid(AMPA)-mediated glutamatergic synaptic projection(blue arrows)from one STN neuron and two inhibitory GABA synaptic projections(red arrows)from GPe.The black arrow project represents the const input currentIappfrom the striatum to GPe. Consequently, the subthalamopallidal network computational model is as follows:and the synaptic currents are as follows:
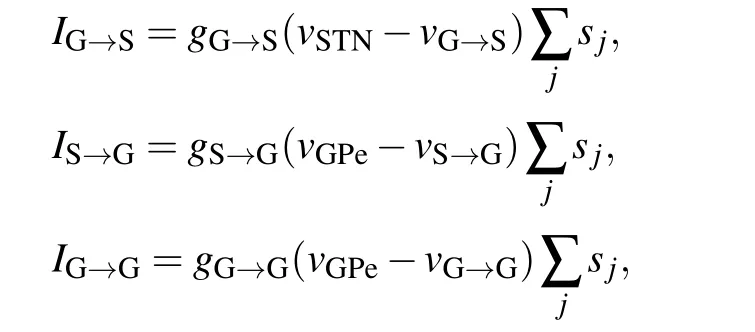


the synaptic currentsIG→S,IS→G,andIG→Gdescribe the projections from GPe to STN,STN to GPe,and GPe to GPe,respectively.sjare the synaptic variable of presynaptic neurons.

Fig.1. The sparse structure of subthalamopallidal network. Blue circles represent STN neurons, while red circles represent neurons in GPe.Red arrows represent inhibitory GABA synaptic connection from GPe,while blue arrows represent excitatory AMPA-mediated glutamatergic synaptic projection from STN. Each GPe neuron receives appendix current from the striatum. Neurons in the network are modeled as the conductance-based model.
3. Results
In this section, the system parameters are fixed as Section 2, whereas other parameters, such as synaptic conductancesgG→SandgS→G, magnetic coefficientkφ, pulse periodT, and pulse percent, are varied. As the initial state affects the dynamic properties of the network, the initial values of[Ca] are listed in Table 2. Other initial variable values are randomly chosen. Numerical simulations are implemented using the adaptive stepsize Runge–Kutta algorithm with XPPAUT software. Furthermore, the statistical results are analyzed with Matlab. In particular,the chronux analysis package(http://chronux.org/) in Matlab is used for the power spectral analysis.

Table 2. Initial value of[Ca].
3.1. The influence of the synaptic connection
After being intensely inhibited by GPe,STN neurons may produce rebound bursts during periods of firing, which is related to a characteristic motor deficit.Notably,the stronger the synaptic connection is, the more intense the rebound burst of STN exhibits, which makes the pathological oscillation more serious. Considering various synaptic connection parameters between STN and GPe in the model(Eqs.(4)and(5)),we reproduce five typical firing patterns out of synchronization in Fig. 2 as mentioned in Ref. [4]. In Fig. 2, we set the striatum input currentIapp=-1 pA/μm2for GPe, the synaptic conductancegG→S=0.06 nS/μm2, andkφ=0 to represent no electromagnetic effect. The simulation lastst=104ms with a time step of dt=0.2 ms. As shown in Fig.2(a),whengS→G=0.2 nS/μm2,gG→S=2.2 nS/μm2, STN exhibits a regular physiological sparse firing with one spike in one period with the weak synaptic connection between GPe and STN,which is defined as pattern 1: weak cluster. By tinyly increasing the synaptic projection from STN to GPe, whengS→G=0.6 nS/μm2,gG→S=2.2 nS/μm2(see Fig.2(b)),the stronger synaptic currents lead to the increasing inhibition from GPe to STN, so that slight random pathological rebound bursts appear in STN, which is defined as pattern 2: episodic cluster. By further increasinggS→G, whengS→G=0.9 nS/μm2,gG→S=2.2 nS/μm2(see Fig.2(c)),the firing pattern of STN transfers into continuous cluster, where the number of spikes in a period is mostly two or three. By gradually increasing the synaptic projection from STN to GPe, STN also exhibits more bursting within periods. In Figs. 2(c)–2(e), we fix the synaptic conductance from GPe to STNgS→G=0.9 nS/μm2.In Fig.2(d),with a largergG→S=2.8 nS/μm2,the number of spikes in a period is between four to eight within STN,which is defined as pattern 4: episodic. WithgG→S=4.0 nS/μm2,the number of spikes in a period is greater than eight with a much more extended period, which is defined as pattern 5:continuous wave. The first three firing patterns with sparse firing,i.e., the weak cluster (pattern 1), episodic cluster (pattern 2),and continuous cluster(pattern 3),represent a healthy state. In contrast, episodic (pattern 4) and continuous wave(pattern 5),which have the feature of intensive tremor-like activity,represent pathological oscillation in the PD state. In the subsequent figures, the pattern for the network is defined as the most occurred pattern among the ten STN neurons.
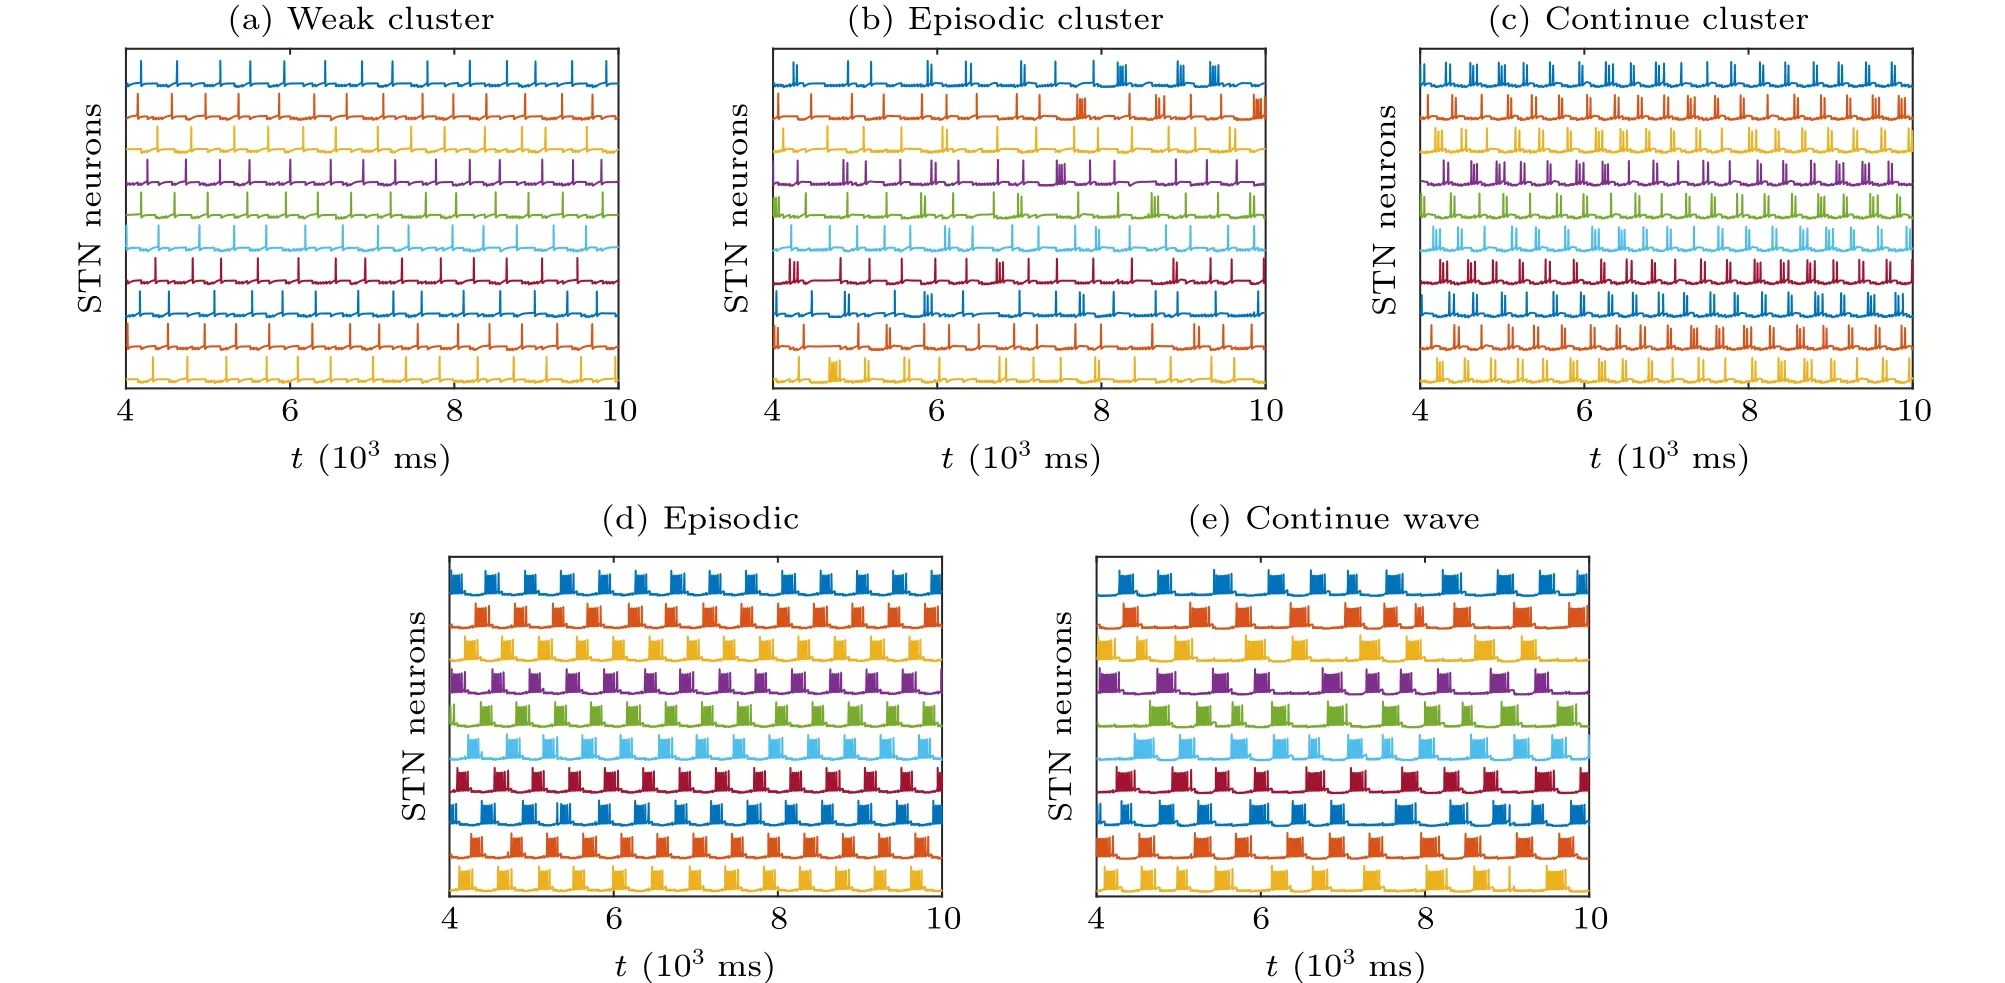
Fig.2. Five typical firing patterns with various synapse connection strengths from STN to GPe. (a)Pattern 1: weak cluster,gS→G =0.2 nS/μm2,gG→S =2.2 nS/μm2. (b) Pattern 2: episodic cluster, gS→G =0.6 nS/μm2, gG→S =2.2 nS/μm2. (c) Pattern 3: continuous cluster , gS→G =0.9 nS/μm2, gG→S =2.2 nS/μm2. (d)Pattern 4: episodic, gS→G =0.9 nS/μm2, gG→S =2.8 nS/μm2. (e)Pattern 5: continuous wave, gS→G =0.9 nS/μm2,gG→S=4.0 nS/μm2.

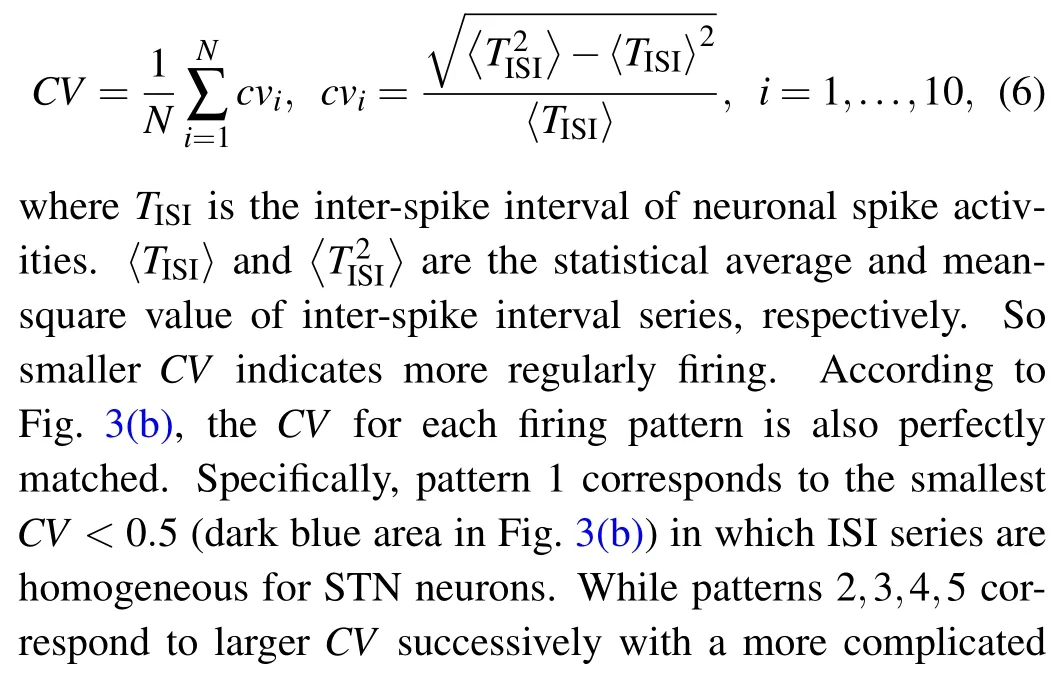
Fig. 3. The bi-parameter plane of synaptic connection parameters gS→G and gG→S. gS→G varies from 0 nS/μm2 to 2 nS/μm2 with a step of 0.04 nS/μm2 and gG→S varies from 2 nS/μm2 to 4.5 nS/μm2 with a step of 0.05 nS/μm2. (a)The firing pattern of STN.The numbers in the color bar represent five kind of firing. The colors of red,orange,yellow,blue and purple represents pattern 1(weak cluster),pattern 2(episodic cluster),pattern 3(continuous cluster),pattern 4(episodic),and pattern 5(continuous wave),respectively. (b)The CV of STN to measure the regularity of spiking. (c)The dominant frequency of STN.(d)The average frequency of STN.
For the overall firing pattern transition induced by the synaptic connection between two nuclei, we depict the firing pattern transitions(see Fig.3(a))in the bi-parameter plane in whichgS→Gvaries from 0 nS/μm2to 2 nS/μm2with a step of 0.04 nS/μm2andgG→Svaries from 2 nS/μm2to 4.5 nS/μm2with a step of 0.5 nS/μm2. Other parameters agree with Fig. 2. As expected, the transition of five typical firing patterns: pattern 1 (weak cluster), pattern 2 (episodic cluster), pattern 3 (continuous cluster), pattern 4 (episodic),pattern 5 (continuous wave) are shown in the plane. In Fig. 3(a), when 2 nS/μm2≤gG→S<2.5 nS/μm2, with the increment ofgS→G,the firing pattern transforms from physiological sparse weak cluster (red area),i.e., pattern 1, to pattern 2 in a narrow orange parameter area. And then STN represents firing pattern 3 and finally reaches the pathological pattern 4 (sky blue area) with largergS→G, which reveals that under a weaker synaptic connection from GPe to STN, the severity of pathological oscillation gradually rises accompany with stronger synaptic connection from STN to GPe. When 2.5 nS/μm2≤gG→S<3.5 nS/μm2, the firing pattern transforms from physiological pattern 1 to pathological pattern 4 directly with the growth ofgS→G. Similarly,when 3.5 nS/μm2≤gG→S≤4.5 nS/μm2, the firing pattern transforms from physiological pattern 1 to pathological pattern 5 directly. As detailed shown in the bifurcation of ISI in Fig.4(a)forgG→S=2.5 nS/μm2,all STN neurons are in the pattern 1 whengS→G<0.16 nS/μm2where the ISI around 400 ms. When 0.16 nS/μm2≤gS→G<0.68 nS/μm2, some neurons are in the pattern 4 with the appearance of smaller ISI (around 50 ms). While all STN neurons exhibit pattern 4 withgS→G≥0.68 nS/μm2,corresponding ISI has a clearer layered phenomenon.In Fig.4(b),when synaptic conductancegG→S=2.75 nS/μm2,the two bifurcation points aregS→G=0.12 nS/μm2andgS→G=0.48 nS/μm2(see the red dotted lines). With a largergG→S=3.45 nS/μm2, the bifurcation points aregS→G=0.04 nS/μm2andgS→G=0.28 nS/μm2(see the red dotted line in Fig. 4(c)), as listed in Table 3. It indicates that the bifurcation point is smaller with a larger projection from GPe to STN, and the pathological oscillation is much easier to appear.

Table 3. Bifurcation points of ISI in Fig.4.

Fig.4. The bifurcation of ISI for STN neurons. The synaptic conductance is gS→G=2.5, 2.95,3.45 nS/μm2 in panels(a)–(c). ISI in the left region of panels(a)–(c)is around 400 ms,while in the right region,the ISI shows a clear layered phenomenon. The bifurcation points(as listed in Table 3)tend to be smaller with a stronger projection from GPe to STN.
To measure the irregularly level of spiking,we adopt the coefficient of variation(CV)[29]of the inter-spike interval(ISI)series for each neural population as follows:
Figures 3(c)and 3(d)display the dominant frequency and average frequency of STN,respectively. It is evident that the dominant frequency of firing pattern 1, pattern 2 and pattern 3 is similar around 2.5 Hz–3.5 Hz except for the blue area in Fig. 3(c). Additionally, pattern 4 has an intermediate dominant frequency between 2 Hz–2.5 Hz, while pattern 5 has a lower dominant frequency close to 2 Hz, which is consistent with the more extended period observed in Fig. 2(e). As reflected in Fig.2(d),the average frequency varies following the increment ofgS→GandgG→S, which shows that the stronger connection between STN and GPe activates more neural activities.
In conclusion, STN could exhibit five typical firing patterns in which episodic(pattern 4)and continuous wave(pattern 5)are related to pathological tremulous oscillations in PD.Besides, the stronger connection between STN and GPe will lead to the firing pattern transferring from a sparse firing pattern into an intensely tremulous firing pattern, which may be related to higher severity of symptoms. Moreover,these could be captured by the bi-parameter plane ofCV.
3.2. The double-edged sword role of magnetic induction
Previous studies suggest that the magnetic coefficient could regulate the firing activities of the neural system.[18–22]For example, Luet al.[30]found that magnetic coefficient could induce the chaotic electrical mode in the improved the Hindmarsh–Rose neuron model. Subsequently, Maet al.[20]investigated the transition of synchronization in coupled neuron circuits composed of memristors. Zhan and Liu[31]also studied the transition mode induced by magnetic induction.Recently, Zhao and Wang[22]suggested that electromagnetic induction could regulate the epileptiform activities in Taylor’s model. To investigate the effect of magnetic induction, we further explore how the magnetic coefficientkφmodulates the firing activities of STN.
To explore the magnetic induction effect on the biparameter plane ofgS→GandgG→Scorresponding to Fig.3(a),the firing activities of STN under four different magnetic coefficientkφare displayed in Fig.5. Figures 5(a)–5(d) are the two parameter plane of firing pattern whenkφ=0.01,0.1,0.2,and 0.5, respectively, while figures 5(e)–5(h) are the corresponding average frequency. As shown in Figs.5(a)and 5(e),with a weakkφ=0.01,the firing activity of STN is barely affected and keeps a similar trend as that without considering magnetic induction. Whenkφincreases to 0.1(see Figs.5(b)and 5(f)),the parameter area of pathological pattern 4 and pattern 5 expands largely, and the weak cluster area (pattern 1)almost disappears. Besides, the sparse physiological firing in the red,orange and yellow area in Fig.5(a)are encroached by the blue area in Fig.5(b),which point out thatkφcould induce the transition from physiological firing activity to pathological firing activity. Figure 5(f) shows the corresponding average frequency withkφ=0.1,which verifies the aggravation of firing activity.

Fig.5. The bi-parameter plane of gS→G,gG→S under different kφ corresponding to Fig.3. Panels(a)–(d)are the firing pattern varies along with gS→G,gG→S when kφ =0.01,0.1,0.2,and 0.5,respectively.The numbers in color bar represent firing kind consist with Fig.3.Panels(e)–(h)are the corresponding average frequency to panels(a)–(d)in turn.
With the continued growth ofkφ= 0.2 as depicted in Fig.5(c),STN shows a“puzzle pattern”in which the five kinds coexist in almost every sub-regions of the parameter plane.The average frequency in Fig. 5(g) displays the high level of neural oscillation withkφ=0.2. With a largerkφ=0.5,as illustrated in Fig.5(d),in most parameter regions,STN exhibits the weak physiological cluster and episodic cluster,which indicates that a largerkφ=0.5 could well suppress the pathological firing activity. Figure 5(h)shows a low level of neural activities askφ=0.5. In conclusion,the magnetic coefficient is a double-edged sword,as reported in Ref.[3]. A weak magnetic coefficient could induce the firing activity to transform from the physiological sparse firing pattern to the pathological intensity firing pattern,while a magnetic coefficient with high intensity could suppress the pathological intensity firing activity. Besides,magnetic coefficient with moderate intensity also keeps the high-level neural activity and makes the irregular pattern transition along with synaptic connection. As excessive oscillations in theβ-band(13 Hz–30 Hz)and synchronize related to the symptom severity of PD,[2]we take two sets of[Ca]’s initial values to obtain the pathological synchronization andβ-band oscillation in STN. As shown in Fig. 6(a) whengG→S=4.5 nS/μm2,gS→G=2.0 nS/μm2, andkφ=0, we firstly capture the in-phase firing in Group1=STN1, STN2,STN4, STN5, STN8, Group2=STN3, STN6, STN7, STN9,STN10,and also the anti-phase firing between this two groups as STN exhibits pathological pattern 5. To investigate the effect of magnetic induction, the magnetic coefficientkφin the circuit is varied from 0 to 1 with a step of 0.01 at the same time. We consider the desynchronization degree adopted in Ref.[4]to quantitatively measure the synchronization,which can be expressed as follows:

wherejis the time step,andiis the neuron index.Tis the total time,andNis the number of neurons.σ(j)is the standard deviation of theNneurons.σis the time average ofσ(j). The larger value of the desynchronization degree indicates lower synchronization betweenNneurons.
As reflected in Fig.6(b),the magnetic coefficientkφcould induce the transition of the STN firing pattern. More specifically,the STN firing pattern keeps in pattern 5 whenkφ ≤0.15.When 0.15<kφ <0.4,STN mostly is in pattern 2 and under few parameters exhibits pattern 0(pattern 0 deputies that STN keeps a subthreshold firing activity), pattern 1 and pattern 3.Whenkφ >0.4,the firing activities of STN are suppressed and exhibit subthreshold oscillations, this phenomenon indicates that magnetic induction could inhibit the pathological firing pattern of STN. Correspondingβ-band power (see Fig. 6(c))shows an attenuation trend with the increment ofkφ. Whenkφ ≤0.15,though STN keeps intensity tremors pattern 5,theβ-band power decrease remarkably. When 0.15<kφ ≤0.4,β-band power decline in volatility as the various pattern transition phenomenon. Whenkφ >0.4,theβ-band power keeps a low level with the value of 0.54.As depicted in Fig.6(d),the synchronization within the group could be regulated by magnetic induction.Though the desynchronization degree changes irregularly withkφ,its peak value represents the optimalkφparameter to adjust STN to an asynchronous firing state. Above all,figure 6 shows that the pathological intensity bursting,excessiveβ-band,and synchronous oscillation in STN could be well regulated by the magnetic coefficient.

Fig.6. (a)The firing of STN neurons when gS→G=2.5 nS/μm2 and gG→S=4.5 nS/μm2. (b)The variation of firing patterns when kφ varies from 0 to 1 with a step of 0.01. (c)The β-band power of STN under various kφ. (d)The desynchronization degree of STN under various kφ.
3.3. The regulation of external magnetic radiation
External magnetic radiation could modulate the neural firing activity. For example, Lv and Ma[19]observed the emergence and transition of multiple modes induced by external radiation in the improved Hindmarsh–Rose model. Maet al.[19]also found that the external magnetic radiation could clock the target wave propagation to stand in a local area which may explain electromagnetic radiation-induced heart disease. Geet al.[32]studied the modes transition in electrical activities of Hindmarsh–Rose neural model exposed to the periodic high and low frequency electromagnetic radiation. Recently,it has been reported that electromagnetized nanoparticles could generate electromagnetic fields under ultrasound stimulation in the target neuron.[33,34]Here,the firing activity of STN,which is related to bradykinesia and rigidity in PD, is mainly considered. Appling the external magnetic stimulation directly on STN is so direct that the synaptic connections within the network are almost ineffective. The identical stimulation can also lead to STN synchronization,which is not beneficial for suppressing pathological oscillation. While applying the external magnetic stimulation on GPe can regulate the STN neurons through the interconnection within the network. To further understand the regulation of magnetic radiation to the pathological oscillation related to PD, the external magnetic flowφextwith a pulse form applies GPe neurons to obtain the regulation of external magnetic radiation to the PD-related firing activity in the network.

Fig. 7. The regulation of external magnetic radiation φext applied on GPe during 5000 ms–8000 ms when pulse amplitude A=1 under different pulse percents. The parameter is consisted with Fig.5(a)except for kφ =0.005 here. (a)Pulse percent=5%, (b)pulse percent=10%, (c)pulse percent=15%,and(d)pulse percent=90%.
Whenkφ= 0.005, the initial conditions are consistent with Fig.5(a)to let STN exhibit firing pattern 5 with in-phase and anti-phase firing. In Fig. 7, the external magnetic radiationφextis applied on GPe in 5000 ms–8000 ms,and the corresponding pulse amplitude and period are set asA=1 andT=100 ms,respectively. In Fig.7(a),the pulse width is 5%of the pulse period,i.e., 5 ms. The external magnetic radiation regulates the pathological wave firing into a more sparse firing pattern and breaks the in-phase and anti-phase firing of the STN. With a tiny increase in pulse percent into 10% (see Fig. 7(b)), the corresponding firing transforms into a sparse pattern. After that,when pulse percent is 15%(see Fig.7(c)),the firing of STN is suppressed and exhibits subthreshold oscillation.As displayed in Fig.7(d)),with a larger pulse percent which equals 90%,STN neurons are activated again and show a sparse firing pattern. Figure 7 demonstrates that the external magnetic radiation applied on GPe can regulate the pathological firing pattern of STN.
Figure 8 demonstrates the influence of pulse width ofφext. As the external magnetic flowφextapplied on GPe during 5000 ms–8000 ms,figures 8(a)–8(d)depict the firing pattern,average frequency,β-band power, and desynchronization degree during 5000 ms–8000 ms, respectively. In Fig. 8, blue color represents pulse period =100 ms, while red represents pulse period=500 ms,pulse percent varies from 0%to 100%with a step of 1%. As demonstrated in Fig.8(a), with the increase of pulse percent, the pathological firing pattern 5 can be weakened to pattern 1 and even suppressed via the transition state of pattern 4,pattern 3,pattern 2,and then reactivated under certain pulse percent. As pulse period =100 ms (blue dots), the firing activities are almost entirely suppressed by the external magnetic radiation when the pulse percent is between 12%and 88%,and the physiological oscillation appears when the pulse is between 5% and 96%. In contrast, when pulse period=500 ms(red dots),the physiological oscillation has a narrower pulse percent range between 42% and 56%.The average frequency(see Fig.8(b))andβ-band power(see Fig.8(c))along with the pulse width also show a similar trend that declines in volatility and then rises,which verifies the inhibition of the external magnetic radiation to the firing activity of STN neurons and the excessiveβ-band oscillation with a certain median level of the pulse width. However,as the identical pulse applies GPe neurons, under most parameters, the desynchronization degree is lower than that withoutφext(pulse percent = 0%) in Fig. 8(d), which means that the identicalφextmakes the firing of STN neurons more synchronous. Only when pulse width =500 ms (red curve in Fig. 8(d)) and the pulse percent within 0%–4%and 96%–100%,can the externalφextregulate the firing activity more out of synchronizing. To sum up, a smaller pulse period is much easier to regulate the pathological firing pattern and the excessiveβ-band oscillation under a medium level of pulse percent. Meanwhile,when the stimulation target is on GPe, the interconnection within the network allows the synchronization of STN neurons to be broken under certain conditions.
(a) STN (b) STN

Fig.8. The statistical results regulation of external magnetic radiation φext applied on GPe during 5000 ms–8000 ms when pulse percent varies from 0%to 100%with a step of 1%. Blue dots and curves represent that the pulse period is=100 ms,while red dots and curves represent that the pulse period is=500 ms. (a)Firing pattern of STN.(b)The average frequency of STN.(c)The β-band power of STN.(d)The desynchronization degree of STN.
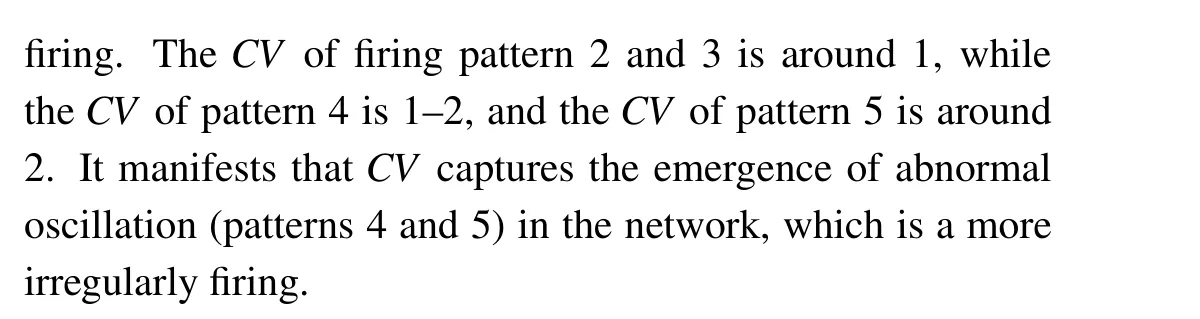
To obtain the regulation region of pulse parameters related to the external magnetic radiation, we calculate theβband power and the desynchronization degree of STN with the pulse period and pulse percent variation. The pulse period changes from 0 ms to 500 ms with a step of 20 ms,while the pulse percent changes from 0%to 100%with a step of 1%. As excepted, the pathological firing pattern is well inhibited by magnetic radiation in most parameter regions(as shown in the dark red, red, orange, and blue regions in Fig.9(a)). The average firing frequency (see Fig. 9(b)) andβ-band power (see Fig. 9(c)) show a nearly symmetrical structure to the line of pulse percent =50%, which indicates STN neurons are suppressed firstly and then reactivated.Figure 9 confirms the conclusion in Fig.8 again: when the pulse period is smaller,there is a more extensive pulse percent range in the medium level for a smaller pulse period to regulate the abnormal firing pattern and excessiveβ-band power.As for the regulation of synchronization shown in Fig. 9(d), with a fixed pulse period, there is a specific pulse width in which the desynchronization degree(red points)is larger than without external magnetic radiation(orange points when pulse period=0 ms or pulse percent=0%).Unfortunately,the pulse parameter point that regulates the firing into an out-of-synchrony state could not always modulate the firing pattern andβ-band oscillation well. In conclusion,external magnetic radiation could effectively regulate the pathological firing pattern and the excessiveβ-band oscillation with the apposite pulse parameter region,which may offer verification for the regulation effect of magnetic radiation on PD-related firing activity.
Fig. 9. The bi-parameter plane of φext pulse parameters, i.e., pulse period and pulse percent. Pulse period varies from 0 ms to 500 ms with a step of 20 ms, while pulse percent changes from 0% to 100% with a step of 1%. All statistical results are obtained from the regulation duration that external magnetic radiation φext during 5000 ms–8000 ms. (a)The firing pattern of STN.The colors of dark red,red,orange,yellow,blue,and purple represent subthreshold oscillation,pattern 1(weak cluster),pattern 2(episodic cluster),pattern 3(continuous cluster),pattern 4(episodic),and pattern 5(continuous wave),respectively. (b)The average frequency of STN.(c)The β-band power of STN.(d)The desynchronization degree of STN.
4. Discussion and conclusion
In this paper, we proposed an improved subthalamopallidal network model to explore the influence of electromagnetic induction and understand the regulation of external magnetic radiation in PD-related pathological oscillation. Results demonstrate that: (i) The increment of synaptic conductancegS→GandgG→Sinduces the transition among five typical firing pattern, which are weak cluster, episodic cluster, continuous cluster,episodic,and continuous wave corresponding to the severity of symptoms. (ii) The double-edged sword role of the magnetic induction. Under certain magnetic coefficient values,the firing activity transform could from the pathological intensity firing with excessiveβ-band power to the physiological firing pattern with weakβ-band power, while the physiological firing activity can also transfer to pathological firing activity. (ii) With the regulation of external magnetic radiation, the continuous wave can be regulated to episodic cluster,weak cluster,and subthreshold oscillation in turn,and then reactivated under a larger pulse percent.The bi-parameter plane manifests that a shorter magnetic induction pulse period and a medium level of pulse percent can effectively inhibit the pathological firing pattern and excessiveβ-band oscillation.
Our preliminary study makes an effort to explore the electromagnetic induction and radiation effect in a subthalamopallidal network. However, the simplified model can not show more complicated therapeutic mechanisms of magnetic stimulation(such as the change of dopamine level and synaptic plasticity) in PD, which should be further studied. Nevertheless,the results figure out the positive effect of external magnetic radiation, which could help weaken the severity of pathological firing activity in PD. This work can offer a reference for the effect of magnetic induction in PD, expand the application area of the electromagnetic induction modeling method,and helps consider the regulation of magnetic induction and external magnetic radiation. From the dynamic perspective,the occurrence of pathological state and electromagnetic therapy mechanisms in PD contain more complicated circuits and mechanisms beyond the factors we considered. This work is not committed to exploring all causes, but rather illustrating how electromagnetic induction may result in opposite effects under different conditions and the regulatory role of magnetic radiation.
Acknowledgments
Project supported by the National Natural Science Foundation of China (Grant Nos. 11972292, 12172291, and 12072265)and the 111 Project(Grant No.BP0719007). The authors wish to acknowledge Ms. Luyao Yan, Mr. Lianghui Qu, and Mr. Haiwei Hu for their help in interpreting the significance of the results of this study.
- Chinese Physics B的其它文章
- A design of resonant cavity with an improved coupling-adjusting mechanism for the W-band EPR spectrometer
- Photoreflectance system based on vacuum ultraviolet laser at 177.3 nm
- Topological photonic states in gyromagnetic photonic crystals:Physics,properties,and applications
- Structure of continuous matrix product operator for transverse field Ising model: An analytic and numerical study
- Riemann–Hilbert approach and N double-pole solutions for a nonlinear Schr¨odinger-type equation
- Diffusion dynamics in branched spherical structure