
Rapid screening of 420 pesticide residues in fruits and vegetables using ultra high performance liquid chromatography combined with quadrupole-time of f light mass spectrometry
2023-01-03 11:30JunmeiSufngFnLiqiongYngLingnHeHongwenZhiXioweiRenQingLiYnZhng
食品科学与人类健康(英文) 2023年4期
Junmei M, Sufng Fn, Liqiong Yng, Lingn He, Hongwen Zhi,Xiowei Ren, Qing Li,*, Yn Zhng,b,*
a Hebei Food Inspection and Research Institute, Hebei Engineering Research Center for Special Food Safety and Health, Key Laboratory of Special Food Supervision Technology for State Market Regulation, Hebei Food Safety Key Laboratory, Shijiazhuang 050200, China
b Hebei Key Laboratory of Forensic Medicine, College of Forensic Medicine, Hebei Medical University, Shijiazhuang 050017, China
Keywords:UPLC-Q-TOF/MS SinChERS-Nano column Pesticide residues Fruits and vegetables
A B S T R A C T A new method for screening and identif ication 420 pesticide residues in fruits and vegetables by ultra-performance liquid chromatography coupled with quadrupole-time of flight mass spectrometry (UPLC-Q-TOF/MS)were developed. The samples were extracted with acetonitrile/acetic acid (99:1, V/V), and clean-up by SinChERS-Nano (single-step, cheap, effective, rugged, safe, nano) column, determined by UPLC-Q-TOF/MS.The accurate mass database and MS/MS database which contains 420 pesticides were established, the automatic retrieval of detection results was carried on according to the accurate mass, retention time, isotope ratio, ion fragment information, and so on. Method verif ication was performed on leeks samples. The results showed that 420 pesticides had good linearity in the range of 0.1-100 µg/L, and the correlation coeff if icients(R2) was greater than 0.990. The limits of detections (LODs) and limits of quantifications (LOQs) of 420 pesticides were in range of 0.05-2.0 and 0.1-5.0 µg/L, respectively. The average spike recoveries at 3 levels were 70.1% to 119.7%, and the relative standard deviations (RSD) were lower than 20% (n = 6). With this method, a survey of pesticide residues was conducted for 110 samples of 10 different fruits and vegetables,which provided scientif ic data for ensuring pesticide residue safety of the fruits and vegetables consumed daily by the public. This method was simple, sensitive and accurate, and could be used for rapid screening of 420 pesticide residues in fruits and vegetables.
1. Introduction
With the development of modern agriculture, the scale of pesticide has been increasingly used. However, instances of their overuse, abuse, misuse, etc. also occur, which can cause pesticides to reside in fruits and vegetables, thus constituting a potential threat to human health and adversely affecting international trade [1,2].Because of the potential of pesticide contamination in current fruits and vegetables, maximum residue limits (MRLs) for pesticide have been established in many countries and world organizations. For instance, there are 4140 MRL items that cover 433 pesticides in the China’s national food safety standard GB 2763-2016. And, at least thousands of pesticides were used in China’s agricultural production.Thus, the inspection and supervision of the species and content of pesticide residues in fruits and vegetables become imperative and crucial [3].
At present, the methods used for screening multi-component pesticide residues in food mainly include gas chromatography [4], liquid chromatography [5], gas chromatography-mass spectrometry [6-11]and liquid chromatography-tandem mass spectrometry [12-17].Among them, liquid chromatography and gas chromatography have low sensitivity, poor selectivity and specificity, which limits the ability to screen multi-component pesticide residues [18]. Gas chromatography-mass spectrometry is not suitable for the detection of difficult-to-volatile and strongly polar compounds, and the detection limit is relatively high [19]. Liquid chromatographytandem mass spectrometry has a limited ability to identify isomers,and the ion dwell time is limited due to the scan rate, which limits the number of compounds that can be scanned at a time. For the multiresidue detection of hundreds of pesticides, it is often necessary to establish multiple methods for repeated determination, which is time-consuming and labor-intensive, and cannot truly achieve highthroughput screening. UPLC-Q-TOF/MS has the characteristics of high resolution, high sensitivity, high accuracy and wide scanning range. It can identify isomers and avoid false positives through the accurate mass, isotope distribution and characteristic mass spectrum of MS/MS [20-22]. It has become the development direction of future pesticide residue analysis standards, and it has been widely used in quantitative analysis of pesticide residues, veterinary drug residues and other research fields [23-27]. Fruits and vegetables contain pigments, organic acids, sugars, vitamins and other substances.These substances will be extracted together with the target pesticides during the extraction process, which can easily cause interference to the target analytes and cause pollution to the instrument without purification steps or poor purification methods. Some analytical methods have been developed to determine pesticide residues in fruits and vegetables, however, most of the reported pre-treatment methods use solid phase extraction (SPE) and QuEChERS (quick,easy, cheap, effective, rugged, safe). SPE method is complicated to operate, and purification steps are time-consuming and cost-intensive.The purification effect of the QuEChERS method is poor, and the application of graphitized carbon black (GCB) to adsorb pigments will reduce the recovery rate of planar structure pesticides.
SinChERS-Nano column is a new type of purification column developed based on the QuEChERS method. The column is filled with purification materials such as primary secondary amines(PSA) and multi-walled carbon nanotubes (MWCNTs). During the working process, the SinChERS-Nano column utilizes the reverse guiding effect to separate the organic extract from the aqueous solution to achieve sample purification. The SinChERS-Nano column combines the optimized column structure with MWCNTs,and combines the extraction and purification steps of the original QuEChERS method into one, which can simplify the pretreatment procedure and improve the work efficiency. The purpose of this research is to develop and validate a new method that meets the requirements of real-time, fast and accurate for pesticide residue detection. According to the characteristic of the target compound,this experiment combined SinChERS-Nano purification column and UPLC-Q-TOF/MS to establish a method for the analysis of pesticide residues of 420 pesticides in fruits and vegetables. It can obtain accurate and stable test results and provide reliable technical support for and regulatory authorities.
2. Materials and methods
2.1 Materials and reagents
Methanol, acetonitrile were HPLC grade and purchased from Merck (Darmstadt, Germany). Water was purified using a Milli-QSystem (Millipore, Guyancourt, France). Formic acid was supplied by Fisher Scientific (Loughborough, UK). Ammonium formate was HPLC-grade and purchased from Sigma (California, America).Sodium chloride (NaCl) and anhydrous magnesium sulphate (MgSO4)were purchased from Kemiou Chemical Reagent Co., Ltd. (Tianjin,China). SinChERS-Nano column, including 2 g sodium sulfate,0.6 g MgSO4, 90 mg PSA and 15 mg MWCNTs was purchased from Lvmian Technology (Beijing, China). 420 pesticide standards (10 µg/mL)were purchased from Alta Technology (Tianjin, China). The fresh fruit and vegetable samples used for method development and verification were purchased from a local market in Shijiazhuang,China. All the samples were crushed using a beater and stored in plastic bottles at 4 °C in a freezer.
2.2 Instruments and equipment
The high-speed refrigerated centrifuge (CR22N, HITACHI,Germany), the vortex mixer (Vortex Genius 3, IKA, Germany), and the ultrasonic cleaner (Elmasonic P300H, Elma, Germany) were used in the procedure of extraction. The separation of compounds was carried out on a LC-30AD UPLC system equipped with binary solvent manager, sample manager, and column manager (Shimadzu, Japan).Analysis of target compounds was conducted on a TripleTOFTM5600+quadrupole/time of flight mass spectrometry (AB Sciex, USA).
2.3 Methods
2.3.1 Sample preparation
Fifteen grams chopped sample (accurate to 0.01 g) was introduced into a 50 mL centrifuge tube, 15 mL 1% acetic acid in acetonitrile (V/V)was added. The mixture was vortexed for 1 min, and sonicated for 20 min. Then, 1.5 g NaCl and 4 g MgSO4were added and oscillated for 10 min. The sample homogeneity was centrifuged 3 min at 9 000 r/min. After that, the supernatant was transferred to a 50 mL centrifuge tube, and the SinChERS-Nano purification tube was inserted into the centrifuge tube, and then slowly pressed down.Approximately 4 mL of the supernatant was put into the reservoir of the purification tube, the supernatant was filtered through a 0.22 µm nylon membrane before UPLC-Q-TOF/MS detection.
2.3.2 Chromatographic conditions
The chromatographic separation was performed on a HSS T3 column (100 mm × 2.1 mm, 1.8 µm; Waters, USA) with a flow rate of 0.3 mL/min. The mobile phase consisted of solvent A (ultrapure water with 2 mmol/L ammonium formate 0.01% formic acid solution) and solvent B (methanol with 2 mmol/L ammonium formate 0.01% formic acid solution). The elution gradient was carried out for 20 min as follows: 0-1.00 min, 5% B; 1.0-1.6 min, 5% to 20% B; 2.5-10.0 min,50% to 95% B; 10.0-15.0 min, 95% B; 15.0-15.1 min, 95% to 5% B;15.1-20.0 min, 5% B. The injection volume was 5.0 µL.
2.3.3 Mass spectrometry conditions
After chromatographic separation, target analytes were carried out on the Triple TOFTM5600+. The MS analysis was performed using an electrospray ion source (ESI) source in positive and negative ionization mode. The optimized conditions of MS conditions were as follows: the ionization voltage was 5.5 kV/-4.5 kV; turbo spray temperature was 550 °C; pressure of curtain gas was 30 psi, pressure of nebulizer gas (Gas 1) was 50 psi, pressure of auxiliary gas (Gas 2)was 55 psi; Nitrogen was used as the nebulizer and auxiliary gas,declustering potential (DP) was 100 V; collision energy (CE) was 35 eV/-15 eV; collision energy spread (CES) was 15 eV/-15 eV. The TOF MS scan was operated with the mass range ofm/z50-1 000 Da.For the IDA criteria, 8 most intense fragment ions of each analyte that exceeded 100 cps counts were selected to do a production scan withm/z50-1 000 Da. During the experiment, every three samples were run, the mass accuracy calibration was automatically performed.
2.3.4 Creation of the of mass spectrum database
Under the instrument conditions given in sections 2.3.2 and 2.3.3, analyze the single-pesticide standard solution through the TOF MS-IDA MS/MS mode (Fig. 1). After the TOF MS scan, IDA Criteria was performed, and only the ions with “chromatographic peaks” will get the secondary mass spectrum. When using the IDA method, up to 50 trigger scans can be used, which makes the target compound’s MS/MS information not “missed” even if the target compound is covered by strong background noise ions in a complex matrix sample.In the TOF MS mode, information such as molecular formula,ionized forms of precursor ion, retention time, accurate molecular weight and isotope distribution of the compound can be obtained.This information was entered into the template of Excel and saved as an accurate mass database for use in screening software analysis.In the IDA MS/MS mode, the secondary characteristic spectra of the compound were acquired under different collision energies, and 3 special spectra were selected from the recorded spectra. These spectra were subsequently imported into the Sciex OS 1.5.0 (AB Sciex, USA) software to form an MS/MS database, and associated with the corresponding pesticide information, i.e., retention time and molecular formula, etc. Finally, the MS/MS database was used for the final confirmation of the initial screening results of the accurate mass database.

Fig. 1 Flow chart of TOF MS-IDA MS/MS.
2.4 Data analysis
Raw data of Triple TOFTM5600+was analyzed using the Sciex OS 1.5.0 software with the following settings: RT half window,90sec; peak selection by largest; precurrsor mass tolerance, ± 0.4 Da;collision energy, ± 5 eV; Intensity threshold, 0.05; The target compounds was used to match with mass spectrum database using“Targeted Peak Finding” function, according to the following principles: mass error < 5 ppm and weight = 30%; isotope ratio difference < 10% and weight = 20%; library hit score > 70% and weight = 30%; retention time error < 5 ppm and weight = 20%.
3.1 Results and discussion
3.1 Optimization of extraction solvents
Acetonitrile is the most commonly used extraction solvent for pesticide residue detection due to its high polarity and strong penetrating ability. However, this study found that some pesticides are sensitive to pH, the recovery rate was less than 60% when acetonitrile was used as the extraction solvent. After acetonitrile is properly acidified, it can promote the dissolution of the target compound from the tissue and improve the extraction efficiency. This study investigated the extraction efficiency of acetonitrile and 1%acetic acid acetonitrile for 420 pesticides. The results showed that after adding acetic acid, the recovery rate of pyraclostrobin increased from 71% to 83%. The recovery rate of carbendazim increased from 70% to 89%. The recovery rate of imazapyr increased from 45% to 82%. The recovery rate of phoxim was increased from 68% to 91%.The recovery rate of dimethoate was increased from 72% to 85%. The recovery rate of edifenphos increased from 67% to 82%. The recovery rate of ethoprophos was increased from 59% to 78%. In addition, the color of the solution extracted with 1% acetic acid acetonitrile was lighter, indicating that there were fewer co-extracted pigments, so 1%acetic acid acetonitrile was selected as the extraction solvent in this experiment.
3.2 Optimization of purification conditions
The SPE and QuEChERs methods are widely used in the purification steps for the analysis of pesticide residues. The SPE method has a good purification effect, but the operation is complicated, and it is probable to introduce artificial error. It is not suitable for the pesticide residue detection of batch samples.The traditional QuEChERs method generally uses adsorbents such as PSA, octadecyl (C18) and GCB for purification. GCB can remove steroids, chlorophyll, etc., but has strong adsorption to planar structure pesticides (such as thiabendazole, carbendazim,cyprodinil, etc.), resulting in low recovery rates of such pesticides.C18is suitable for removing fatty compounds. Compared with other plant-derived food samples, fruits and vegetables do not have too many complex fatty compounds. PSA has a double NH2structure,which can effectively remove polar pigments, organic acids, fatty acids and other components that are easy to form hydrogen bonds in the sample, but its adsorption capacity is weak. In addition to PSA,the SinChERS-Nano column used in this study also added a certain amount of MWCNTs. MWCNTs are nano-scale hollow tubes with high mechanical strength and strong acid and alkali resistance, which makes their purification ability strong [28-31]. The combined use of PSA and MWCNTs can effectively remove impurities in the sample,reduce the interference to the target compound, and protect the chromatographic column and instrument from pollution and damage.Therefore, the SinChERS-Nano column was selected for purification in this experiment.
3.3 Optimization of mass spectrometry conditions
3.3.1 Mass accuracy
The TripleTOFTM5600+has a CDS automatic correction infusion system. Using the reference spray of the DuoSprayTMion source to input the calibration solution, the system can be automatically calibrated. DuoSprayTMion source has 2 types: ESI and atmospheric pressure chemical ionization (APCI) source. In this experiment, the ESI was selected as the detection ion source, and the APCI source was used as the calibration ion source. The automatic batch calibration was carried out through the automatic calibration system to ensure that the accurate mass of the system is stable for a long time.
3.3.2 Optimization of mass spectrometry parameters
For optimization of mass spectrometric parameters, syringe injection were used to inject pesticide substances directly into the mass spectrometer in the positive and negative ionization mode. The mass spectrometry parameters (DP, CE, CES, Gas 1, Gas 2, etc.) were optimized to achieve good response for all the chemical components.CE, CES and DP are important parameters in the mass spectrometry analysis, which can improve the sensitivity and reduce the omission of fragment information. Studies have shown that when CE was 35 eV/-35 eV, and CES was 15 eV/-15 eV, a large amount of product ions can be generated before detection on the Triple TOFTM5600+system. The experiment studied the response of the target compound under different declustering potentials (50-300 V), and found that the compound had a higher response at a fragmentation voltage of 100 V. Relatively low fragmentor voltage was unfavorable for ion transmission, and overly high fragmentor voltage would cause the compound to fragment within the source. Therefore, DP was 100 V in this study. CE was 35 eV/-35 eV, and CES was 15 eV/-15 eV in this study, which enabling us to obtain EPI scan spectrums when CE was 20 eV/-20 eV, 35 eV/-35 eV, and 50 eV/-50 eV, respectively.The total ion chromatogram of the 420 pesticides standard(100 ng/mL) solutions in leeks matrix were shown in Fig. 2. The extracted ion chromatograms of the 420 pesticides standard solutions in leeks matrix were shown in Fig. 3. It can be seen from Fig. 3 that the peak shape of the target compound is good. Taking carbofuran as an example, Fig. 4 showed the total ion chromatogram, TOF-MS and TOF-MS/MS spectra of carbofuran.
3.3.3 Database search
Matrix standard solution was used to verify the accurate mass database and MS/MS database established in this experiment. The results (Supplemental Table 1) showed that the accurate mass and retention time deviation of all compounds were less than 5 ppm, and the isotope abundance ratio deviation was less than 10 ppm. The proportion of pesticides with a MS/MS database matching score more than 70 was 98.6%. It showed that the accuracy of the database was good. During the experiment, the false negative results were mainly as follows: the accurate mass and retention time deviation of all compounds were less than 5 ppm, and the isotope abundance ratio deviation was less than 10 ppm, but the matching score of MS/MS database was less than 70 points. This was due to the low response of mass spectrum and matrix interference. In this case, dynamic background subtraction was required in the data processing process,which improves the matching degree of fragment ions and increases the score. After the dynamic background subtraction, the MS/MS database matching scores of all compounds were higher than 70 points,and the matching can still be intact at low concentrations. Fig. 5 showed the Sciex OS screening interface of pyraclostrobin at 1 µg/L.

Fig. 2 The total ion chromatogram of the 420 pesticides standard (100 ng/mL) solutions in leeks matrix. The extracted ion chromatograms of pesticides standard solutions in (a) positive mode and (b) negative mode.

Fig. 3 The extracted ion chromatograms of the 420 pesticides standard (100 ng/mL) solutions in leeks matrix. The extracted ion chromatograms of pesticides standard solutions in (a) positive mode and (b) negative mode.

Fig. 4 (a) Total ion chromatogram, (b) TOF-MS spectra and (c) TOF-MS/MS spectra of carbofuran.

Fig. 5 Sciex OS screening interface of pyraclostrobin (1 µg/L).
In this study, database search parameters including accurate mass deviation and retention time window were optimized to avoid false positive results. The preliminary identification of the target analyte could be achieved by the accurate mass of the compound. However,when hundreds of target compounds in complex matrices were to be detected and identified, there might have been a plurality of peaks in the same mass window, which would have increased the possibility of the occurrence of false positive results. Setting an appropriate retention time window can effectively solve this problem. In this experiment, it is found that the chromatographic peak width of the chromatographic peaks for 420 pesticides ranged from 0.16 min to 0.83 min, considering that the retention time window should be greater than the maximum half peak width of chromatographic peaks,the identification window of retention time was set at ± 0.45 min.
3.4 Optimization of mass spectrometry conditions
3.4.1 Linearity and sensitivity
The linearity of the method was evaluated by constructing matrix matched calibration curves with different concentrations of 420 pesticides. The LODs and LOQs of the 420 pesticides in leeks samples were calculated by signal-to-noise ratio of 3 and 10 (the ratio between intensity of signal of each compound obtained under TOF MS conditions and intensity of noise in a spiked sample).Linear range,R2, LODs and LOQs for the methods for determination of pesticides in the leeks were presented in Supplemental Table 2.The linear range was studied by preparing a calibration curve with a concentration range of 0.2-100 µg/L for each compound, and a good linear relationship withR2higher than 0.990 was achieved for 420 pesticides in their respective linear range. The LODs of 420 pesticides were in the range of 0.05-2.0 µg/L. The LOQs of 420 pesticides were in the range of 0.1-5.0 µg/L. If the target pesticide was detected at more than MRL, according to the result of the target pesticides, new similar concentration pesticides standard in matrix solution will be remade for target re-quantitation, and the national standard method was used for verification.
3.4.2 Recovery and precision
The accuracy and precision were tested via the recovery and reproducibility experiments respectively, which were carried out on blank leeks samples with three spiked levels at 5, 20, 100 µg/kg.The precision of the method was expressed by RSD. The results(see Supplemental Table 2) showed that the recoveries of pesticides were in the range of 70.1%-119.7% with RSDs ≤ 19.12% and could meet the requirement of SANTE/11813/2017 guideline, in which the acceptable mean recoveries were those within the range 70%-120%,with an associated repeatability RSDs ≤ 20%, indicating that this method may meet the daily monitoring requirements.
3.5 Application to actual samples
In order to verify the performance of this method and its applicability in routine detection, this method was applied to thepesticide residue screening analysis of commercial fruit and vegetable samples. The samples analyzed were randomly collected from domestic supermarkets and farmers’ markets. The sample types include 3 kinds of fruits: orange, kiwi and banana, and 7 kinds of vegetables: garlic, cowpea, bean sprouts, sweet pepper, celery, leeks and lettuce. 11 samples were selected for each type, for a total of 110 samples. The results (Fig. 6) showed that under the premise of the monitoring sample range and the existing screening capacity, 87.27%of the samples were detected with pesticide residues of different varieties and frequencies. Among them, the detection rate of positive samples in fruits was 96.97%, and the detection rate of positive samples in vegetables was 83.12%. Among all the samples with pesticide residues, the samples with 1 pesticide residues accounted for 16.36%, the samples with 2-5 pesticide residues accounted for 30.00%, the samples with 6-10 pesticide residues accounted for 28.18%, and the samples with 11-20 pesticide residues accounted for 12.73%. A total of 568 positive results including 96 “sample-pesticide”pairs were detected, involving 73 pesticides, among which the top 10 pesticides with the highest detection frequency were pyraclostrobin (38),imidacloprid (22), imazalil (22), dimethomorph (22), acetamiprid (21),thiamethoxam (18), prochloraz (17), thiophanate-methyl (17),difenoconazole (16), etoxazole (16), respectively. Determination results of real samples were shown in Table 1.

Fig. 6 The number of detectable pesticide residues in fruits and vegetables.
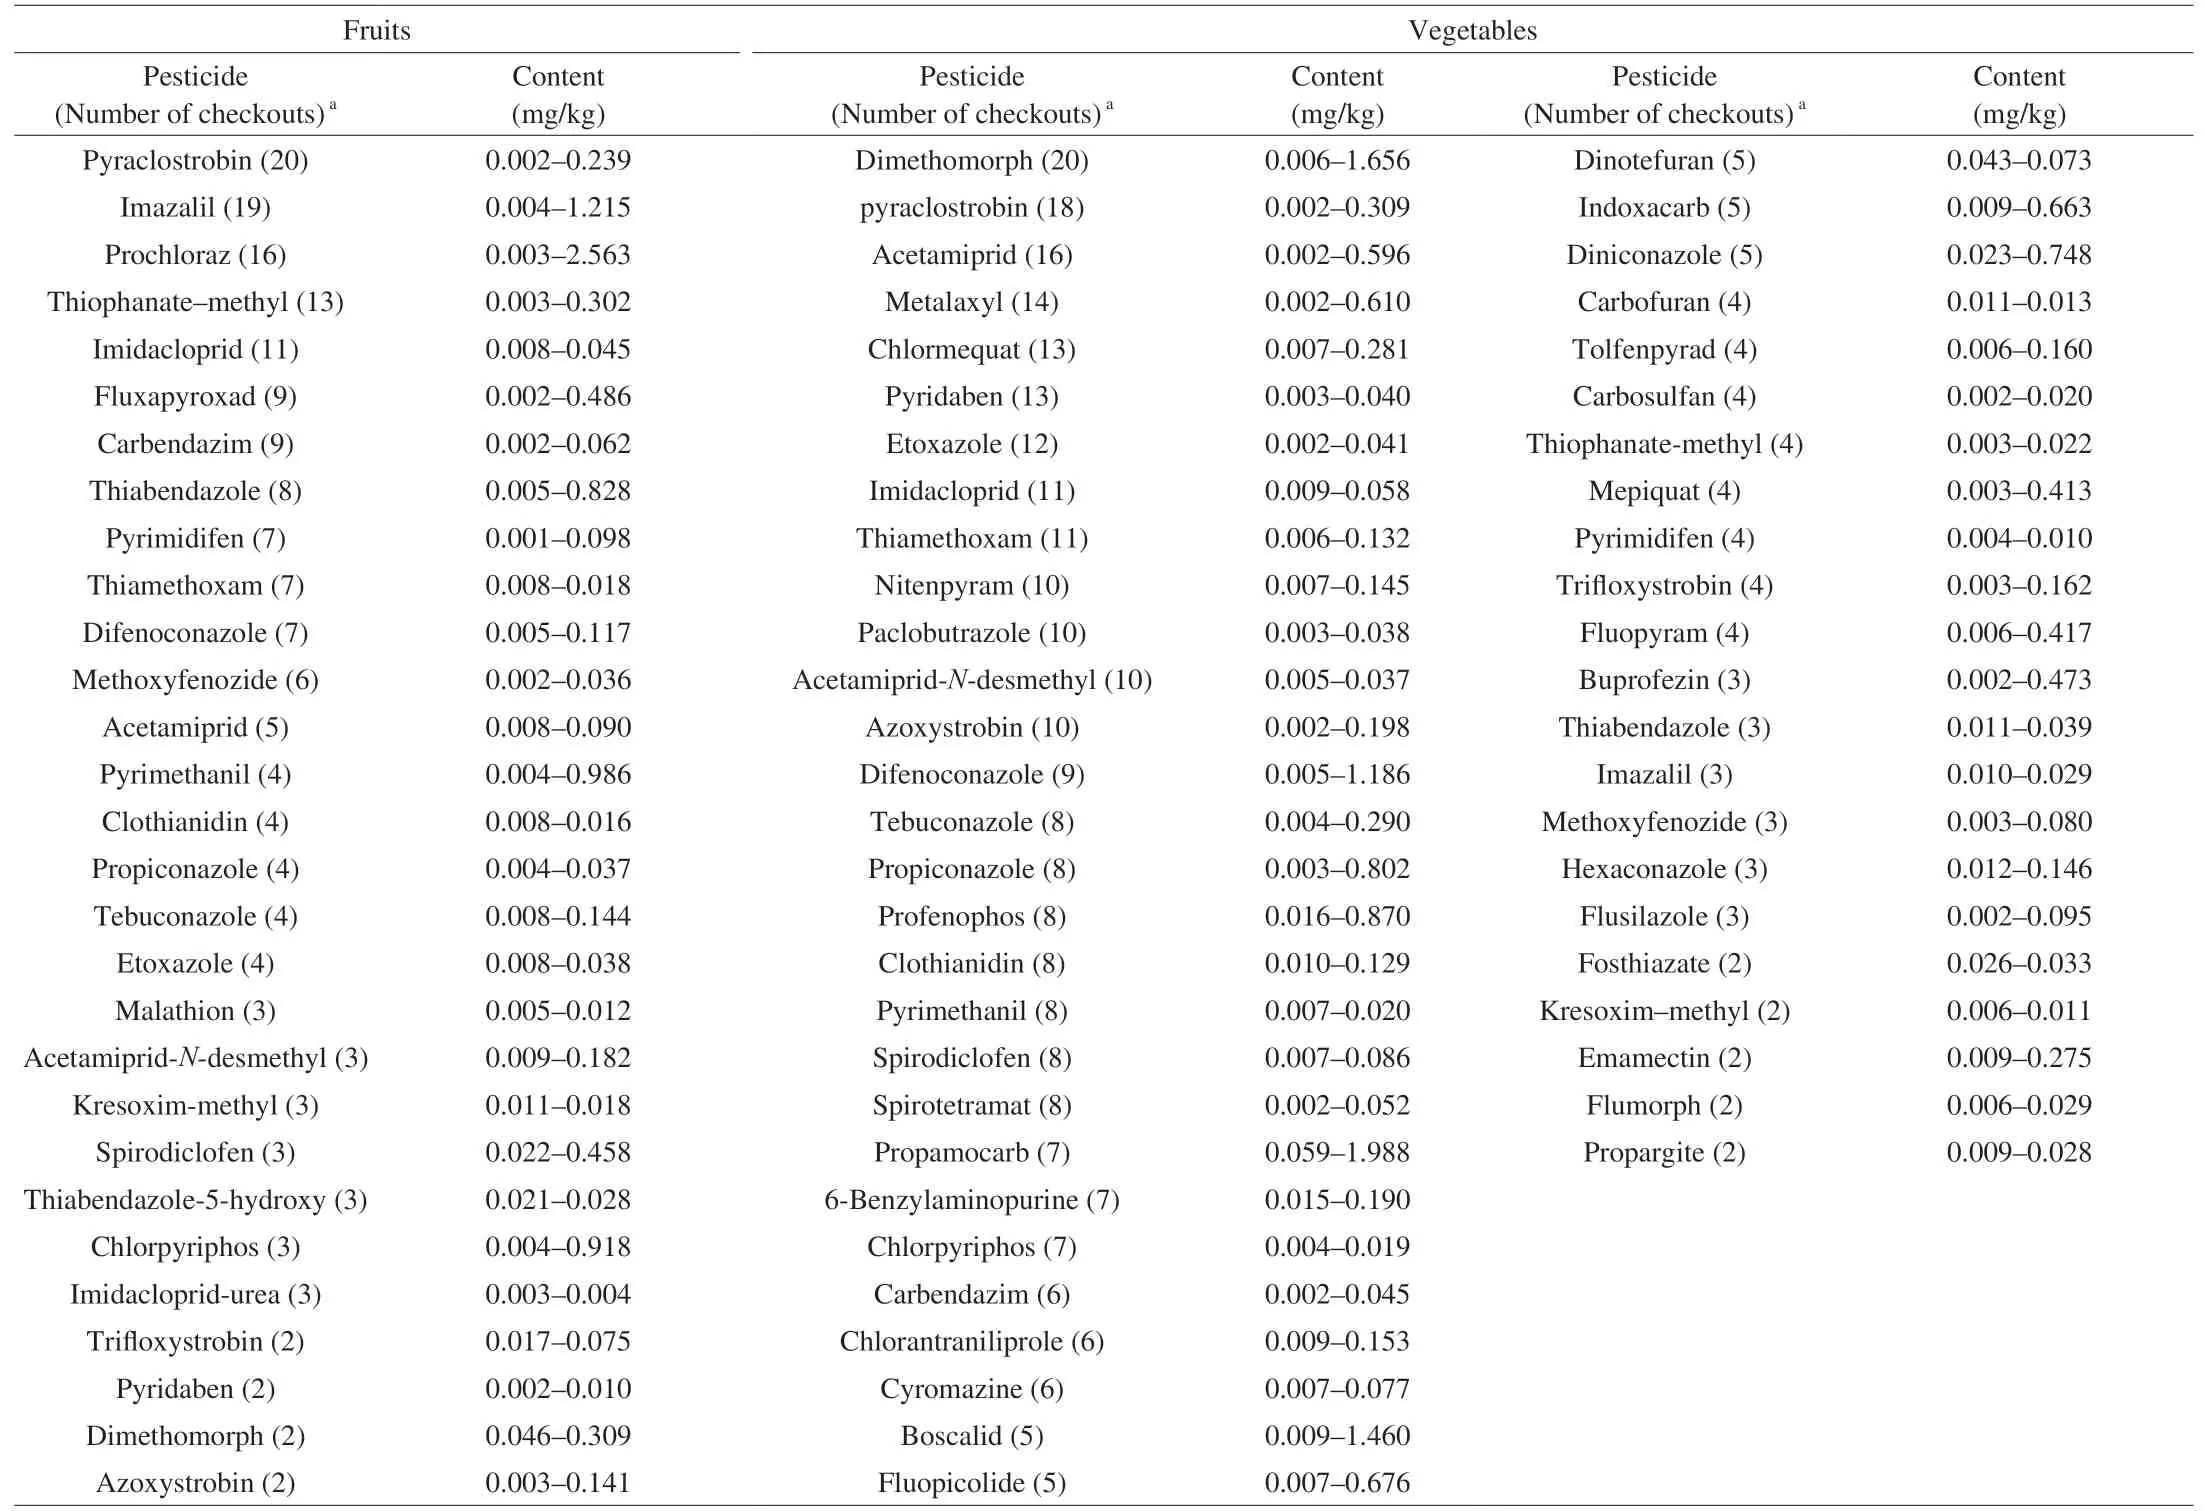
Table 1Screening results of pesticide residues in fresh fruits and vegetables.
4. Conclusion
This study established a method based on SinChERS-Nano column and UPLC-Triple TOFTM5600+system to determine 420 pesticide residues in vegetables and fruits. The pretreatment of this method was simple and fast. Triple TOFTM5600+performed qualitative and quantitative analysis through the accurate mass, retention time, isotope ratio, ion fragment information and other information to avoid false positives. This method greatly improved the detection efficiency and accuracy, and can quickly screen and confirm the pesticide residues in vegetables and fruits, which provided a powerful technical means for the risk monitoring of vegetables and fruits.
Conflicts of interest
The authors declared that they have no conflicts of interest in this work.
Acknowledgments
This work was supported by National Key Research and Development Program of China (2018YFC1603400) and Special Technical Support Project of State Administration for Market Regulation (2019YJ009).
Appendix A. Supplementary data
Supplementary data associated with this article can be found, in the online version, at http://doi.org/10.1016/j.fshw.2022.10.024.

- 食品科学与人类健康(英文)的其它文章
- Emerging natural hemp seed proteins and their functions for nutraceutical applications
- A narrative review on inhibitory effects of edible mushrooms against malaria and tuberculosis-the world’s deadliest diseases
- Modulatory effects of Lactiplantibacillus plantarum on chronic metabolic diseases
- The role of f lavonoids in mitigating food originated heterocyclic aromatic amines that concerns human wellness
- The hypoglycemic potential of phenolics from functional foods and their mechanisms
- Insights on the molecular mechanism of neuroprotection exerted by edible bird’s nest and its bioactive constituents