
The anti-cancerous mechanism of licochalcone A on human hepatoma cell HepG2 based on the miRNA omics
2023-01-03 11:30JunWngXiuxiuZhngZhijingNiElnurElmKirnThkurbKexinLiChuynWngJinguoZhngbZhojunWeib
食品科学与人类健康(英文) 2023年4期
Jun Wng, Xiuxiu Zhng, Zhijing Ni, Elnur Elm, Kirn Thkurb,,Kexin Li, Chuyn Wng, Jinguo Zhngb,,*, Zhojun Weib,,*
a School of Biological Food and Environment, Hefei University, Hefei 230601, China
b School of Food and Biological Engineering, Hefei University of Technology, Hefei 230009, China
c School of Biological Science and Engineering, Ningxia Key Laboratory for the Development and Application of Microbial Resources in Extreme Environments, North Minzu University, Yinchuan 750021, China
Keywords:Licochalcone A HepG2 cells Dysregulated miRNAs Transcription factors Targets Regulatory networks
A B S T R A C T To explore the function of licochalcone A as an anticancer phytochemical on HepG2 cells and investigate its potential mechanisms, we analyzed the microRNAs (miRNAs) expression prof ile of HepG2 cells in response to licochalcone A (70 µmol/L) in vitro. 102 dysregulated miRNAs were detected, and SP1 was expected as the transcription factor that regulates the functions of most screened miRNAs. A sum of 431 targets, the overlap of predicted mRNAs from TargetScan, miRDB, and miRtarbase were detected as the targets for these dysregulated miRNAs. FoxO signaling pathway was the hub pathway for the targets. A protein-protein interaction network was structured on the STRING platform to discover the hub genes. Among them, PIK3R1,CDC42, ESR1, SMAD4, SUMO1, KRAS, AGO1, etc. were screened out. Afterwards, the miRNA-target networks were established to screen key dysregulated miRNAs. Two key miRNAs (hsa-miR-133b and hsamiR-145-5p) were f iltered. Finally, the miRNA-target-transcription factor networks were constructed for these key miRNAs. The networks for these key miRNAs included three and two transcription factors, respectively.These identif ied miRNAs, transcription factors, targets, and regulatory networks may offer hints to understand the molecular mechanism of licochalcone A as a natural anticarcinogen.
1. Introduction
Cancer presents a serious public health problem as it has developed as the second leading cause of global death in the recent years [1]. Hepatocellular carcinoma ( HCC), formed by the cancerous transformation of hepatocytes, accounts for nearly 75%of primary liver cancers (PLCs) [2]. The pathogenesis of HCC is considered an intricate progression with multiple factors [3]. The various factors are tightly linked to hepatitis B virus infections, fat deposition, smoking, and excessive alcohol consumption [4]. For centuries, the basis of HCC strategy includes surgical interventions,radiotherapy, and chemotherapy [5]. Despite the developments in therapy, drug resistance and multiple side effects still lead to termination or treatment failure. Hence, the identification of some novel phytochemicals from natural sources, which exert beneficial effects and probably with less adverse reaction, is imperative for the treatment of HCC.
The genusGlycyrrhiza, also known as liquorice (Chinese Gan-Cao), is extensively utilized as a f lavoring and sweetening agent and an aff inal drug and diet in the foods and pharmaceutical industries [6].The liquorice root is widely used as a functional food due to its pharmacological properties [7]. Licochalcone A (LCA), a flavonoid extracted from the roots of liquorice, displayed various health benefits in asthma [8], obesity [9], and showed radical scavenging [10] and anticancer activity [11]. Notably, accumulating studies reported that LCA could significantly suppress tumorigenesis, invasion, and metastasis in many cancer cells, such as gastric cancer cells MKN-28 and MKN-45, prostate cancer cells PC-3 [12], osteosarcoma cells HOS and MG-63 [13], lung cancer cells A549 and H460 [14],breast cancer cell [15], and hepatoma cell HepG2 [16]. However, its microRNA (miRNA) omics-based anti-cancer mechanism has not been fully elucidated.
miRNAs are approximately 22 nucleotides endogenous RNA governing gene expression conversely at the post-transcriptional levels [17]. miRNA binds to 3’-UTR of target mRNA via imperfect or perfect matching, which induces target degradation. It has been acknowledged that numerous functional miRNAs play essential roles in various biological progressions, and dysregulated miRNAs are highly attendant with cancer development [18].
Recently, emerging data presented that plant-derived compounds such as paclitaxel, curcumin, resveratrol, quercetin or licochalcone B exert their anti-proliferative or pro-apoptotic properties through regulating miRNAs, leading to the inhibition of cell growth, induction of apoptosis, or improvement of conventional cancer therapeutic [19-21].Our previous study reported that LCA caused cytotoxicity with IC50(65.96 µmol/L), induced cell cycle arrest and apoptosis, and elevated the cellular ROS levels in HepG2 [16]. In the current study, the miRNA expression in LCA-treated human hepatoma cells HepG2 was further profiled to understand the underlying metabolic and signaling pathways. A progressed recognition of LCA’s action mode at the omics levels will promote innovative and effective therapeutic strategies to strive against HCC.
2. Materials and methods
2.1 Materials
As previous stated, LCA (purity 91.12%) was extracted fromGlycyrrhiza, which was procured from Xinjiang Ciconhabo Pharmaceutical Co., Ltd. (Xinjiang, China) [16]. The culture medium and defined fetal bovine serum and antibiotics (penicillin and streptomycin) were acquired from Sigma Chemical Company (St.Louis, Missouri, USA). The cell strain of human hepatoma cell HepG2 was obtained from Shanghai Wei Atlas Biological Technology Co.,Ltd. (Shanghai, China) [22]. Each chemical was of analytical grade.
2.2 Cell culture conditions and treatments
HepG2 was cultivated in the culture medium, including 10% heatinactivated defined fetal bovine serum, 1% antibiotics in a single layer at 37 °C, and in a humidified atmosphere with 5% CO2. The cells were seeded on 100 mm × 20 mm dishes at 3 × 10⁵cells per dish for 12 h. After the treatment with 70 µmol/L of LCA for 24 h, the cells were harvested. Non-exposed cells were used as controls.
2.3 Small RNA-sequencing
The small RNA-sequencing was accomplished by Shanghai Personal Biotechnology Co., Ltd. (Shanghai, China). Briefly, the miRNA was extracted by miRNeasy Mini kit (QIAGEN, Venlo,Netherlands) according to the manufacturer’s instructions, and each treatment had 3 duplicates (Control 1, Control 2, Control 3,Treat A1, Treat A2, and Treat A3). Quantification of pure miRNA was then done along with assessing the purity by NanoPhotometer spectrophotometer (IMPLEN, CA, USA). The miRNA libraries were completed utilizing the TruSeq Small RNA Sample Prep Kit and further sequenced by the Illumina Genome Analyzer (Illumina,San Diego, CA, USA). After filtering out the low-quality reads, the remaining clean reads were matched to the reference genome via Bowtie in the miRDeep2 pipeline. Differentially expressed miRNAs(DE-miRNAs) were filtered with the criterion of log2|fold change| > 1 andP< 0.05.
2.4 Validation of miRNA by RT-qPCR analysis
Fifteen DE-miRNAs were randomly chosen to validate the sequencing data by RT-qPCR. According to the rigorous principle,every primer for the reaction was designed from the miRprimer software (Table 1). RT-reaction of miRNA was performed with MiRcute Enhanced cDNA first-strand synthesis kit (TIANGEN,Beijing, China). Expression of U6 was utilized as an internal control. The qPCR reactions for miRNAs were performed with MiRcute Enhanced miRNA SYBR Green kit (TIANGEN, Beijing,China). Then the assays were set up on the LightCycler platform(Roche Diagnostics, Indianapolis, IN, USA). All the samples were run in triplicates, and the data were analyzed according to the 2-ΔΔCtmethod [23].
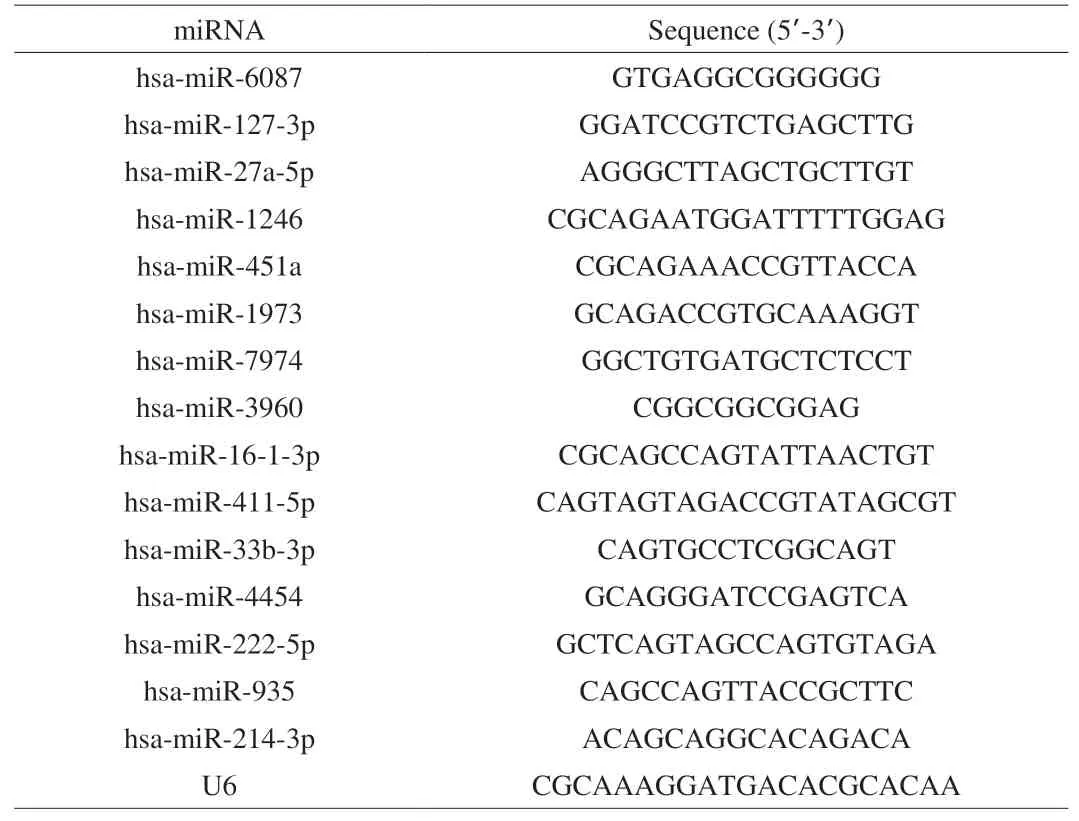
Table 1miRNA primers for RT-qPCR.
2.5 Prediction of transcription factors (TFs) and target genes
The TFs of assessed DE-miRNAs were predicted utilizing FunRich software, an independent tool primarily for functional enrichment and interaction network analysis [24]. After the input of screened DE-miRNAs to Funrich, the top 10 hits of the TFs were filtered out.
The miRWalk 3.0 platform was utilized to calculate the targets for DE-miRNAs based on the 3 bioinformatics databases (TargetScan,miRDB, and miRtarbase). The Venn analysis was employed to filter the potential targets from the databases above. The common mRNAs shared by the three databases were accepted as the targets and utilized for further analysis.
2.6 Gene Ontology (GO) annotation and Kyoto Encyclopedia of Genes and Genomes (KEGG) pathway enrichment analysis
GO enrichment and KEGG pathway analysis were constructed on the Cytoscape platform v3.8.0 and visualized by ClueGO v2.5.7 to determine the possible functions of the targets [25]. ClueGO v2.5.7 was functioned as an open module to explore ontology annotation of genes and analyze the noteworthy terms and pathways.P< 0.05 was recognized statistically significant for GO terms and KEGG pathway analysis [26].
2.7 Protein-protein interaction (PPI) network establishment and analysis of hub genes
As a bioinformatics platform, including the comprehensive co-expression, co-occurrence, and PPI information, the STRING databank [27] delivers a PPI valuation and assemblies. In this exploration, the detected targets were uploaded to the STRING databank. PPI node pairs with a high combined score ≥ 0.9 were filtered out. A module identified as cytoHubba v0.1 [27] was applied to determine the hub genes through computing the node scores by topological algorithms (Degree Centrality, Betweenness Centrality,and Closeness Centrality).
2.8 Construction of the miRNA-target network
To investigate the governing modes between miRNAs and their targets, miRNA-target interaction networks were created and visualized by Cytoscape. The network topology was computed by CytoNCA v2.1.6 by the same algorithms above to plug key DE-miRNAs.
2.9 Construction of the miRNA-target-TF network
miRNAs and TFs act as trans-regulators controlling targets regulatory networks [28]. Therefore, understanding miRNAs function may be more profound in relations between TFs and targets. During this analysis, the predicted TFs concerning the key DE-miRNAs were detected by iRegulon plug-in v1.3 [29] with rank threshold = 5 000,ROC threshold for area under curve calculation = 0.05, enrichment score threshold = 5.0, maximum FDR on motif similarity = 0.001, and the minimum identity between orthologous genes = 0.05. Then after,miRNAs-target-TF regulatory networks were constructed.
3. Results
3.1 Small RNA libraries construction
Six small RNA libraries from HepG2 with LCA treatments (Treat A1, A2, and A3) and without LCA treatments (Control 1, 2, and 3)were constructed. As a result, 14 559 164-21 035 329 raw reads were gained. After sifting reads containing adapter and low-quality reads,11 338 871-14 598 100 clean reads were acquired from each library(Table 2). Then before analysis, they were logged to the Rfam database to exclude the non-coding sequences. The miRBase (http://www.mirbase.org/) was performed to align the mature miRNA sequences and their precursors, followed by mapping the genome. A sum of 868, 871, and 896 miRNAs from the LCA-treated group and 1 165, 1 120, and 1 107 miRNAs from the control group were achieved (Table 2).
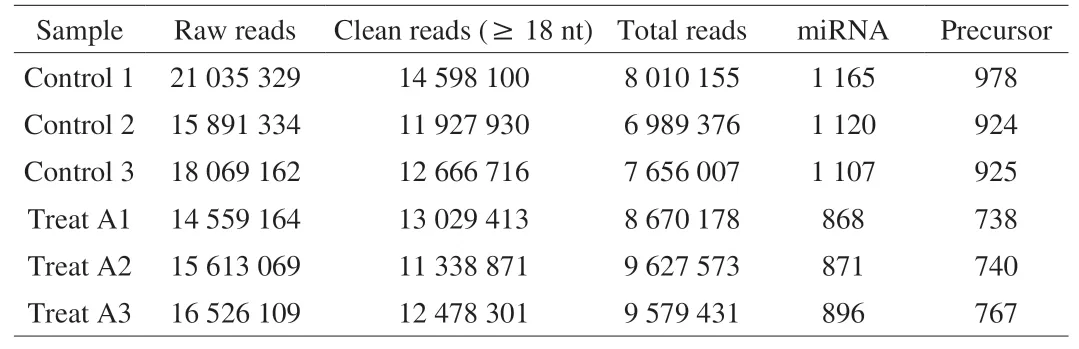
Table 2Statistical analysis of the small RNAs libraries.
3.2 miRNA differential expression analysis
In the heat map displayed in Fig. 1A, the miRNAs were parallel signified (one sample per column); where, red represented high expression and green represented low expression. The heat map representation revealed a similarity in the omics within the three triplicate runs of the LCA treated group (Treat A1, A2, and A3) and the control group (Control 1, 2, and 3), respectively. However, as Fig. 1A depicted, the expression pattern of two different groups was clearly distinguished. DE-miRNAs analysis revealed that 102 miRNAs were differentially expressed significantly between the LCA and control groups. As shown in the volcano map of DE-miRNAs (Fig. 1B),48 DE-miRNAs were up-regulated, and 54 DE-miRNAs were downregulated. Among them, hsa-miR-206, hsa-miR-1-3p, hsa-miR-133a-3p,hsa-miR-7704 and hsa-miR-4516 were most prominently up-regulated; whereas, hsa-miR-573, hsa-miR-3662, hsa-miR-92a-1-5p, hsa-miR-1275, and hsa-miR-1247-3p were most prominently down-regulated.

Fig. 1 miRNA-seq analysis of LCA-treated HepG2 cells. (A) Heat map of lower (green) and higher (red) DE-miRNAs expression levels. (B) Volcano plot(P < 0.05) of down-regulated (blue) and up-regulated (red) DE-miRNAs expression levels.
3.3 Validation of DE-miRNAs by RT-qPCR
Fifteen DE-miRNAs were selected, and the RT-qPCR analyses of them was performed to confirm the small RNA sequencing results. According to the RT-qPCR data, the tendency of 15 chosen miRNAs covering 8 increasing and 7 decreasing miRNAs was following the miRNA omics results (Fig. 2). For example, the expression levels of hsa-miR-451a obtained by RTqPCR and RNA-seq were 2.2 and 3.6, separately. Thus, the results above indicate that the omics data were reliable.

Fig. 2 Validation of the DE-miRNAs by RT-qPCR. Bars signify the relative expression level of DE-miRNAs. All values were log2 transformed.
3.4 Prediction of TFs for DE-miRNAs
In this study, TFs of DE-miRNAs were predicted by FunRich.By investigating the TFs enrichment, we screened the top 10 TFs with an intense closeness to miRNAs, includingEGR1,SP1,POU2F1,SP4,MEF2A,NKX6-1,NFIC,ZFP161,RREB1,andHOXA5(Fig. 3).SP1was predicted as the TF that regulates the expression of most screened DE-miRNAs. All the abovementioned TFs were suggested to be in the regulatory relationships with DE-miRNAs.

Fig. 3 Predicted TFs of DE-miRNAs.
3.5 Prediction of targets for DE-miRNAs
The online platform of miRWalk 3.0 based on 3 bioinformatics databases (TargetScan, miRDB, and miRTarBase) was utilized to predict the targets of DE-miRNAs. A sum of 431 genes, the overlaps of 1 404 predicted genes from the TargetScan database, 5 566 predicted genes from the miRDB database, and 2 172 predicted genes from the miRTarBase database were identified as the targets of 102 DE-miRNAs (Fig. 4).
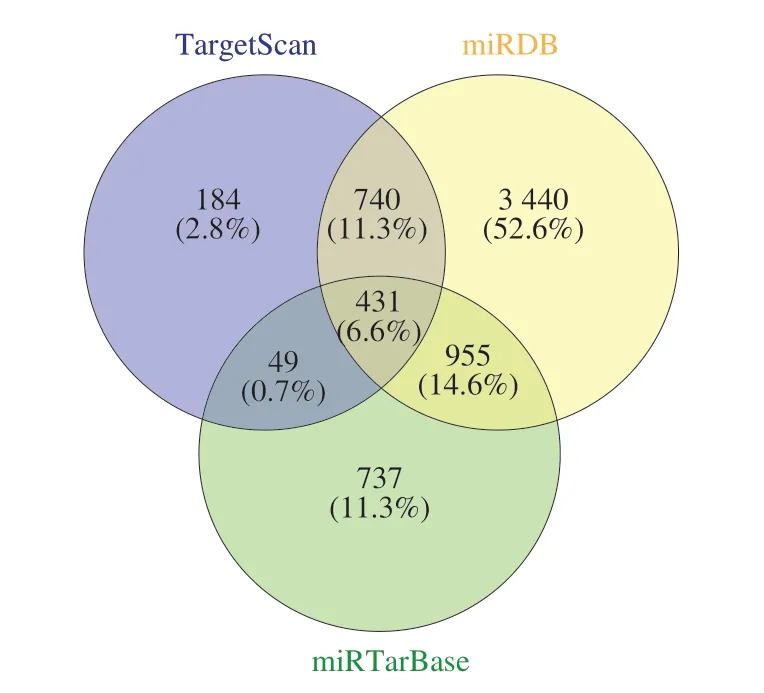
Fig. 4 The Venn diagram showed the overlapping predicted targets in TargetScan, miRDB, and miRTarBase databases.
3.6 GO analysis and GO-act network
GO analysis was employed to investigate the crucial functions of the target genes. The GO-tree networks were built to obtain the considerably enriched GO terms (Fig. 5). In the biological process(BP)-associated category, the most significantly enriched GO terms were related to DNA-binding transcription factor activity, RNA polymerase II-specific (GO:0000981) withP= 1.009 27 × 10-15;DNA-binding transcription factor activity (GO:0003700) withP=1.748 57 × 10-15; positive regulation of transcription, DNA-templated(GO:0045893) withP= 1.906 42 × 10-15; positive regulation of RNA metabolic process (GO:0051254) withP= 5.512 33 × 10-14and negative regulation of RNA metabolic process (GO:0051253) withP= 2.517 12 × 10-12(Fig. 5A, Table 3).
These targets were extensively enriched in DNA-binding transcription factor activity, RNA polymerase II-specific(GO:0000981) withP= 1.554 26 × 10-15; sequence-specific doublestranded DNA binding (GO:1990837) withP= 2.598 14 × 10-15;sequence-specific DNA binding (GO:0043565) withP= 1.086 22 × 10-14;double-stranded DNA binding (GO:0003690) withP= 2.044 60 × 10-14;and transcription regulatory region sequence-specific DNA binding(GO:0000976) withP= 1.170 06 × 10-13in the molecular function(MF)-associated category (Fig. 5B, Table 3).
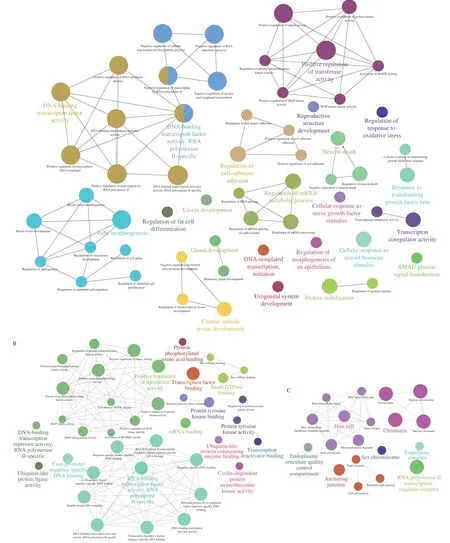
Fig. 5 GO-act networks of targets. Each group is categorized by the most significant term/pathway. The node size signifies the enrichment significance. Some of the associated groups overlapped partially. (A) BP-associated category; (B) MF-associated category; (C) CC-associated category.

Fig. 6 Pathway-tree network of targets. Each group is characterized by the most significant term/pathway. The node size signifies the number of enriched genes.The node shade signifies the enrichment significance.
Furthermore, the most significantly enriched in the cell component (CC)-associated category were chromatin (GO:0000785) withP= 1.182 48 × 10-12;chromosome (GO:0005694) withP= 2.150 62 × 10-12,nuclear chromatin (GO:0000790) withP= 1.186 68 × 10-11; nuclear chromosome (GO:0000228) withP= 6.309 70 × 10-11; and anchoring junction (GO:0070161) withP=1.721 18 × 10-5(Fig. 5C, Table 3).
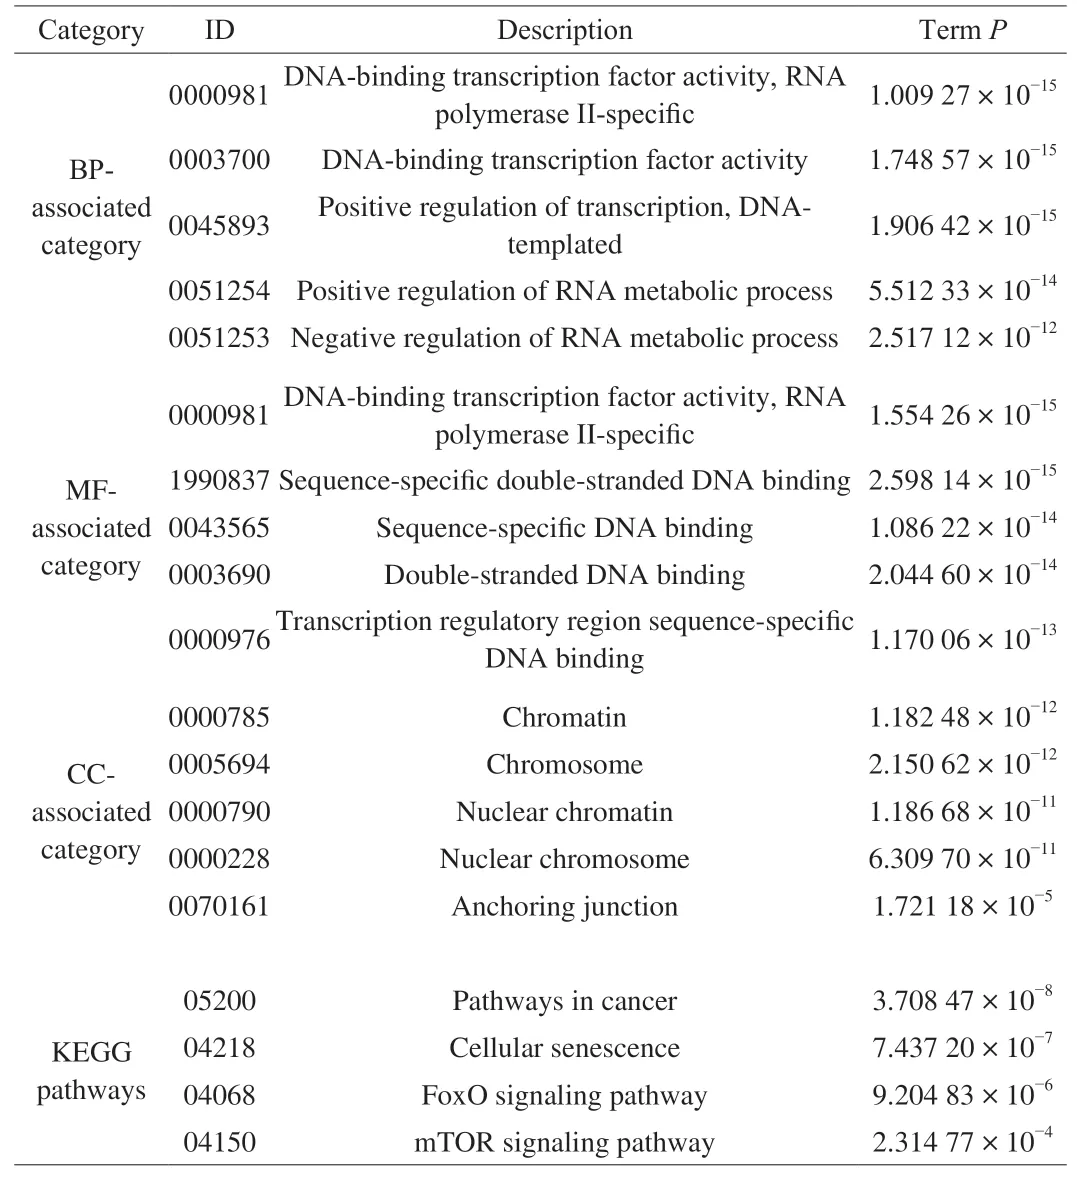
Table 3The most significantly enriched GO terms and pathways.
3.7 Pathway analysis and pathway-tree network
Correspondingly, pathway analysis was achieved to identify the related pathways of the predicted targets. The significantly enriched pathways were selected to achieve the pathway-tree networks to screen the hub pathways according to the mutual relationship between significantly pathways. The most significant pathways were such as pathways in cancer (KEGG:05200) withP= 3.708 47 × 10-8;cellular senescence (KEGG:04218) withP= 7.437 20 × 10-7; FoxO signaling pathway (KEGG:04068) withP= 9.204 83 × 10-6and mTOR signaling pathway (KEGG:04150) withP= 2.314 77 × 10-4(Fig. 6, Table 3). Furthermore, the FoxO signaling pathway was revealed to be the hub biological process, for it was located on the backbone of the pathway-tree network (Fig. 6). A total of 13 targets (AKT3,BCL2L11,CCND1,CCND2,IGF1,IGF1R,KRAS,PIK3R1,PTEN,SETD7,SIRT1,SMAD4, andSTK4) were enriched in the FoxO signaling pathway.
3.8 PPI network establishment and analysis of hub targets
A PPI network was established for the whole targets, including 175 nodes and 379 edges (Fig. 7A). Through network topology analysis, the top 30 nodes were identified. Later, 14 common target genes amongst these nodes were identified as hub genes (Table 4),such asPIK3R1,CDC42,ESR1,SMAD4,SUMO1,KRAS,AGO1,SP1,RUNX1,NUP133,CBL,CCNT1,E2F1, andPPP2R5E. A sub-network of the hub targets, including 14 nodes and 25 edges,was achieved to display their interactions (Fig. 7B). Moreover,through KEGG analysis, the hub targets were primarily enriched in such terms as vascular endothelial growth factor (VEGF) signaling pathway (KEGG:04370) withP= 1.025 03 × 10-4and mitophagy(KEGG:04137) withP=1.566 91 × 10-4(Fig. 7C).
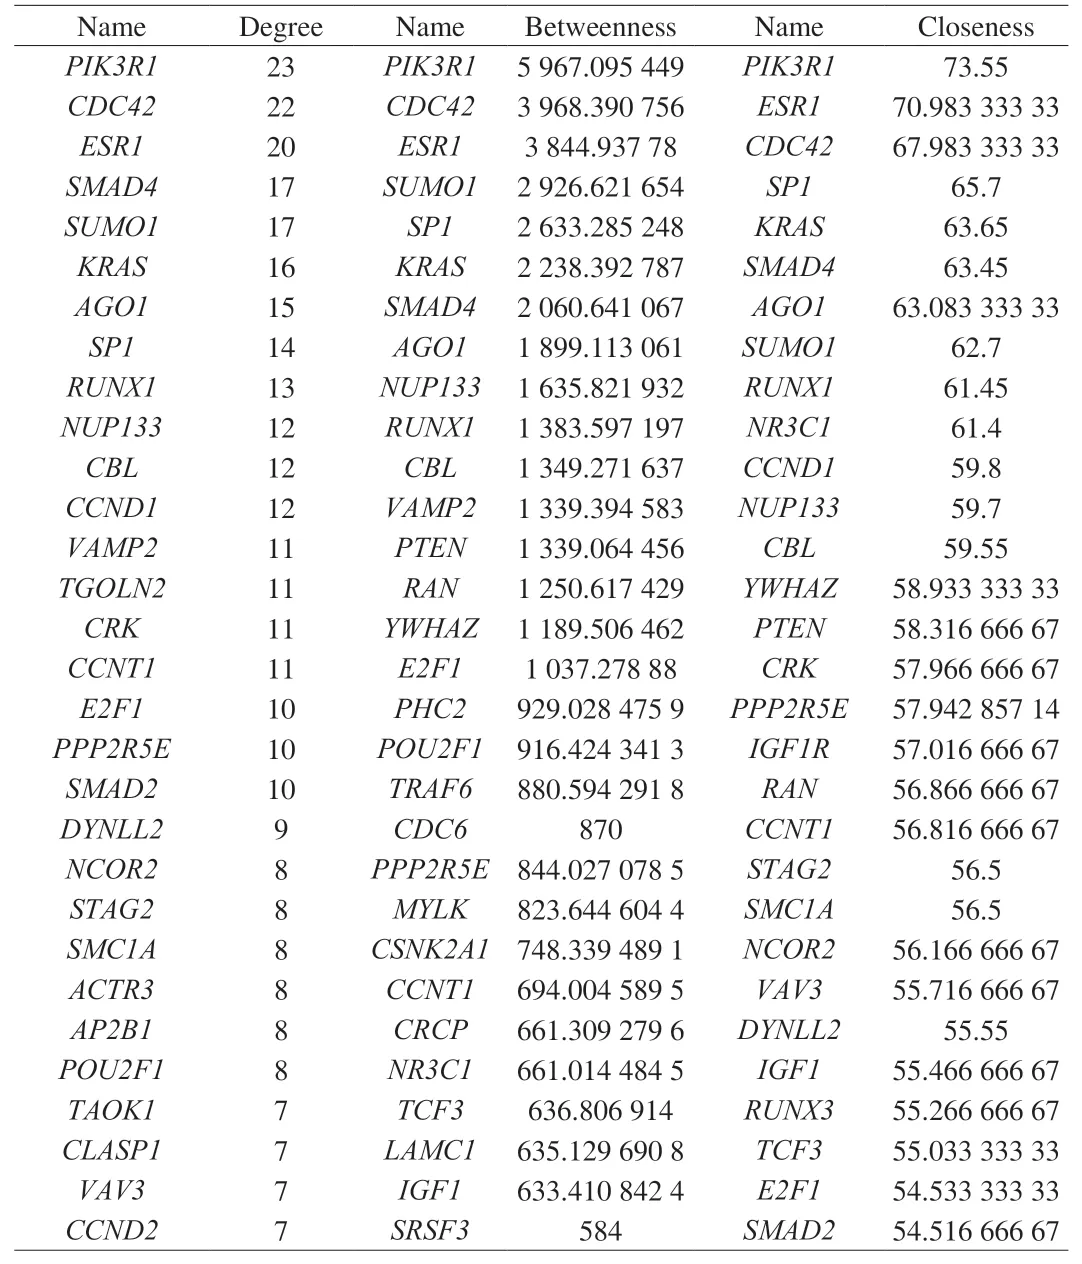
Table 4Top 30 nodes in the PPI network.

Fig. 7 The PPI analysis of targets. (A) The entire PPI network of annotated interactions between targets. (B) A sub-network module for the hub genes. (C) KEGG analysis of hub-gene targets.
3.9 Construction of the miRNA-target regulatory network
The miRNA-target regulatory networks were constructed to investigate the regulation between DE-miRNAs and targets and screen the key miRNAs. As shown in Fig. 8A, the regulatory network contained 18 up-regulated miRNAs and 417 targets, including 435 nodes and 580 edges. In Fig. 8B, the regulatory network contained 3 down-regulated miRNAs and 26 targets, including 29 nodes and 26 edges. Then, 2 key DE-miRNAs (hsa-miR-133b and hsa-miR-145-5p)with the high degrees were obtained according to the network topology. Both the DE-miRNAs were up-regulated, including hsa-miR-133b predicted to regulate 73 targets (Fig. 9A) and hsa-miR-145-5p predicted to regulate 73 targets (Fig. 9B).
3.10 Construction of the miRNA-target-TF network
It was assumed that the DE-miRNAs with high degrees in the regulatory network exert an enormous function. To further illuminate these miRNAs function, the miRNA- target gene-TF networks for these critical miRNAs were erected, respectively. As presented in Fig. 10,the regulatory network was constructed for hsa-miR-133b and hsamiR-145-5p including 3 TFs and 2 TFs, respectively.
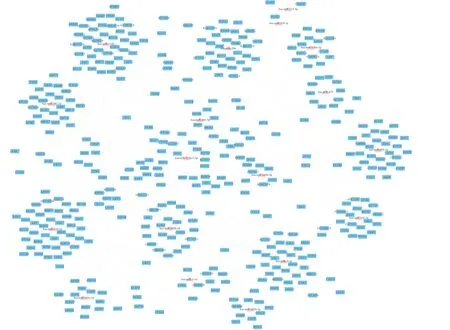
Fig. 8 Networks of miRNA-targets interactions. (A) The network of up-regulated miRNAs and their targets. (B) The network of the down-regulated miRNAs and their targets. Triangles symbolize miRNAs, and squares symbolize targets.
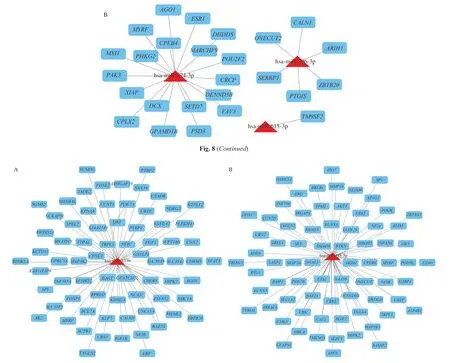
Fig. 9 Networks of key miRNA-targets interactions. (A) The network of has-miR-133b and their targets. (B) The network of has-miR-145-5p and their targets.Triangles symbolize miRNAs, and squares symbolize targets.

Fig. 10 Regulatory networks of the key miRNAs, targets, and TFs. (A) The network of has-miR-133b and three TFs; (B) The network of has-miR-145-5p and 2 TFs. Green octagons symbolize TFs, purple circles symbolize target genes regulated by key miRNAs and TFs, blue circles symbolize targets regulated by key miRNAs, and triangles symbolize key miRNAs.
4. Discussion
Recently, HCC has emerged as a primary cause of cancer-related mortality [2]. Though the death rate of HCC has been falling owing to better-quality medical environments, many people still suffer from it every year [3]. LCA, recognized as a pharmacological flavonoid inGlycyrrhiza, possesses anti-cancer abilities. Our previous study reported that LCA derived fromGlycyrrhizacould restrain cell viability, induce cell cycle arrest and apoptosis, and elevate the cellular ROS levels in HepG2 [16]. The underlying mechanism of the anti-cancer activities of LCA remains elusive. The acknowledgment of the miRNA omics in the progression of LCA-induced anti-cancer on Human hepatoma cell HepG2 can help illustrate the fundamental mechanism to develop new agents for HCC.
According to the omics data, a sum of 102 DE-miRNAs were screened out, including 48 increasing miRNAs and 54 decreasing miRNAs. Previous cancer-related studies have indicated that most of the DE-miRNAs expression pattern was identical with our analytic results. For example, has-miR-206 is significantly decreased in epithelial ovarian cancer cell lines and tissues, and the up-regulated has-miR-206 functions as a tumor suppressor in cancer cells [30]. The up-regulated miR-1-3p is reported to suppress the cell proliferation and aerobic glycolysis in gastric cancer [31]. In hepatocellular cells,the elevated miR-1-3p could significantly constrain cell proliferation and induce the apoptosis by targetingSOX9[32].
TFs regulate the transcription of genes and play a central role in regulating transcription. Previous studies have indicated that TFs can modulate miRNA expression. Hence, the TFs that can potentially regulate these DE-miRNAs were predicted.SP1, a zinc finger transcription factor that preferentially binds to GC-rich motifs of promoters, was calculated to regulate the expression of most screened DE-miRNAs in HepG2 cells. It acts as an essential performer in modulating miRNA patterns. It has been previously confirmed thatSP1participates in the miR-130b-3p/HOXA5axis, contributing to tumor angiogenesis and hepatocellular development [33].EGR1, a member of transcriptional factors regulating cell proliferation and differentiation, can be rapidly and transiently induced in response to several stimuli, including growth factors, cytokines, and mechanical stresses [34]. It has been proved thatEGR1can bind with miR-365a-3p promoted byCBX8to exhibit oncogenic activity in HCC [35].ThePOU2F1transcription factor is one of the most critical regulatory proteins in humans and other mammals. The promoted expression ofPOU2F1regulated by miR-539-5p accelerates the progression of HCC.HOXA5, which perfomed as a DNA-binding transcription factor, can control gene expression, cell morphogenesis, and differentiation in various cancer cells. A previous study found that the dysregulatedSp1/miR-130b-3p/HOXA5axis accelerates tumor angiogenesis and progression in HCC [33]. Taken together, these results indicate that the TFs shoulder an imperative role in HCC through mediating the dysregulated miRNAs and their interactors.
Then, through integrating three bioinformatics databases(TargetScan, miRDB, and miRTarBase), 431 target genes were filtered. Functional enrichment analysis could correlate targets with the regulation of transcription, DNA binding activities, and RNA metabolic process related to cancer progression. Pathway analysis displayed that these target genes were significantly enriched in pathways in cancer, cellular senescence, FoxO signaling pathway, and mTOR signaling pathway, etc. Moreover, the FoxO signaling pathway was revealed to be the hub biological process. It is known that the FoxO signaling pathway exerts an enormous function in HCC etiology [36].Various phytochemicals are informed to suppress the cancer cells through the FoxO signaling pathway. For example, the extract ofAegiceras corniculatuminduced apoptosis on human colorectal cancer via activation of the FoxO signaling pathway [37]. Berberine showed an anti-proliferative effect on HepG2 by inducing apoptosis and activate the FoxO signaling pathway [38]. In this study, 13 targets were related to the FoxO signaling pathway, including (AKT3,BCL2L11,CCND1,CCND2,IGF1,IGF1R,KRAS,PIK3R1,PTEN,SETD7,SIRT1,SMAD4, andSTK4). Among the Akt members,AKT3is frequently hyperactivated in human cancers, and is targeted for cancer therapy.AKT3dysregulation promotes spontaneous HCC [39].CCND1plays an essential role in tumorigenesis and metastasis in many cancers, especially in HCC. The inhibition ofCCND1suppresses cell differentiation and alleviates 5-Fu resistance in HCC [40].IGF1is associated with hepatocarcinogenesis in cellular programs such as cell cycle, proliferation, migration, apoptosis, etc.The systemicIGF1administration can alleviate fibrosis symptoms and improve general liver function [41].BCL2L11is a member of Bcl-2family and is recognized as a mediator for tumorigenic activity in HCC [42].PTENis reported to perform a mutated tumor suppressor gene role in human cancers, including HCC [43].STK4is recognized as a tumor suppressor and therapeutic biomarker for inflammationinduced HCC [44].
Furthermore, the PPI network was constructed, and 14 hub genes were identified. Previous research has reported that these specific genes are correlated to the cancer cells progression. In hepatocarcinogenesis,KRASis demonstrated to play a crucial role in cellular initiation and progress [45]. The activation ofCDC42exerts enormous effect on tumorigenesis, tumor invasion, and metastasis [46].AGO1, as a prognostic factor in HCC, promotes metastasis through the TGF-β pathway [47].CBLis reported to work as a moderator of MEK/ERK-induced cell scattering in poorly metastatic HCC [48].SUMO1is a modifier that participates in various cellular developments, such as transcriptional control and apoptosis. In HCC,the oncology drug sorafenib suppresses the invasion and metastasis with decreased interaction ofSUMO1[49]. After miRNA regulation,ESR1facilitates HCC cell proliferation, migration, and invasion [50].All the hub genes were significantly enriched in the VEGF signaling pathway. Recent research has shown thatVEGFis involved in the regulation of angiogenesis and several other mechanisms of tumor pathophysiology [51]. Moreover, in HCC, the proliferation of HepG2 cells to some extent was related to the VEGF signaling pathway [52].
According to these findings, the miRNA-target regulatory networks were established. Through calculating the nodes tagged high degrees, 2 vital DE-miRNAs (hsa-miR-133b and hsa-miR-145-5p)were detected and both were up-regulated. In the vital miRNA-target networks, hsa-miR-133b regulated 73 targets, such asAK2. Lately,considerable evidence has verified that the dysregulation of hsa-miR-133b is interrelated to various cancers. It acts as a tumor suppressor regulating cell proliferation, apoptosis, and differentiation. In colorectal cancer cells, the transfection of miR-133b slowed down the cell proliferation [53]. In HCC cells, up-regulation of miR-133b could inhibit HCC tumor genesis by targetingSIRT1[54]. Furthermore,as for esophageal squamous cell carcinoma, the overexpression of miR-133b inhibited cell proliferation, induced cell apoptosis, G2/M phase arrest, and lowered the cell invasion targetingEGFR[55]. Like miR-133b, another key miRNA miR-145-5p, might play a dual role in cancer cells. miR-145-5p is considered a tumor suppressor in gastric cancer [56], colorectal cancer [57], breast cancer [58], and bladder cancer [59]. Nevertheless, in lung cancer, miR-145-5p acts as an oncogene conversely to accelerate cancer development. A previous study showed that miR-145-5p inhibits the proliferation and invasion of HCC by regulatingSPATS2[60]. In this study, miR-145-5p regulates 73 targets such asZBTB20,CDK6,MAP3K3,CDC40, etc.ZBTB20is considered a tumor promoter in liver cancer. It can interact withPPARGto up-regulate the WNT/CTNNB1 signaling pathway,conduct tumorigenesis in HCC [61].CDK6is a member of serine/threonine protein kinases, and the altered expression ofCDK6has been observed in multiple human cancers [62].MAP2K3, which activatesp38in the MAP kinase-mediated signaling cascade, plays its role in HCC proliferation [63].CDC40, known as a cell division cycle 40 homolog, stimulates propagation, migration, and cell cycle in HCC cell lines [64].
For exploring the miRNA function further, the miRNA-target-TF networks for these key miRNAs were completed. has-miR-133b and 3 TFs such asSMAD3,SOX5, andPBX1were recognized as coregulators ofSUMO1,TBPL1, andERG, etc. hsa-miR-145-5p and 2 TFs such asSMAD3andE2F6were recognized as co-regulators ofSET,RLIM, andCRK, etc. In bladder cancers, theSMAD3mediated the transcriptional activity ofCTGF, and it was involved in the miR-497/SMAD3axis, and ultimately promoted the cancer progression [65].As for the gastric cancer tissues, there is an inverse correlation betweenSOX5and miR-338-3p.SOX5and miR-338-3p co-regulate the WNT pathway in gastric cancer [66].PBX1belongs to thePBXhomeobox family of transcriptional factors, acts as an oncoprotein in lymphoblastic leukemia and is reported to associate with various miRNAs as miR-126 and miR-196b [67]. Besides,E2F6was proved to be capable of repressing miR22 transcription in larynx carcinoma cells. TheE2F6-induced repression of miR22 could accelerate the larynx carcinoma development [67]. However, given the complication of miRNA and TF crosstalk, these regulatory interactions need to be scanned thoroughly. Anyhow, these regulatory patterns may offer a necessary information about the relationship between LCA and miRNAs with perceptions into the role of miRNAs as the mediators and the regulators of anticancer effects of LCA.
5. Conclusion
To summarize, this study is the first attempt to identify LCAresponsive miRNAs on HepG2 cells at the omics levels. A sum of 102 DE-miRNAs was detected, including 48 increasing DE-miRNAs and 54 decreasing DE-miRNAs. Based on an inclusive analysis of the miRNA expression profile, TFs and targets prediction, and GO/KEGG enrichment, we have preliminarily illustrated the LCA-responsive networks in HepG2. Targets of the LCA-responsive miRNAs were significantly enriched in the FoxO signaling pathway, which exerts an enormous function in the regulation of HCC. The network analysis showed the co-regulatory involvements among the key miRNAs,targeted genes, and TFs. Our results implied that LCA could be implemented as a natural anticarcinogen and assist therapy in HCC,promoting a comprehensive view of its anti-cancer effects. The miRNA omics data provided potential biomarkers to discover novel therapeutic targets for HCC.
Conflict of interest
There is none to declare.
Acknowledgments
This study was supported by the Hefei University Scientific Research and Development Fund (20ZR09ZDB), the talent fund of Hefei University (20RC48), the University Natural Sciences Research Project of Anhui Province (KJ2021A1009), the Major Projects of Science and Technology in Anhui Province (201903a06020021,202004a06020042, 202004a06020052, 201904a06020008), and the National Natural Science Foundation of China (31850410476).

- 食品科学与人类健康(英文)的其它文章
- Emerging natural hemp seed proteins and their functions for nutraceutical applications
- A narrative review on inhibitory effects of edible mushrooms against malaria and tuberculosis-the world’s deadliest diseases
- Modulatory effects of Lactiplantibacillus plantarum on chronic metabolic diseases
- The role of f lavonoids in mitigating food originated heterocyclic aromatic amines that concerns human wellness
- The hypoglycemic potential of phenolics from functional foods and their mechanisms
- Insights on the molecular mechanism of neuroprotection exerted by edible bird’s nest and its bioactive constituents