
Effect of titin phosphorylation on degradation of titin from skeletal muscles
2023-01-03 11:30YingWngXinLiDequnZhngZhengLiBoiXuJieZhu
食品科学与人类健康(英文) 2023年4期
Ying Wng, Xin Li, Dequn Zhng*, Zheng Li Boi Xu, Jie Zhu
a Key Laboratory of Agro-Products Processing, Ministry of Agriculture and Rural Affairs, Institute of Food Science and Technology,Chinese Academy of Agricultural Sciences, Beijing 100193, China
b School of Food Science and Engineering, Key Laboratory for Agricultural Products Processing of Anhui Province, Hefei University of Technology, Hefei 230000, China
c Laboratory of Biomechanics and Engineering, Institute of Biophysics and College of Science, Northwest A&F University, Yangling 712100, China
Keywords:Meat Titin Degradation Phosphorylation Alkaline phosphatase
A B S T R A C T The degradation of titin could make the myofibrillar fragmentation to improve meat tenderization during postmortem. This study aimed to investigate effect of phosphorylation on titin degradation. Protein kinase A(PKA) and alkaline phosphatase (AP) were added to crude titin extracted from ovine longissimus lumborum(LL) muscles. Phosphorylated/dephosphorylated titin were incubated with μ-calpain at 4 °C for 2 days.Results showed titin in AP group started degradation earlier than that in PKA and control groups. There were 20, 16 and 12 phosphorylated sites identif ied by iTRAQ in the PKA, control and AP group, respectively. 3D structure of dephosphorylated titin fragment was simulated and its molecular dynamics trajectory analysis was performed using Discovery StudioTM. The dihedral angle in AP group was less and the dephosphorylated fragment had a higher kinetic energy and total energy. We suggested that changes caused by AP treatment might make titin unstable, which easily degraded by μ-calpain.
1. Introduction
Meat tenderness is one of the most important attributes of meat quality for consumers [1]. Several factors inf luence tenderness during postmortem aging, especially postmortem proteolysis of myof ibrillar proteins and the length of sarcomere [2]. The giant elastic protein titin is the third most abundant protein that spans half of a sarcomere,which keeps the integrity and stability of the myof ibril [3,4]. The titin degradation could make the myofibrillar fragmentation to improve meat tenderization postmortem [1]. Previous studies found that titin degraded faster in muscles with higher ultimate pH, which had a higher activity of μ-calpain [5,6].
Protein phosphorylation is the attachment of a phosphate (PO4)group to a protein. Phosphorylation primarily occurs at serine(Ser), threonine (Thr), and tyrosine (Tyr) residues, which the new phosphorus group alters the role of the protein: it can activate,deactivate, or cause a change in function [7]. Protein phosphorylation has been shown to regulate protein stability and degradation,which in turn influences meat tenderness during postmortem [8,9].Chen et al. [10] observed that many myof ibrillar proteins including titin were phosphorylated inlongissimus lumborum(LL) muscle and the global phosphorylation level of tough meat was signif icantly higher than that of tender meat at 4, 12 and 24 h postmortem. In addition, the previous research in our team found that titin degraded earlier inpsoas major(PM) muscle, which had the higher phosphorylation level of titin than that in LL andsemimembranosus(SM) muscles [11]. Salmov et al. [12]reported that an increase in the phosphorylation level of titin from skeletal muscles had related with an increased proteolytic degradation of titin.
In addition, previous studies stated that cardiac titin could be phosphorylated by many protein kinases to affect its characteristics.There are two main elements of cardiac titin called N2B region and PEVK region (predominance in proline (P), glutamate (E), valine (V)and lysine (K) residues), which are targeted by kinases. The PEVK element could be phosphorylated by protein kinase Cα (PKCα), which played a significant role in contractile dysfunction [13]. Protein kinase A (PKA) phosphorylated the unique sequence of the N2B element,which reduced the passive stiffness [14]. However, few studies have concerned the direct effect of phosphorylation on titin degradation in skeletal muscles and the molecular events underlying the mechanics of titin remain largely unknown.
Therefore, this study investigated how PKA and alkaline phosphatase(AP) altered the phosphorylation of titinin vitroand elucidated whether the phosphorylation affects degradation of titin in skeletal muscles.Moreover, we simulated the 3D structure of titin fragment and made molecular dynamics trajectory analysis of the constructed proteins using the Discovery StudioTM. The outcome of this study may further our understanding of the mechanism of protein phosphorylation on degradation of titin to regulate postmortem meat tenderization.
2. Material and methods
2.1 Sampling
Samples from 5 non-castrated sheep of Fat Tail Han breed were collected at a local slaughter house. All procedures were undertaken following the guidelines of the Animal Care and the Ethics Committee for animal experiments of the Institute of Food Science and Technology, Chinese Academy of Agricultural Science. The sheep were 8 months old and their carcasses weight were approximately(18 ± 1) kg. The LL muscles were removed from the right side of carcasses within 30 min post-mortem. The muscle samples were immediately snap-frozen in liquid nitrogen and stored at -80 °C for further analysis.
2.2 Extraction of crude titin
Titin was extracted according to the method described by Soteriou et al. [15]with some modifications. The extraction process of titin was carried out at 4 °C. Ten grams of LL muscle was added to 30 mL of prechilled buffer A (pH 7.0) containing 50 mmol/L KCl, 5 mmol/L ethylene glycol tetraacetic acid (EGTA), 5 mmol/L proteinase inhibitor E 64 (E-64, Sigma-Aldrich, St. Louis, MO, USA), 1 mmol/L NaHCO3, and homogenized using IKA homogenizer (Ultra-Turrax DispersernS25, IKA-Labortechnik, Königswinter, Germany) on ice for 3 × 30 s. This was followed by 3 cycles of centrifugation with a highspeed refrigerated centrifuge (Hitachi Koki Co., Ltd., Tokyo, Japan)at the speed of 2 000 ×gfor 5 min. The myofibril proteins were resuspended with 2 volumes of buffer B, which including 0.9 mol/L KCl, 10 mmol/L imidazole, 2 mmol/L MgCl2, 2 mmol/L EGTA,40 μg/mL Leupeptin (Beijing Solarbio Science & Technology Co.,Ltd., Beijing, China), 0.5 mmol/L DTT, 5 mmol/L E-64, pH 7.0.The mixtures were then extracted on ice for 5 min. The extract was clarified for 30 min at 20 000 ×gand diluted 3 times with water. The precipitate was removed by spinning at 20 000 ×gfor 30 min after 1 h precipitated. The supernatant was diluted 5 times, stood for 40 min and centrifuged for 30 min at 11 000 ×g. The crude titin pellet was re-suspended in buffer C (0.6 mol/L KCl, 30 mmol/L K3PO4, pH 7.0).The crude titin was chromatographed in this buffer on a SuperoseTM6 Increase 10/300GL column (GE Healthcare Bio-Sciences Corp.,Piscataway, USA) maintained at 4 °C and then determined using BCA assay kit (Pierce Chemical Company, Rockford, USA).
2.3 In vitro phosphorylation and dephosphorylation of titin
The crude titin was diluted to 20 mg/mL and then assigned(30 μL) into three treatments, respectively. According to the protein content, the incubation system from three treatments were as follows [16].The system was then incubated at 30 °C for 30 min [17]. The procedures above were repeated in triplicate.
PKA group: 600 μL protein, 12 000 U PKA (10 U per 100 μg protein, Sigma-Aldrich, St. Louis, MO, USA), 480 μL ATP (500 mmol/L,2 μmol/L per 100 μg protein,Sigma-Aldrich, St. Louis, MO, USA);AP group: 600 μL protein, 3000 U AP (25 U per 100 μg protein,Sigma-Aldrich, St. Louis, MO, USA), 480 μL ATP (500 mmol/L);Control group: 600 μL protein, 480 μL ATP (500 mmol/L). The final volume was adjusted to 2.4 mL with the buffer C.
2.4 pH measurement
Before and immediately after incubation, pH values of the incubation system were measured by a FE20 pH meter (Mettler Toledo, Zurich, Switzerland).
2.5 In vitro proteolysis of titin by μ-calpain at different Ca2+concentrations
Phosphorylated and dephosphorylated titin (2 000 μg) was mixed with 60 μL μ-calpain (200 U) (Calbiochem, 208712) in the presence of 0.01, 0.1 and 1 mmol/L Ca2+at 4 °C [17]. The experiments were repeated three times per calcium concentration. When the mixture was incubated at 0.5 h, 12 h and 1 day, 2 days, the reaction was stopped by the reducing loading buffer, which included 100 mmol/L Tris-HCl(pH 6.8), 1 g/L bromophenol blue, 250 g/L glycerin, 10 mmol/L DTT,40 g/L SDS. At each time point, the mixtures from 3 tubes were took out as soon as possible. The mixtures were boiled at 100 °C for 5 min.
2.6 Sodium dodecyl sulfate-polyacrylamide gel electrophoresis (SDS-PAGE) and fluorescence staining
Bands of titin were separated by SDS-PAGE with 5% separation gel and then stained with Pro-Q Diamond dye (only used for phosphoproteins, Invitrogen, Eugene, OR, USA) and SYPRO Ruby dye (with a higher sensibility to detect the degradation of protein,Invitrogen, Eugene, OR, USA) [11]. The process was conducted with three replicates. The details were as follows. The proteins(30 μg) were loaded onto gels (acrylamide:bis-acrylamide ratio was 37.5:1). After electrophoresis, gels were fixed in fixative (100 mL,50% (V/V) ethanol and 10% (V/V) acetic acid) for 30 min. And the gels were washed with ultrapure water. After rinsing, gels were stained by Pro-Q Diamond for 80 min in darkness, then destained in destaining solution (pH 4.0, 50 mmol/L sodium acetate and 20%acetonitrile) for 30 min. After three washes in ultrapure water, the gels were scanned. Once scanned, the same gels were stained in darkness overnight in 80 mL of SYPRO Ruby. Finally, the gels were destained (10% methanol and 7% acetic acid), washed with ultrapure water and imaged.
Gels were scanned by ChemiDocTMMP Imaging System (Bio-Rad, Hercules, CA, USA). The phosphoproteins (P) content was expressed as the fluorescence intensity of titin band that stained by Pro-Q Diamond, while the total (T) protein content was expressed as the fluorescence intensity of corresponding titin band that stained by SYPRO Ruby. The phosphorylation level of titin protein band was calculated by P/T ratio. Standard protein marker (Thermo, Rockford,IL, USA) was used to calibrate protein band intensity among gels.The relative phosphorylation level of titin was the ratio of the phosphorylation level of titin to its phosphorylation level of standard protein marker in the same gel.
2.7 Identification of phosphorylation sites of titin by isobaric tags for relative and absolute quantitation (iTRAQ)
The identification method of phosphorylation sites of titin was performed by iTRAQ according to the description by Du et al. [16].Two bands of titin were found using coomassie brilliant blue R250 stain. Two bands for one sample were excised from gels and subjected to the digestion including trypsin. The excised gel was then washed for 30 min twice followed by 10 mmol/L DTT for 1 h at 56 °C.The gel pieces were dehydrated (100% acetonitrile), alkylated for 45 min in dark (50 mmol/L iodoacetamide) and then incubated in 100 μL 0.01 μg/μL trypsin solution at 37 °C overnight. After incubation, the supernatant was collected and added with extraction solution. The tryptic sample was dried and dissolved in the mobile phase solution. The precipitation was removed at 10 000 ×gfor 10 min. The supernatant (10 μL) was injected into the Q Exactive LC-MS/MS (Thermo Q-Exactive, Thermo Fisher Scientific, Waltham, MA, USA).
The peptide samples were subjected to the analysis of a Q Exactive mass spectrometer (Thermo Fisher Scientific, Waltham, MA,USA), which was connected to EASY-nLC 1200 nano-HPLC. The MS/MS spectra data were searched in the UniProt by the Proteome Discoverer (Thermo Fisher Scientific, Waltham, MA, USA).
2.8 Homology modeling of dephosphorylated protein fragment of titin
The homology modeling was performed to construct 3D structure of dephosphorylated protein fragment from sheep according to the description of Chen et al. [18]. Constructing the dephosphorylated protein was based on the known structure by the BIOVIA Discovery StudioTM(version 2018, NeoTrident Technology Ltd., Beijing, China).First, the amino acid sequences of phosphorylated titin peptides were obtained by iTRAQ and the sequence of titin was obtained from UniProt (https://www.uniprot.org/). The amino acid sequences of dephosphorylated peptides were found out by the comparison analysis for the phosphorylated titin peptides from PKA group, control group and the AP group. The search for sequence similarity were carried out by the NCBI BLAST analysis, which revealed suitable templates for the constructed dephosphorylated protein fragment. To ensure the accuracy of the homology modeling, a protein sequence with 30% identity to a known structure is generally considered to be threshold limit [19,20]. Finally, the model was selected the best one with the lowest probability density functions (PDF) total energy and discrete optimized potential energy (DOPE) score [21]. The model was verified by the Profile-3D analysis. The Ramachandran Plot was also performed to make sure the correctness for the stereochemical feasibility of proteins [22].
The molecular formula of phospho-d-serine (PubChem CID:129635266) was found in NCBI (https://pubchem.ncbi.nlm.nih.gov/compound). The phosphorylated titin protein fragment was constructed by mutating from the Serine (Ser) to the phospho-d-serine(Sep) in the best model using Discovery StudioTM.
2.9 Molecular dynamics simulation
To better assess the changes in the structure, we performed a molecular dynamics simulation using the Standard Dynamics Cascade protocol. During the simulation, the target temperature was set at 4 °C, which was consistent with the incubation system. Finally,we analyzed the trajectory for all the conformations. To prove the changes in the structure, we make the analysis of protein torsion angel, kinetic energy and total energy of the last conformation.
2.10 Statistical analysis
The data was analyzed by the SPSS statistical software (version 19.0; IBM Corporation, Chicago, IL, USA). Comparisons among groups were made by one way ANOVA followed by post-hoc analysis with least significant difference (LSD). The significance level was considered atP< 0.05. All the data were presented as means ± standard deviation (SD).
2.11 Data availability
The data in this study are available in the following databases:1) The crystal structures have been deposited in the Protein Data Bank(PDB) with the following accession codes: 3B43 (https://www.rcsb.org/structure/3B43); 2RJM (https://www.rcsb.org/structure/2RJM);2RIK (https://www.rcsb.org/structure/2RIK). 2) The MS/MS spectra data were searched in the UniProt (https://www.uniprot.org/). 3) The sequence of proteins was obtained from UniProt (https://www.uniprot.org/). 4) The molecular formula of phospho-d-serine (PubChem CID:129635266) was found in NCBI (https://pubchem.ncbi.nlm.nih.gov/compound).
3. Results
3.1 pH values of incubation systems
The pH values of the incubation systems of titin with different phosphorylation levels were shown in Table 1. The pH values were lower after incubation than before in each group (Table 1,P< 0.05).There were no significant differences of pH among three groups before and after incubation in this study (Table 1,P> 0.05).

Table 1pH of titin systems from PKA control and AP group.

Table 2Phosphorylated sites of titin from the PKA, Control and AP groups.
3.2 Phosphorylation level of titin
After electrophoresis, effects of PKA and AP on phosphorylation of titin were determined (Fig. 1). The bands of titin were shown on Pro-Q Diamond (Fig. 1A) and SYPRO Ruby stained gels (Fig. 1B).The relative phosphorylation levels of titin from the PKA, control and AP groups were shown in Fig. 1C. The relative phosphorylation level of titin in the PKA group was higher compared to the control group,which had a higher relative phosphorylation level than that in the AP group (P< 0.05).
3.3 Degradation of titin
The titin degradation from PKA, control and AP groups at different concentrations of Ca2+was present in Fig. 2. There might be μ-calpain which is a calcium activated enzyme in the incubation system. The increased concentration of Ca2+could activate μ-calpain which may degrade titin. The degradation rate of titin of the AP group increased with the increase of Ca2+concentrations. The T2 band became fuzzy after 2 days incubation at the Ca2+concentration of 0.1 mmol/L (Fig. 2B), while the T2 at 12 h degraded completely at the Ca2+concentration of 1 mmol/L in AP group (Fig. 2C). At the Ca2+concentrations of 0.01 and 0.1 mmol/L, there were T1 and T2 bands in the PKA and control groups (Figs. 2A and B), while there were a band weighted 1 200 kDa besides the bands of T1 and T2 at the Ca2+concentration of 1 mmol/L (Fig. 2C). The degradation of titin became faster as Ca2+concentration increased (Fig. 2).

Fig. 1 Gel based analysis of titin phosphorylation. (A) Image of gel stained with Pro-Q Diamond. (B) Image of gel stained with SYPRO Ruby. (C) Quantificationof phosphorylation level of titin. Values with stars differ between groups, *P < 0.05. The same below.
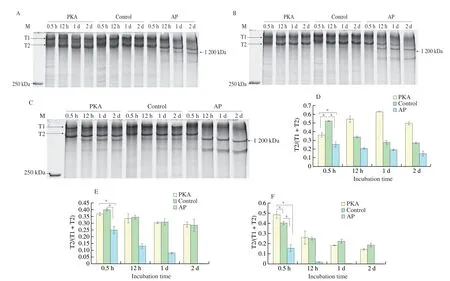
Fig. 2 Degradation of titin from PKA, control and AP group. (A, D) Degradation of titin at 0.01 mmol/L Ca2+. (B, E) Degradation of titin at 0.1 mmol/L Ca2+.(C, F) Degradation of titin at 1 mmol/L Ca2+. (D-F) A quantitative analysis of titin degradation. T1, T2 and the band weighted 1 200 kDa indicated intact titin,its major degradation product and another degradation product.
The present study also found that the band with molecular weight of 1 200 kDa was obtained at the Ca2+concentrations of 0.01 and 0.1 mmol/L in the AP group, while it was not detected in the PKA and control groups (Figs. 2A and B). At the Ca2+concentration of 1 mmol/L, the band weighted 1200 kDa showed in three groups.However, there was no T2 band in the AP group after 12 h incubation(Fig. 2C). The T2/(T1+T2) in PKA group increased before 1 day and then decreased afterwards, while it deceased in AP and control groups during 2 days at the Ca2+concentration of 0.01 mmol/L (Fig. 2D). The PKA and control groups had higher values of T2/(T1+T2) than AP group (P< 0.05, Fig. 2D). In addition, the T2/(T1+T2) decreased in these groups at the Ca2+concentrations of 0.1 and 1 mmol/L (Figs. 2E and F). The results indicated that the rate of titin degradation in the AP group was faster than that in the PKA and control groups at the

Fig. 3 Constructed titin fragments with homology modeling. (A) The alignment sequence between proteins from templates. (B) The scores for constructed protein models. (C) The constructed protein including Ser 7478.
same Ca2+concentration.
3.4 Phosphorylated sites of titin
To confirm the existence of titin in the extraction, the protein in these two bands were identified. The entry of the protein in UniProt was W5Q754 (Entry name: W5Q754_SHEEP, Protein name: Titin).In addition, 20 phosphorylated sites of titin in the PKA group and 16 phosphorylated sites in the control group were identified by iTRAQ, but only 12 phosphorylated sites were detected in the AP group (Table 2).There were 4 less phosphorylated sites in the control group than PKA group, i.e. Ser 13916, Ser 24796, Thr 17993 and Tyr 23516.The AP and control groups had 8 common phosphorylated sites except Ser 810, Ser 7478, Ser 24795 and Ser 33897. Ser 810,Ser 7478 and Ser 13916 locate in immunoglobulin domain of elastic titin region, while Thr 17993, Ser 24795, Ser 24796 and Ser 33897 are in immunoglobulin domain of inelastic titin region. Tyr 23516 exists in the fibronectin domain of inelastic titin region.
3.5 Homology modeling of the dephosphorylated protein fragment of titin
As 3D structure of titin from sheep is not available, the homology modeling was performed to construct the dephosphorylated protein fragment based on the known structure. There were no templates suitable for modeling titin fragment with phosphorylation at Ser 810,Ser 24795, and Ser 33897. There were 3 templates (PDB code: 3B43,2RIK and 2RJM) to construct the titin fragment containing Ser 7478(Table 3). The constructed titin fragment (Ser 7478) included 571 amino acids. The Ser 523 in constructed protein fragment was Ser 7478 in the integrate titin. We built two models (M1 and M2, Fig. 3B)after multiple sequences alignment (Fig. 3A). Finally, M1 was selected as the best one based on the least PDF total energy (11 074.04 J)and DOPE score (-47 962.16) (Fig. 3C).

Table 3Templates for homology modeling of dephosphorylated titin fragment including Ser 7478.
The selected model M1 was then evaluated by the Ramachandran Plot (Fig. 4A) the Profile-3D analysis (Fig. 4B). The calculated verify score for each of residues in the constructed protein model M1 was shown in Fig. 4B. These results showed the verify score of the constructed M1 was close to the expected high score (Fig. 4B). Based on that the M1 had the maximum number of residues in the favored regions (93.88%), minimum disallowed regions 2.45%, the model M1 was selected, Meantime, the 3D structure of phosphorylated protein was built by changing from Ser to Sep in Fig. 5.
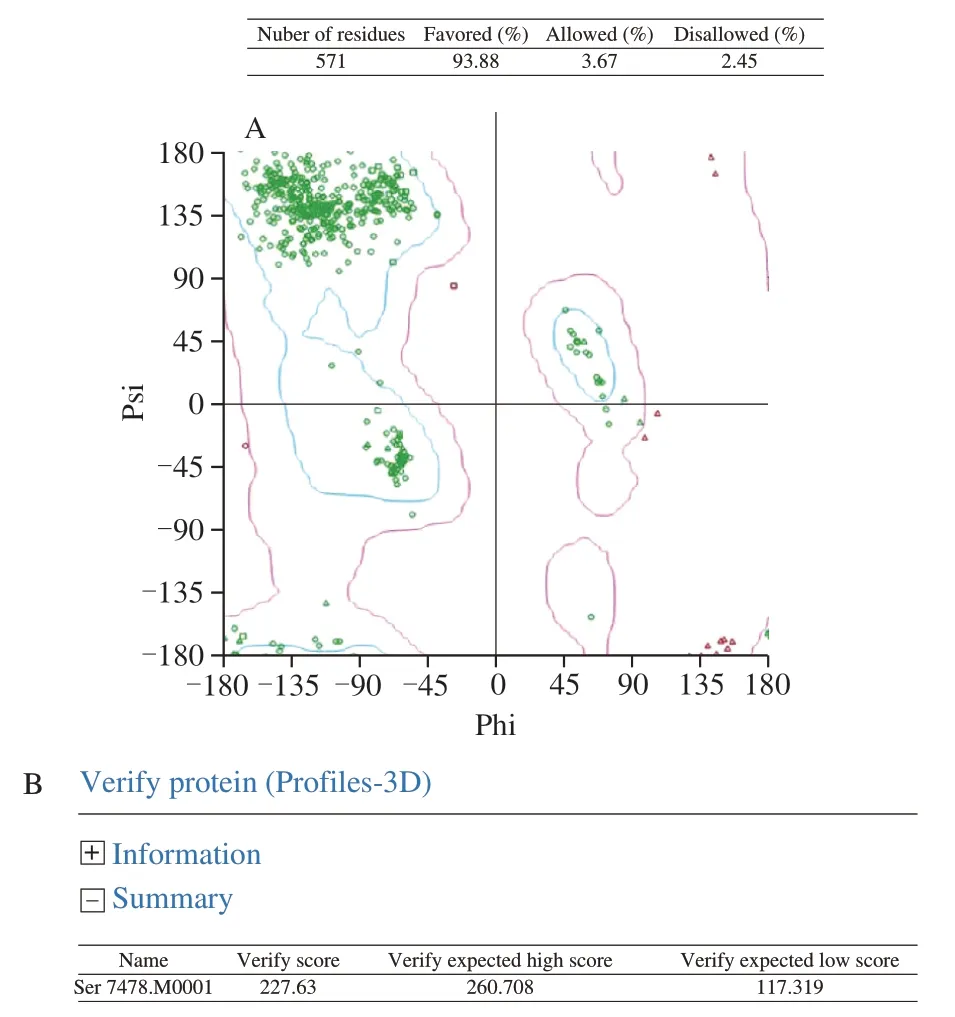
Fig. 4 Evaluation results for the selected model of titin fragment.(A) Evaluation by Ramachandran Plot, blue zones in Ramachandran Plot are the optimal region. The purple area is the permitted area. The red dots in other areas are the unreasonable amino acids. (B) Evaluation by profiles-3D.

Fig. 5 Phosphorylated serine residue and 3D structure of phosphorylated titin fragment. (A) The mutation from the Ser to the Sep. (B) The 3D structure of phosphorylated titin fragment.
3.6 Changes in the structure of titin
To further study, the analysis of the dihedral angle of serine in the constructed titin fragment was carried out to study the change of structure of titin fragment treated by AP. The dihedral angle of serine of titin fragment in the AP group was 129.90°, while the dihedral angle in the control group was 136.68° (Fig. 5). The angle of titin from the AP group was smaller compared to the control group.It indicated that the structure of protein fragment in the AP group became more folded with the angle decreasing.
In addition, we also made molecular dynamics trajectory analysis for two structures. The results of energy analysis showed that the kinetic energy and total energy of the protein fragments were 75 452 and -378 958 J in control group (Table 4). After dephosphorylation,the energy changed to 75 725.4 and -377 873 J. The results showed that the energy of titin fragment in AP group increased compared with the control group (Table 4).

Table 4Trajectory analysis of 3D structures of constructed titin fragments.
4. Discussion
The degradation of myofibrillar proteins influences meat tenderness postmortem. The degradation of the giant protein titin could damage the structure of the myofibrils to promote meat tenderness [1,2]. In this study, the rate of titin degradation became faster with the increasing concentrations of Ca2+(Fig. 2). This was
because titin was the substrate of μ-calpain [23]. The increased concentration of Ca2+promoted the degradation of μ-calpain and activated μ-calpain, which was a calcium dependent protease and required micro-molar of calcium for its activation [24].
In the incubation systems, we found that pH values were lower after incubation than before in each group (Table 1,P< 0.05).The result due to that the ionization recombination equilibrium constants of H2O increase with temperature, which made the pH value decrease in all the incubation systems. In addition, AP group had the lowest relative phosphorylation level compared to PKA group and Control group (Fig. 1). The result was caused by the effect of PKA and AP. AP is a phosphohydrolase that can catalyze the hydrolysis of monophosphate to release free inorganic phosphate or to transfer the phosphoryl group to other alcohols [25]. There were 12 phosphorylated sites in the AP group and Ser 810, Ser 7478,Ser 24795 and Ser 33897 were dephosphorylated by AP compared with the control group (Table 2). The number of phosphorylated sites was less than that in the PKA and control groups, which make the phosphorylation level of AP group lowest. Titin degraded faster in AP group, compared to PKA group and Control group (Fig. 2). There were no significant differences in pH among 3 groups in this study(Table 1). The result of this study excluded the possible different activity of μ-calpain caused by pH variation [26]. Published data on changes in the sensitivity of titin to degrade by calpain depending on the level of its phosphorylation are absent [14]. In this study, 3D structure of dephosphorylated protein fragment was simulated and the molecular dynamics trajectory analysis was made to speculate the mechanism of effect of protein phosphorylation on degradation of titin. The result showed the dihedral angle of serine changed small after dephosphorylation and the change in the angle induced the structure more folded (Fig. 6). The change in structure of titin protein fragment made the kinetic energy and total energy increased compared the control group (Table 4). Therefore, this result indicated the dephosphorylated titin fragments were unstable in this study [19].The same result that the phosphorylation of myosin regulatory light chain (MRLC) at Ser 17 made the structure more stable was stated by Cao et al. [27]. The dephosphorylated fragments including Ser 810 and Ser 7478 are in immunoglobulin domain of elastic titin region,while Ser 24795 and Ser 33897 are in immunoglobulin domain of inelastic titin region. The changes in immunoglobulin domains of elastic region and inelastic region may make the conformation of the whole titin protein changed, leading to the unstability of protein [28].These changes in structure of titin fragments caused by AP might led to the recognization of titin by μ-calpain easily and promoted the degradation of titin, which could make the myofibrillar fragmentation to improve meat tenderization postmortem.
In addition, the relative phosphorylation level of titin in the PKA group was higher than that in the control group (Fig. 1C). This was because the kinase domain potential phosphorylation sites of titin could be phosphorylated by PKA [3]. In this study, the sites including Ser 13916, Ser 24796, Thr 17993 and Tyr 23516 of titin were phosphorylated by PKA. The number of phosphorylated sites in PKA group was more than that in the control group.
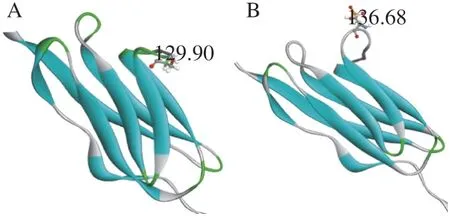
Fig. 6 Changes in the dihedral angles of Ser 523 at the titin fragment caused by phosphorylation. (A) The dihedral angles of serine from original protein fragment. (B) The dihedral angles of serine from phosphorylated protein fragment evaluation results for the selected model of titin fragment. Blue zones in Ramachandran Plot are the optimal region. The purple area is the permitted area. The red dots in other areas are the unreasonable amino acids.
5. Conclusion
PKA and AP could effectively alter the phosphorylation of titin
in vitro. The phosphorylation level of titin was significantly increased by PKA, while decreased by AP. Changes in structure of titin caused by AP treatment might make titin unstable, which easily degraded by μ-calpain. The results of this study indicated that phosphorylation of titin may decrease the degradation of titin and meat tenderization postmortem.
Competing financial interests
The authors declare no competing financial interests.
Acknowledgments
This study was financially supported by National Natural Science Foundation (32102035), the Agricultural Science and Technology Innovation Program (CAAS-ASTIP-2020-IFST-03), Central Publicinterest Scientific Institution Basal Research (S2019RCJC01,S2020JBKY-16).

- 食品科学与人类健康(英文)的其它文章
- Emerging natural hemp seed proteins and their functions for nutraceutical applications
- A narrative review on inhibitory effects of edible mushrooms against malaria and tuberculosis-the world’s deadliest diseases
- Modulatory effects of Lactiplantibacillus plantarum on chronic metabolic diseases
- The role of f lavonoids in mitigating food originated heterocyclic aromatic amines that concerns human wellness
- The hypoglycemic potential of phenolics from functional foods and their mechanisms
- Insights on the molecular mechanism of neuroprotection exerted by edible bird’s nest and its bioactive constituents