
Variable Stars in the 50BiN Open Cluster Survey.III.NGC 884
2024-03-22 04:11LinHongWangQianHengNieKunWangXiaoDianChen3ChunGuangZhang3LiCaiDeng3XiaoBinZhang3andTianLuChen
Lin-Hong Wang, Qian-Heng Nie, Kun Wang, Xiao-Dian Chen3,4, , Chun-Guang Zhang3,4,, Li-Cai Deng3,4, ,Xiao-Bin Zhang3,4,, and Tian-Lu Chen
1Department of Physics, College of Science, Tibet University, Lhasa 850000, China; lhwang@bao.ac.cn
2 Key Laboratory of Cosmic Rays, Tibet University, Ministry of Education, Lhasa 850000, China
3 Key Laboratory of Optical Astronomy, National Astronomical Observatories, Chinese Academy of Sciences, Beijing 100101, China; licai@bao.ac.cn
4 School of Astronomy and Space Science, University of Chinese Academy of Sciences, Beijing 100049, China
5 Middlesex School, Concord, Massachusetts, United States of America
6 School of Physics and Astronomy, China West Normal University, Nanchong 637002, China
Abstract Open clusters are the basic building blocks that serve as a laboratory for the study of young stellar populations in the Milky Way.Variable stars in open clusters provide a unique way to accurately probe the internal structure,temporal and dynamical evolutionary stages of individual stars and the host cluster.The most powerful tool for such studies is time-domain photometric observations.This paper follows the route of our previous work,concentrating on a photometric search for variable stars in NGC 884.The target cluster is the companion of NGC 869,forming the well-known double cluster system that is gravitationally bound.From the observation run in 2016 November,a total of 9247 B-band CCD images and 8218 V-band CCD images were obtained.We detected a total of 15 stars with variability in visual brightness, including five Be stars, three eclipsing binaries, and seven of unknown types.Two new variable stars were discovered in this work.We also compared the variable star content of NGC 884 with its companion NGC 869.
Key words:stars:variables:general–(Galaxy:)open clusters and associations:individual(...,...)–(stars:)binaries:general
1.Introduction
Members of an open cluster (OC) are thought to be born in almost the same molecular cloud,with similar ages and chemical abundances,and all have nearly the same distance to Earth(Lada et al.1993;Friel 1995).Owing to such properties,the OC serves as an ideal laboratory for the establishment of the theory of stellar structure and evolution(Evans et al.2009;Granada et al.2018).In addition,various types of variable stars in open clusters provide an extra tool for studying the fundamental stellar parameters and the internal structure that otherwise cannot be seen directly.Exotic objects that do not follow the standard theory of stars are also quite common in an OC, such as blue stragglers, hot subdwarfs etc.The pulsating variables and some binary stars provide unique probes to the internal structure and the information of age and surface gravity.For example: Geller&Mathieu(2011)revealed the origin of mass exchange of blue straggler stars in NGC 188 by estimating the masses of their eclipsing binary companions.The study of variable stars has an ample application in astronomy and cosmology.The classical Cepheid,for instance,is a ruler to measure distance of galaxies,and to determine accurate structure of the Milky Way.Chen et al.(2019) used Cepheids to sketch the first intuitive threedimensional diagram of the Galactic stellar disk,thus discovered the warp and its procession of the stellar disk of our galaxy.
NGC 884 in Perseus is sparse and young, and together with NGC 869,is known as the Perseus double cluster (also known as h and χ persei due to their morphological locations).The double cluster has been the focus of extensive researches on OCs.As early as 1937, Oosterhoff (1937) studied the Perseus double cluster on the basis of photographic plates.Subsequently, based on the modern photometry technology of CCD and spectroscopic technology, astronomers studied the basic physical parameters of the double cluster, determining a reddening of the cluster as E(B-V)=0.52–0.56 mag (Slesnick et al.2002; Currie et al.2010), a distance modulus of 11.75–11.85 mag and an age of logAge=7.07–7.20 (Keller et al.2001; Currie et al.2010).Zhong et al.(2019) used data from Gaia data release 2(DR2)to determine the distribution of member stars in double clusters, and on the basis of this, they discovered a possible long-stretching filamentary substructure associated with the system, which indicates that the system is undergoing an active dynamic interaction.
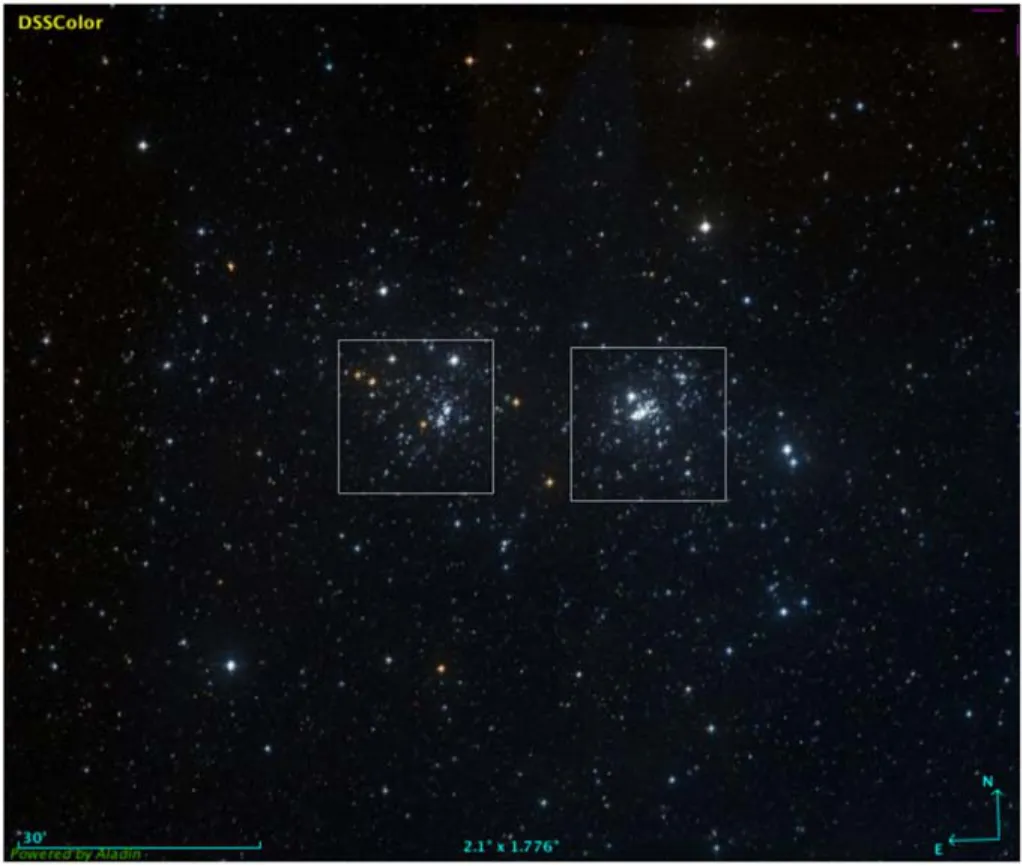
Figure 1.The color image extracted from Aladin showing the Perseus double cluster,where the two white boxes represent the fields of view(FOV)of 50BiN for NGC 869 (right) and NGC 884 (left).
The 50 cm binocular network telescope(50BiN)is dedicated equipment for the study of OCs in time-domain (Deng et al.2013; Wang et al.2015; Tian et al.2016).In last few years, it has observed NGC 2301 (Wang et al.2015), NGC 188 (Chen et al.2016),NGC 744(Wang et al.2018)and NGC 869(Zhuo et al.2021).The two clusters, NGC 869 and NGC 884, in the double cluster system were intensively observed.Figure 1 is a color image extracted from Aladin7http://aladin.cds.unistra.fr/aladin.gmlshowing the Perseus double cluster,where the two white boxes are the 50BiN FOV for NGC 869(right)and NGC 884(left).The distance between the center of two clusters is 27 47,corresponding to 18.306 pc in space.Due to the limited FOV of 50BiN(2 0′ × 20′),we are able to observe only one of the double cluster at one time.In the previous work (Zhuo et al.2021), we focused on variable stars in the region around NGC 869.
In the current work, we used 50BiN to search for variable stars in NGC 884 and its surrounding region.Combined with previous work on NGC 869, we also carried out comparative study of the Perseus double clusters.This paper is structured as follows: the observations and data reduction is presented in Section 2; Section 3 describes the data analysis, mainly giving the classification of variable stars; Section 4 focuses on the binary ratio of NGC 869 and NGC 884; Section 5 is a brief summary.
2.Observations and Data Reduction
Time-series photometry of NGC 884 was taken by 50BiN in 2016 November.The telescope is equipped with two identical optical tubes, mounted on either side of the telescope’s polar axis(German equatorial),and the two tubes always point to the same sky area during the mission.The optical system for each tube consists of a 50 cm aperture R-C barrel, on which an Andor DZ936 CCD camera (2K×2K pixels) is applied at the Cassegrain focus.The filter wheels for both are Johnson-Cousins-Bessel UBVRI filters, so that any color combinations can be available for any observational plan.The FOV of 20′ × 20′ of unvignetting is realized at the focal planes,and the pixel ratio is 0 59-1.Between 2016 November 8 and 2016 November 30, we acquired a total of 17,465 CCD images, of which 9247 were in the B-band and 8218 in the V-band.For this cluster,the B-band and V-band exposure times were 30 and 40 s, respectively.Table 1 shows the observation log of NGC 884.

Table 1 The Observation Log of NGC 884
Like our previous studies (Wang et al.2015; Zhuo et al.2021), the raw data of NGC 884 was processed by an automated pipeline that performs the standard data reduction steps including dark, bias and flat corrections, astrometric calibration, and point source photometry.The results of this procedure give instrumental magnitude of each detected star in the FOV.As the primary goal of this work is to look for variable stars using the technique of differential photometry,no standard calibration images were taken during the observations.Using the wealth of references to this cluster in the literature,and especially observations that were also took in the Johnson-Cousin system,we can relatively calibrate our images by using the unsaturated non-variable stars in the field, thus converting the instrumental magnitudes to the true apparent magnitude.The following equations were used for the conversion:
where B and V are the calibrated magnitudes, b and v are the instrumental magnitudes derived from our images by the pipeline, X and Y are the positions of the stars in the images,and the coefficients a1, a2, a3, a4and b1, b2, b3, 44are all obtained by least squares.

Figure 2.Light curves of the 15 variable stars in the B and V bands.
3.Data Analysis
The Stetson variability index J (Stetson 1987) was first calculated for each star using the B and V time-series photometric light curves, and we paid more attention to stars with J>0.4(Zhang et al.2003).Variable star candidates were then selected by visual inspection of both B-band and V-band light curves.Note here that variable star candidates need to be eliminated if they are located close to the edge of the image or contaminated by nearby bright stars.In the end, we detected a total of 15 variable star candidates from the current data set,labeled as V1–V15.Their light curves over the nine nights are shown in Figure 2.The blue and black dots present the differential magnitude ΔM in the B band and V band,respectively.
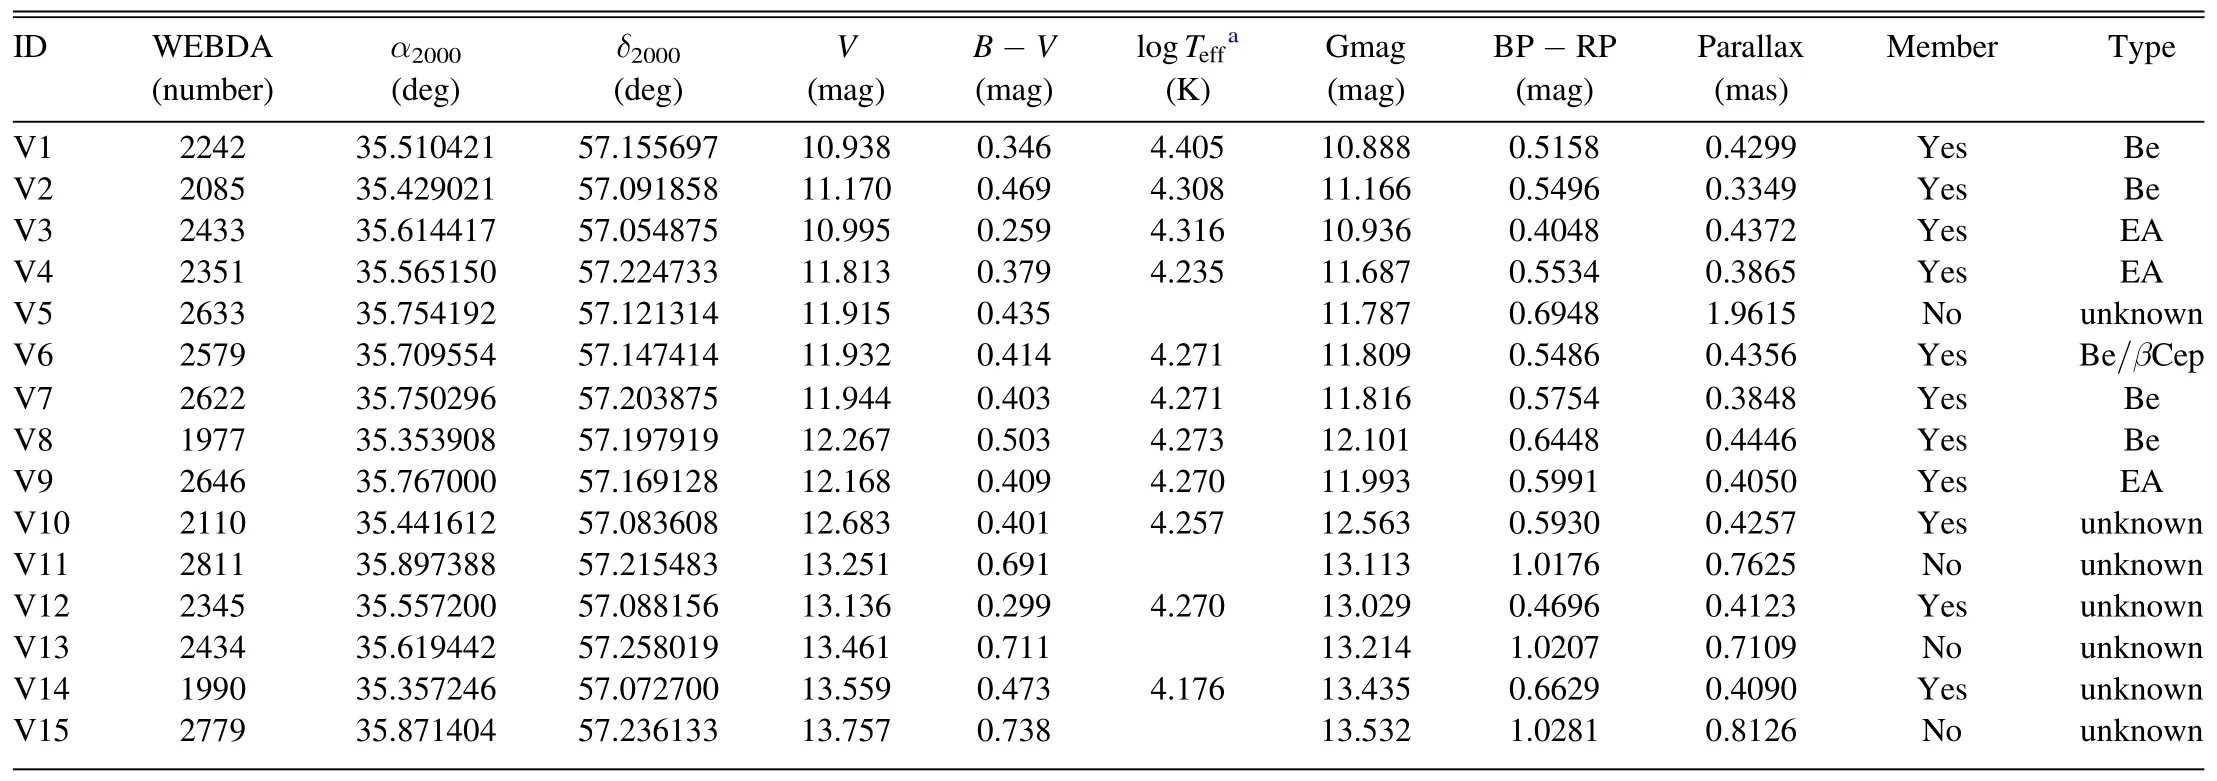
Table 2 The Basic Parameters of Variable Candidates in NGC 884
We cross-checked the above 15 candidates with the SIMBAD8http://simbad.u-strasbg.fr/simbad/by their coordinates, and found out that V1–V10,V12, V14, V15 have been confirmed as variable stars by previous observational studies.For comparison purposes, we add the WEDBDA ID of these variable stars.Table 2 lists the basic parameters of these 15 variable stars,where the coordinates are in J2000, parallaxes and proper motion data are obtained from Gaia DR3 (Gaia Collaboration et al.2023), the membership are derived based on these parameters(see Section 3.1).The effective temperatures are from Slesnick et al.(2002).The last column of the table gives a classification of the variable stars according to their light curve morphological characteristics,their periods and their position on the color–magnitude diagram(CMD).The details of classifications are discussed below.
3.1.Membership Analysis
In order to classify the variable stars,it is necessary to determine the membership of the variable star candidates.Thanks to the astrometric and photometric data of Gaia DR3, we can derive membership information for all stars in our time-series photometric data.Column 11 of Table 2 shows the membership flag.
First,we used data from the cores of NGC 869(α=34°.7408,δ=57°.1339) and NGC 884 (α=35°.5841, δ=57°.1489), with a range of about 15′ radius, as samples for identifying member stars.Nulling is done while preserving the R.A., decl., proper motion, parallax, Gmag, and BP-RP.Next, we selected stars with Gmag < 18 mag based on the limiting magnitude of 50 BiN and the Gmag error of Gaia DR3.As shown in Figure 3,we used a double Gaussian approach for analyzing the pmRA (a) as well as the pmDEC (b) of NGC 869 and NGC 884, respectively.The red line in the figure represents the member stars of NGC 869,and the red dotted line represents the field stars of NGC 869; the blue line represents the member stars of NGC 884, and the blue dotted line represents the field stars of NGC 884.By working in pmRA-pmDE plain,we carried the membership determinations for the double clusters, which give 1513 member stars for NGC 869 and 1311 member stars for NGC 884.The sigma constraint was then applied to the parallaxes,resulting in 1368 and 1154 member stars for NGC 869 and NGC 884.In order to ensure the reliability of the member stars, we cross checked our results with those of Currie et al.2010, and the overlap is over 80%.
Finally, through cross-certification, 11 of the 15 variable stars were found to be cluster member stars.Figure 4 shows the position of variable stars on the CMD, with different symbols for different types.Cyan dots represent cluster members,hollow circles represent variable stars that are cluster members,and solid circles represent those the none-members.Blue hollow circles are Be stars, red hollow circles are eclipsing binaries (EBs), orange hollow circles and orange solid circles are variable stars with unknown types.The black solid line shows the Padova theoretical isochrone (Bressan et al.2012)with the cluster parameters from Currie et al.(2010).
3.2.The Discovery of Two New Variable Stars

Figure 3.Distribution of proper motions for stars in NGC 869 and NGC 884.
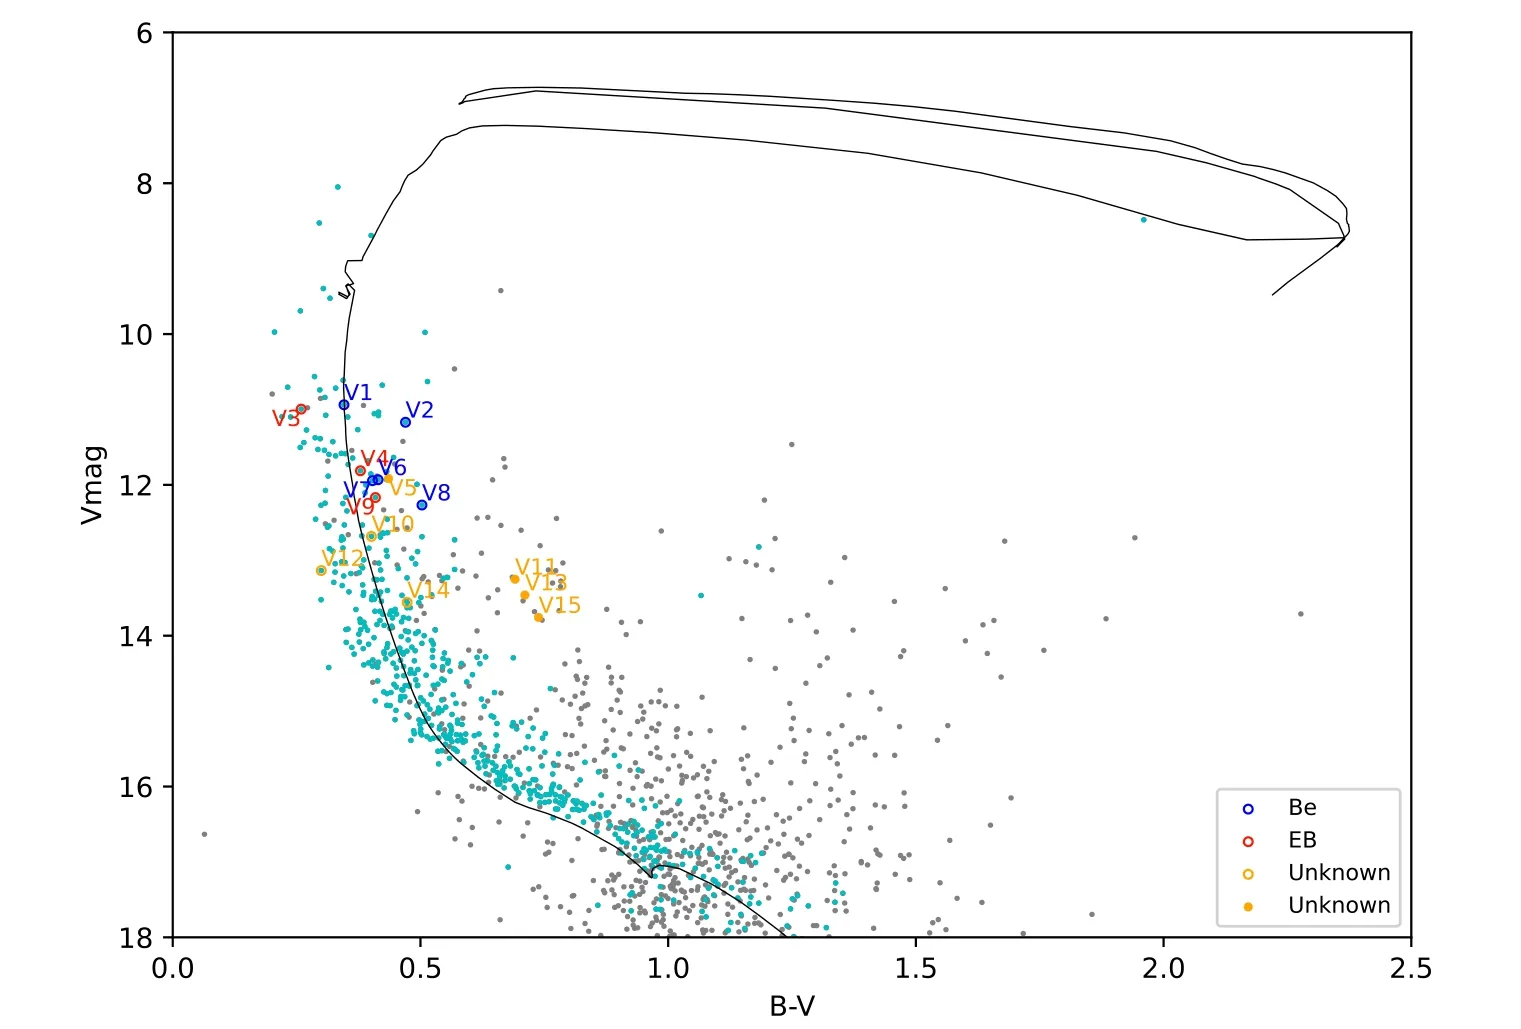
Figure 4.CMD of NGC 884 with the locations of the 15 variables marked.
We plot the temperature versus luminosity(HR)diagram for the 15 variable stars, as shown in Figure 5.The yellow and cyan dashed lines represent the theoretical instability strips of β Cephei and slowly pulsating B(SPB)(Miglio et al.2007),and the black and green dashed lines represent the theoretical instability strips of δ Scuti and γ Doradus (Xiong et al.2016).The effective temperatures of the red star symbol in Figure 5 were from Slesnick et al.(2002).The effective temperatures of the blue triangle were calculated based on the empirical relationships provided by Torres (2010).The luminosity was then obtained using the method described by Joshi et al.(2020).
The two new variable stars found in this study are V11 and V13.Although V11 and V13 are close to the δ Scuti and γ Doradus instability strips, they are non-member stars and therefore cannot be associated with any known variable class based only on their locations.However,significant photometric variations can be observed in their light curves.
3.3.Be Stars
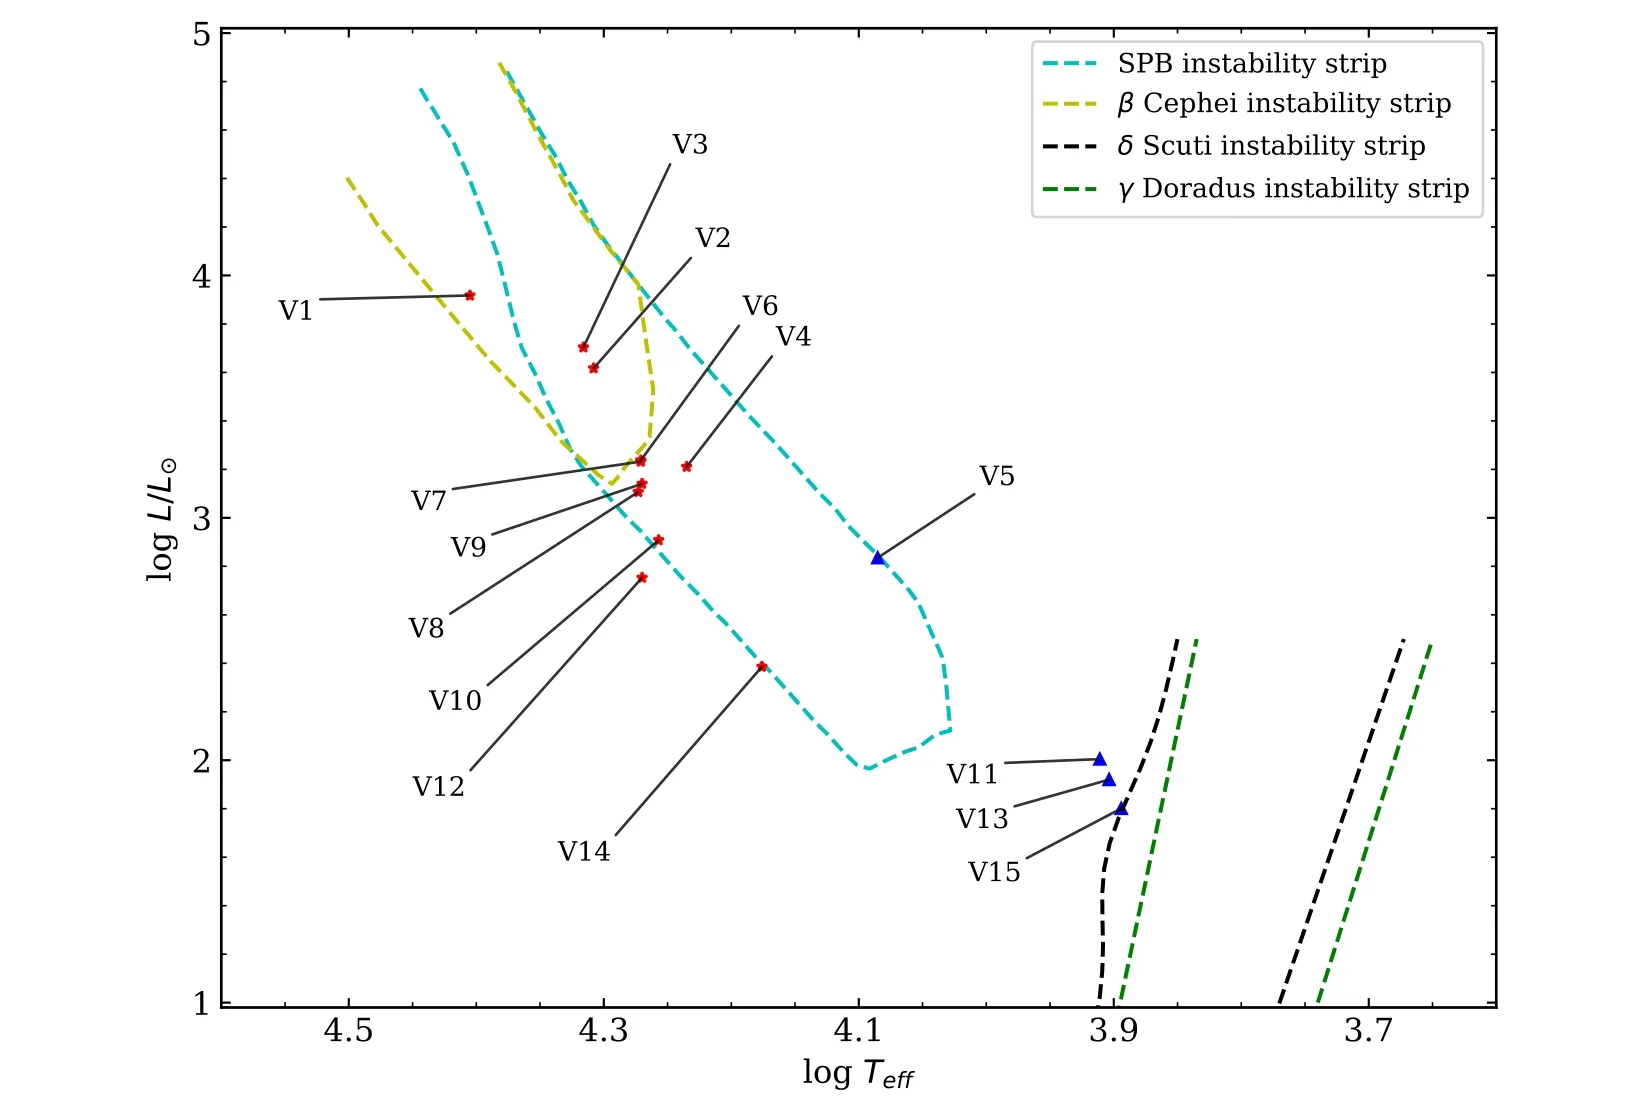
Figure 5.HR diagram of 15 cluster variable stars.The yellow,cyan,black and green dashed lines represent the theoretical instability strips of β Cephei,SPB,δ Scuti and γ Doradus, respectively.
In this work,the toolkit Period04(Lenz&Breger 2005)was used to analyze the frequency of light curves of the variable candidates.Depending on the location in the CMD, the period and light curve morphology, the variable stars V1, V2, V6,V7 and V8 are classified as Be stars (Slettebak 1985; Keller et al.2001; Bragg & Kenyon 2002; Dimitrov et al.2018),which are B-type stars that have one or more Balmer emission lines in their spectra (Collins 1987).We only detected a dominant frequency of f=1.570087 c day-1for V1.V6 was classified as a Be star by Bragg & Kenyon (2002) in their spectroscopic observations with low emission line intensities,and was later classified as a β Cep by Labadie-Bartz et al.(2020) by frequency analysis of the light-curve of known O- and B-type stars, and obtained a major frequency f=4.414700 c day-1.
3.4.Eclipsing Binaries
The variable stars V3, V4, V9 are classified as EBs.An EB system is one in which two stars orbit around a common gravitational center.According to the light-curve shape, EBs can further be divided into EA-type,EB-type and EW-type.For V3, V4 and V9, the International Variable Star Index9http://www.aavso.org/vsx/(VSX)gives the type as EA-type.EA-type (also known as the Algol type),is a type of EB with two detached components.From our time-series photometric data,the period of V3 can be calculated as P = 0.94378 day, which confirms 0.94524 day, as given by VSX.In addition, the period given by Saesen et al.(2010) is 0.95 day.The two variable stars, V4 and V9, whose entire cycle of orbit have not been covered by our mission, although the light-curve minima reveal their type.The period of V4 was determined as 11.61 days by Saesen et al.(2010), which is not specified by VSX.Particular attention is noted for V9, whose period is suggested as 2.7348 days in VSX.However, VSX period for this object is significantly different from the 8.2 days of Saesen et al.(2010).This obvious discrepancy deserves further study.
3.5.Other Variables
Among the other seven variable stars, V5, V11, V13, and V15 are non-member stars and are tentatively classified as unknown types.The frequency of V5 is f = 8.236 c day-1in the study of Saesen et al.(2010), and nine frequencies were extracted in the follow-up study Saesen et al.(2013).The frequencies from our study are f =21.195193 c day-1for V11,f =15.118787 c day-1for V13, and f =29.028512 c day-1for V15.
V10,V12,and V14 are cluster member stars that are located near the SPB instability strips, and could be candidates for further study.Due to the limitation of the data duration, we extracted the frequency fB=5.349821 c day-1in the B band and fV=4.351627 c day-1in the V band for V10.These are slightly different from the two frequencies f1=2.6004 c day-1and f2=5.428900 c day-1of Saesen et al.(2013).The frequency f =3.000267 c day-1of V12 is different from both frequencies f1=1.99999 c day-1and f2=1.858900 c day-1of Saesen et al.(2013).For V14, we extracted the frequency f =2.979968 c day-1which agrees with f =2.974200 c day-1from Saesen et al.(2013).

Figure 6.The position of the 15 tangents in NGC 869 (left) and NGC 884 (right).
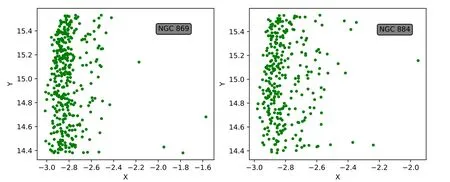
Figure 7.Candidate positions after rotation in NGC 869 (left) and NGC 884 (right).
4.Binary Contents of the Double Clusters
The member stars of the cluster are determined in Section 3.1 and on this basis the ratio of binary stars in the cluster is calculated.In the first step, we selected stars within the range 14 < Gmag < 17 in the CMD as a sub-sample.We divided Gmag into 15 equal bins, and determined the highest density point in each bin in order to fit a curve using least squares, such that we defined the main sequence (MS) ridge line.When limited to the sub-sample,the MS ridge is almost a straight line.In order to find out the binary content, it is better to built a new coordinate system using the MS ridge line as the Y-axis (pseudo magnitude), and define the direction perpendicular to the averaged direction of MS ridge line as the X-axis (pseudo color).To define the Y-axis, we calculated the average tangents of the 15 bins, as well as found the angle of the average tangents with respect to the current coordinate system.Figure 6 shows the positions of the 15 tangents in NGC 869 (left) and NGC 884 (right).Subsequently, the stars in the sub-sample were then converted into the new coordinate system(Figure 7).The histogram of all targets in pseudo color is created,so that the binary ratio can be calculated,using a bin size of 0.05 mag (Figure 8).
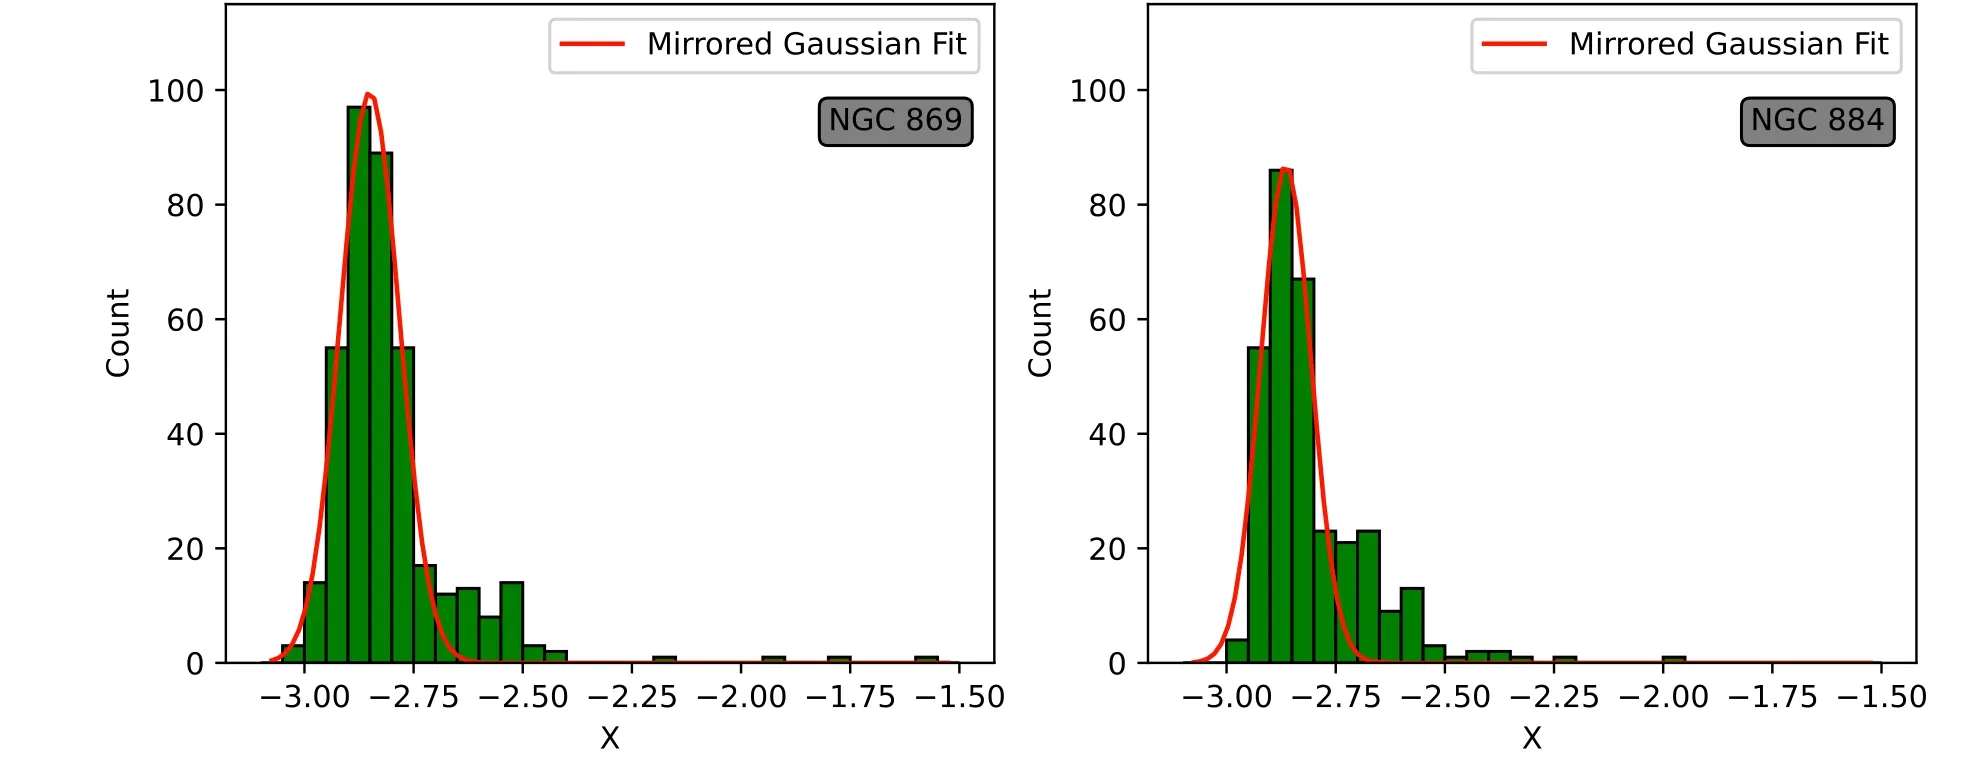
Figure 8.Rotation point histograms of NGC 869 (left) and NGC 884 (right).The red curve is a Monte Carlo simulation curve.
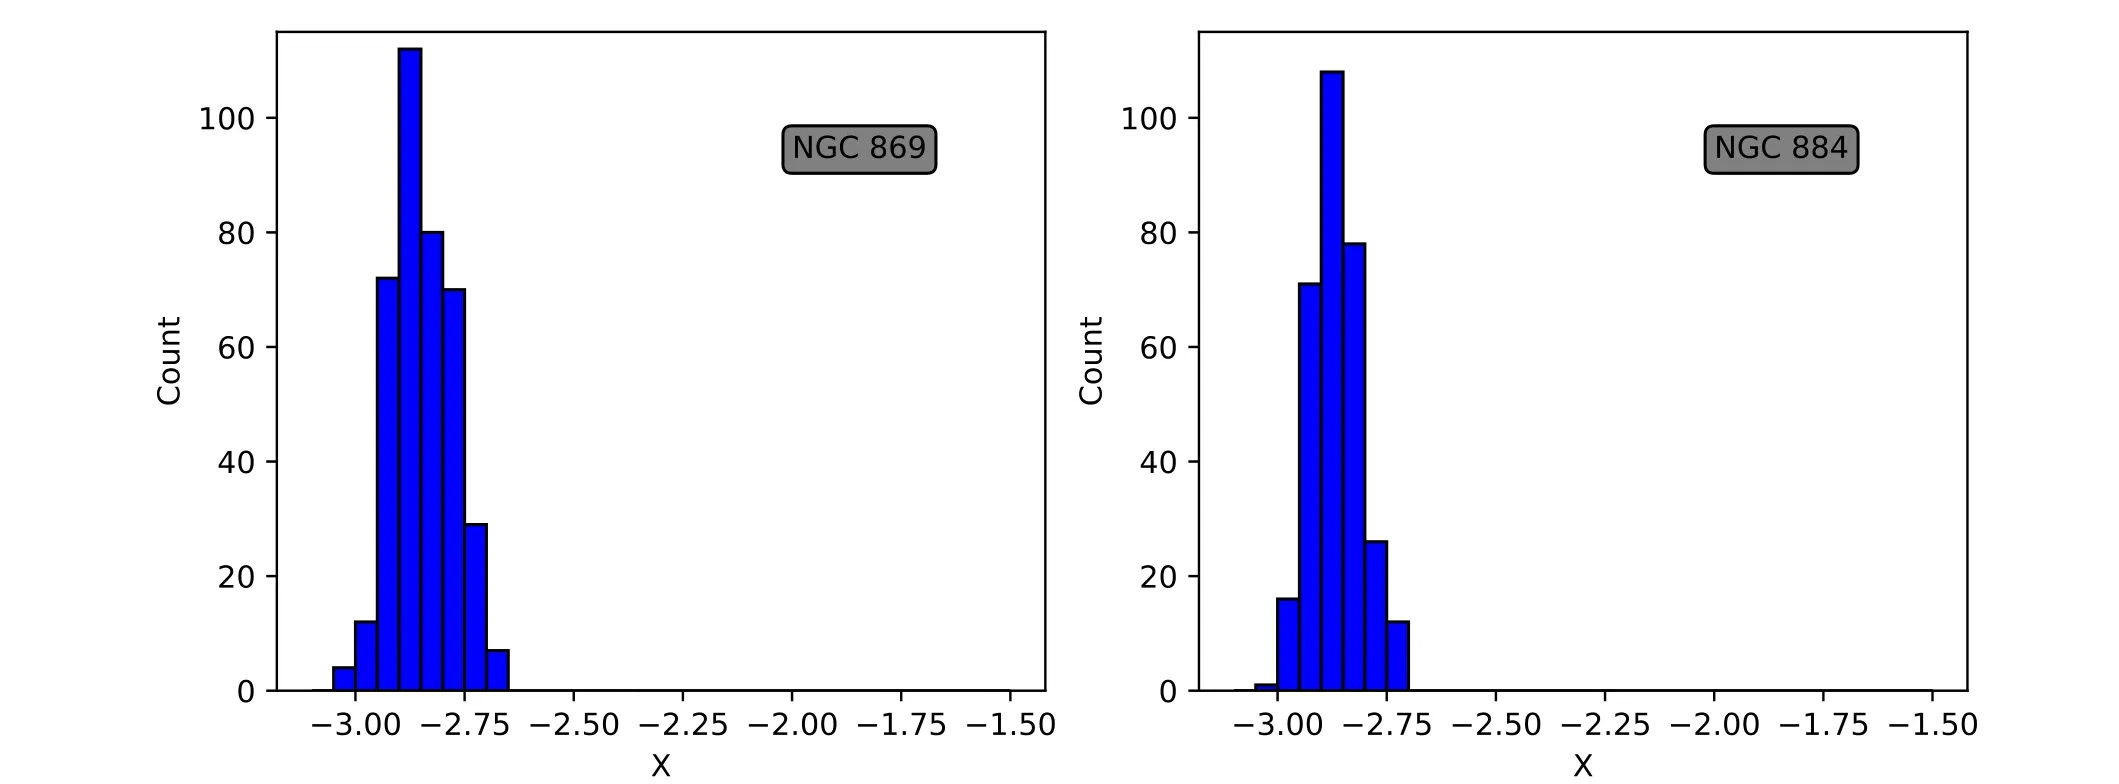
Figure 9.Monte Carlo simulation of single stars in NGC 869 (left) and NGC 884 (right).
The scatter of stars in Figure 8 has two sources, one is the photometric error and the other is that the stars have invisible companions (binary).In the pseudo color–pseudo magnitude diagram,the peak of the distribution denotes the MS ridge.It is clear that there is no binary on the left side of the MS ridge,therefore stars in the MS ridge are all single stars with random photometric error.Whereas on the right side of the MS ridge,we find both single stars with photometric error and binary stars also baring such errors.Then,we fit the first four bins(up to the MS ridge) with a Gaussian curve to draw mirror curves, and this should account for all single stars.The binary content can be calculated using Monte Carlo simulations to fit two Gaussians for the two components of singles and binaries.The histograms of simulated single stars are shown in Figure 9 for the two clusters.
Finally, we subtracted the corresponding bin in Figure 9 from the corresponding bin in Figure 8 for NGC 869(left)and NGC 884 (right), and obtained the histograms as shown in Figure 10.To compare the photometric of binary component and single stars,we show the photometric of single stars in the blue histogram in Figure 10.The red curve in Figure 10 is the Gaussian fitting curve.By calculating the corresponding area below the curve, the binary ratio of the clusters can be calculated.As a result, the binary star ratio is less than 0.122 for NGC 869 and less than 0.192 for NGC 884.
5.Summary and Discussion
This is the third paper on the study of variable stars in open clusters.NGC 884, one of the young OCs in the well known Perseus double cluster, was intensively observed over 14 clear nights in 2016 November using the 50BiN telescope.B and V Johnson-Cousin filters were used during the observations,providing more than 17,000 images for both passbands.Based on the catalog of differential photometry, we carried out a search for variable stars in the same way as our previous work on NGC 2301(Wang et al.2015)and for the other member of Perseus double cluster NGC 869 (Zhuo et al.2021).
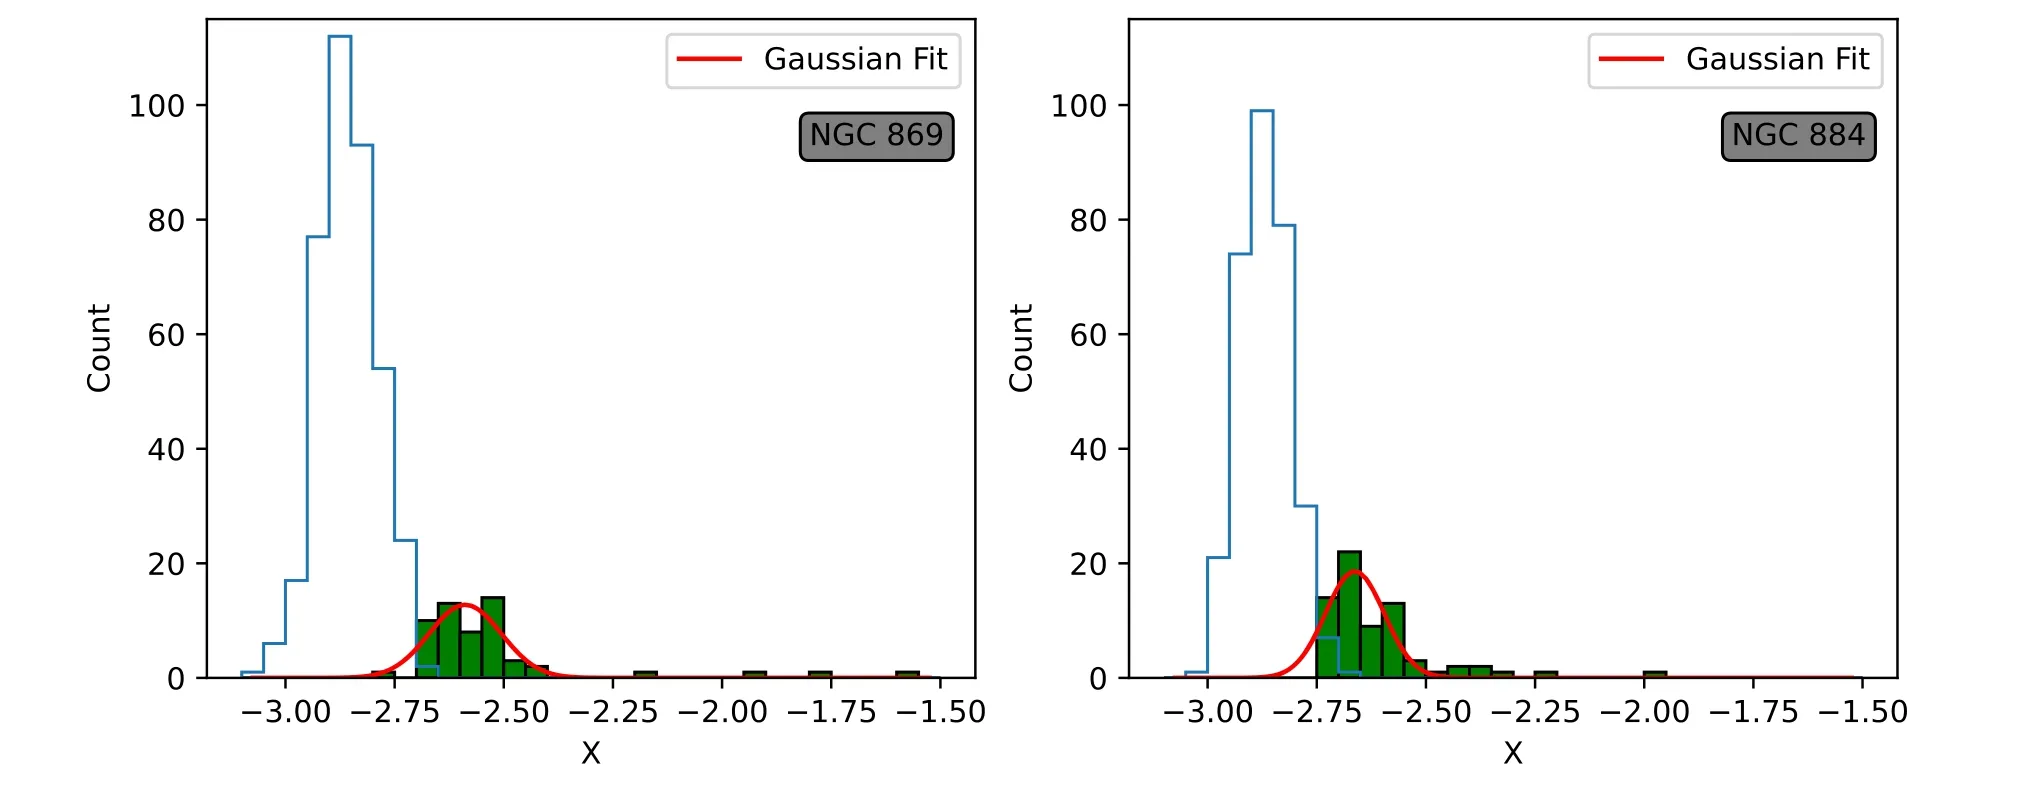
Figure 10.Green histogram of the difference between Figure 8 and Figure 9(NGC 869(left)and NGC 884(right)).Blue histogram is Figure 9.The red curve in the figure is a Gaussian fitting curve.
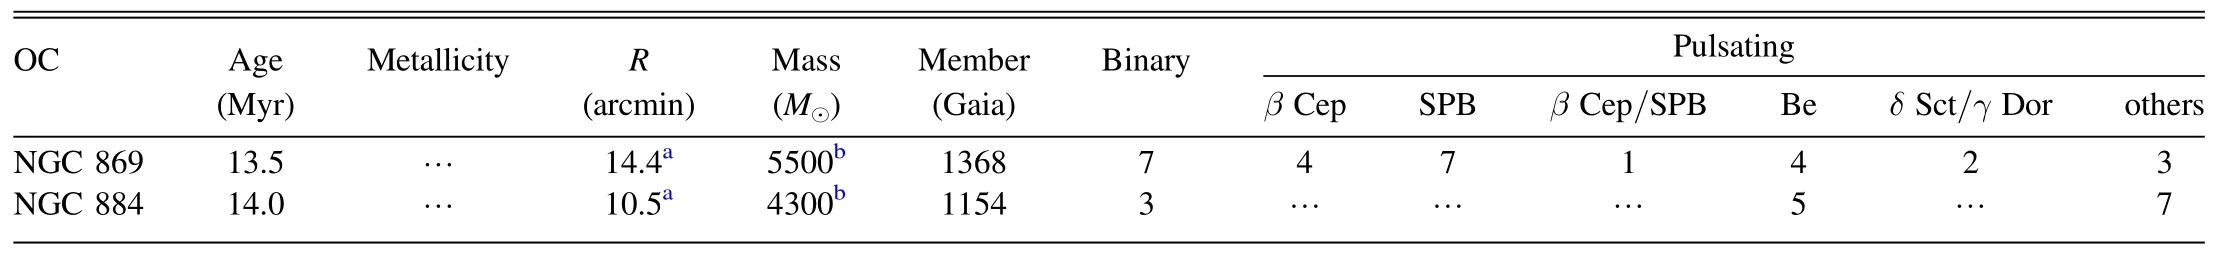
Table 3 The Comparison of NGC 884 and NGC 869
This major find of the current work is summarized in the following:
1.By using the technique of differential photometry, we detected 15 variable stars in the FOV of ′ × ′20 20.According to the constraints on the properties of proper motions and parallax, V1–V4,V6–10,V12,and V14 are cluster member stars, while V5, V11, V13, and V15 are field stars.
2.The two stars, V11 and V13 are newly discovered.
3.The V7 light curves show similar features to the EB light curves, which can be further investigated.
4.The binary star ratio is less than 0.122 for NGC 869 and less than 0.192 for NGC 884.
Compared to NGC 869,the companion cluster NGC 884 has a very different variable star content.Table 3 shows the comparison of variable stars between NGC 869 and NGC 884.The double clusters are dynamically bound together and have the same physical properties including age and metallicity.It is very likely that these two clusters have a common origin and are co-evolving in terms of dynamics.The difference in variable star contents, especially in binary systems, infers that the system may have undergone dynamical interactions that have modified the stellar contents in both clusters (Bidelman 1943; Pišmiš 1953; Vogt 1971).Further studies on the issue of stellar components in both clusters in connection with dynamical co-evolution of this unique double cluster system will be needed.
Acknowledgments
The constant support is from the National Natural Science Foundation of China (NSFC) through grants 12003022,12373035, 12233009 and 12173047.X.C.acknowledges support from the Youth Innovation Promotion Association of the CAS(grant No.2022055).This work presents results from the European Space Agency (ESA) space mission Gaia.Gaia data are being processed by the Gaia Data Processing and Analysis Consortium (DPAC).Funding for the DPAC is provided by national institutions, in particular the institutions participating in the Gaia MultiLateral Agreement (MLA).The Gaia mission website is https://www.cosmos.esa.int/gaia.The Gaia archive website is https://archives.esac.esa.int/gaia.The authors thank colleagues from Qinghai observing station of Purple Mountain Observatory for support during the running of the current project.
ORCID iDs
Xiao-Dian Chen https://orcid.org/0000-0001-7084-0484
Li-Cai Deng https://orcid.org/0000-0001-9073-9914
 Research in Astronomy and Astrophysics2024年2期
- Research in Astronomy and Astrophysics的其它文章
- A Fermi-LAT Study of Globular Cluster Dynamical Evolution in the Milky Way: Millisecond Pulsars as the Probe
- Application of Regularization Methods in the Sky Map Reconstruction of the Tianlai Cylinder Pathfinder Array
- Effect of Cosmic Plasma on the Observation of Supernovae Ia
- Free Energy of Anisotropic Strangeon Stars
- Data-driven Simulations of Magnetic Field Evolution in Active Region 11429:Magneto-frictional Method Using PENCIL CODE
- The Clumpy Structure of Five Star-bursting Dwarf Galaxies in the MaNGA Survey