
Adaptive interaction driven by the learning effect in the spatial prisoner’s dilemma
2024-03-25 09:32JiaqiLi李佳奇JianleiZhang张建磊andQunLiu刘群
Chinese Physics B 2024年3期
Jiaqi Li(李佳奇), Jianlei Zhang(张建磊), and Qun Liu(刘群)
1Institute of Intelligent Information,Hexi University,Gansu 734000,China
2College of Artificial Intelligence,Nankai University,Tianjin 300350,China
Keywords: self-adapting interaction,evolutionary game,mentor,spatial prisoner’s dilemma
1.Introduction
It can be seen from Darwin’s theory of evolution that competition among individuals leads to the evolution of species and that any altruistic behavior will quickly disappear over time.[1,2]However, numerous real-world scenarios deviate from Darwinian theory.For example,the emergence of cooperation is often found in biological systems as well as social systems,especially among animal or human communities.[3-7]To investigate such a curious and confused question, a large number of researchers have devoted themselves to researching the essential reason for cooperation behavior between selfinterested individuals.[8-10]It is worth highlighting that evolutionary game theory is a very effective tool to account for the origin and persistence of cooperation, by using some gametheoretical models of different scenarios.Interestingly, twoplayer-two-strategy game models are widely used to analyze bewilderment,[11-16]especially the prisoner’s dilemma game(PDG),because it reflects the most unfavorable conditions for cooperation.
About three decades ago, scholars often assumed that a population structure is infinite and well-mixed; that is to say,the likelihood of interaction between two arbitrary individuals is the same.However, in a real system, the contact between individuals is neither fully coupled nor completely random.Nowak and May published a seminal work describing network reciprocity[17,18]and demonstrated that a two-dimensional square lattice can effectively support cooperation in the PDG.Along this research line, some research works have focused on different topologies,including the famous small-world network and one with a scale-free feature.[19,20]Furthermore,some social factors, such as reward and punishment,[21,22]reputation,[23-26]aspiration,[27]tolerance,[28]teaching activity,[29]rationality,[30,31]memory,[32-34]and emotion,[35]have been investigated in the spatial structure.In recent years,many scholars set about studying the reaction of evolutionary game dynamics to networks, especially involving restructuring partnerships[36]and migration.[37]Additionally,the cooperative dynamics of multi-layer networks have also attracted extensive attention.[38-40]
In most of the works described above,scholars generally assumed that individuals undoubtedly interact with their respective neighbors.However,real life tells us that individuals do not always have positive contact with their neighbors and discontinuous contact is more consistent with real situations.In view of this,some scholars put forward various random interaction mechanisms to study the cooperative dynamics in a structured population.[8,41,42]In brief, all these works enrich the knowledge of cooperative dynamics in more realistic environments.Despite this,it should be pointed out that the interaction desire between selfish individuals is not symmetrical and an individual’s interaction desire with his mentor should be closely related to the mentor’s influence on him.Inspired by these factors,we study the cooperative dynamics in a network by adaptively adjusting the interaction intensity with mentors.
The remainder of this article is organized as follows.In Section 2,we briefly introduce related background knowledge,including the networked population structure and the spatial PDG, as well as the constraint interaction condition between individuals.Section 3 describes our model in detail.The results are arranged in Section 4, and Section 5 gives our conclusions.
2.Related knowledge
2.1.Population structure and the spatial PDG
We first introduce population structure and the spatial PDG.Nodes and edges on the network represent the individuals and the interactive relationship between individuals, respectively.Next,we attach a reversible direction to each edge and the weights in the direction denote the strength of interaction with each other(the probability of interaction).For example, for two arbitrary individuals (sayxandy) who have a paired relationship on the network,xwill willingly interact with his partneryby the unilateral interaction strengthWx⇀y,andywill do that withxby the corresponding interaction strengthWy⇀x.Under such a framework,only when both parties successfully send interaction intentions to an opponent can they participate in the game.Furthermore,we use two unit vectors to represent the strategies that the individual is likely to choose(cooperation strategy C and defection strategy D are represented bySx(t)=[1,0]TandSx(t)=[0,1]T,respectively).Generally,the two-player-two-strategy social dilemma models are described by the payoff matrix[17,43]
In Eq.(1), mutual cooperation and mutual defection result in the payoffsRandP,respectively.However,when the cooperator encounters the defector, the former obtains the payoffS,while the latter getsT.For the PDG, these payoffs obey the rankingT >R >P >Sand satisfy the constraint 2R >T+S.For simplicity, we setT=b,R=1, andP=S=0, where the parameterb(1<b <2)represents the temptation value of betrayal.
2.2.Interaction condition
According to context,the constraint interaction condition betweenxand his neighboryat timetstep is described by
In Eq.(2),Ix,y(t) denotes the logical outcome of whether or not there is a successful interaction;Ex⇀ydenotes the event that individualxsuccessfully transmits the interaction intention withWx⇀yto his neighbory.Where,the term for successful transmission (hereinafter, abbreviated as success) meansyreceives the interaction signal that comes fromx.Obviously, the probability thatyreceives the signal will be gradually increased with the increasing value ofWx⇀y.In addition,if the signal is successfully transmitted, the logical result of the eventEx⇀yis equal to“1”; otherwise it is“0”.Similarly,eventEy⇀xhas the same meanings asEx⇀y,that is,
Only when the two independent interaction events both occur at the same time can they (xandy) participate in the game.
3.Model
There are three stages in each round of the game: interaction,modification of interaction strength and strategic learning.
First,each individual(sayx)interacts with his neighbors simultaneously with the same strategy and the corresponding interaction strength and calculates his accumulated earning in the current round
where the symbolNxdenotesx’s neighbor set.
Next,it is necessary to define two basic concepts to facilitate description of the revision rule of the interaction intensity.
Definition 1 (mentor) If individualxsuccessfully learns the previous strategySy(t-1) of his neighbory, thenywill be regarded asx’s mentor at present.In addition,x’s mentor is likely to be constantly replaced as the system evolves.
Definition 2 (reference payoff) We treat the cumulative payoffπx(t-1) of individualx, which is the one he has obtained in the previous round,as his reference payoff at timetstep.
Entering the second stage after interaction, the individualxis likely to spontaneously adjust the interaction intensity from himself to his mentor(sayy)according to the difference betweenx’s cumulative payoff and reference payoff, and the regulated result will be regarded as the interaction intensity from himself toyin the next round
where parameterδ(0≤δ ≤1) represents the driving coefficient of interaction intensity,which means the speed of change of interaction intensity.Whenδ=0, the intensity of interaction between individuals is invariably decided by initialization.Whenδ >0, the interactive relationship between individuals is going to change continuously with time and it becomes faster and faster with the gradual increase of the driving coefficient.In addition,the modified increment of the interactive relationship is determined by the hyperbolic tangent function, because this kind of function can vividly depict the dynamic change of an interpersonal relationship.According to the context,whenx’s cumulative income obtained by imitating the strategy of his mentoryis more than the reference payoff[πx(t)>πx(t-1)],xis satisfied and he will enhance the interaction withy.Conversely,xis dissatisfied withyin cases ofπx(t)<πx(t-1)and he will weaken the interaction.Especially,Wx⇀y(t+1)=Wx⇀y(t)when the difference is equal to 0.
Finally, it is necessary for every individual to learn from his neighbor in order to get a higher payoff in the next round.We adopt the widely used Fermi function for the updating rule of an individual strategy.[44]Namely,an individualxpicks one of his neighbors(sayy)at random and whetherycan act asx’s new mentor depends on the probability
HereKrepresents the noise intensity(K ≥0)involved in the strategy-updating process.In this article,we principally study how the driving coefficientδof the interaction intensity affects the evolution of cooperation in the spatial PDG.
4.Results
Experiments are carried out on a two-dimensional square lattice.Different from the previous networked population,we use a directed and weighted network ofN×Nsize to describe the population structure.Initially, the value of the unidirectional interaction strength is evenly distributed between 0 and 1.It should be noted that owing to the dynamic changes within the system, the interaction strength may exhibit unusual phenomena, such as values that are either less than or equal to zero or greater than one.To avoid the occurrence of these anomalies,we control the amplitude of unidirectional interaction strength between 0 and 1.In addition,each individual on the network is stochastically initialized as either C or D with an equal probability of 0.5.To obtain the density of cooperationρcduring the steady-state operation of system, we compute the value ofρcby averaging the lastmrounds of the wholeTrounds and each data point is plotted in the following figures as the average value forntimes independent experiments.
4.1.Influence of the temptation value
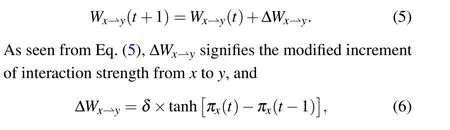
We first investigate the density of cooperationρcas a function of the temptation valuebfor different driving coefficientδ, as shown in Fig.1.As can be seen from Fig.1(a),different from the effect of a spatial game under fixed interaction strength(δ=0),ρcis significantly enhanced and cooperators can even attain the absolute superiority of dominating the whole population when considering the self-adapting interaction driven by the learning effect (δ >0).More specifically,whenδ=0.1, the density of cooperation is obviously higher than that for the conventional mode (δ=0) and the density of cooperation increases with increasingδ.Moreover, whenδ=0.1, the critical value for the disappearance of cooperation,bcr, increases to 1.075.In contrast, it is only close to 1.045 for the conventional mode.Subsequently,bcris gradually enhanced with the increase ofδ.
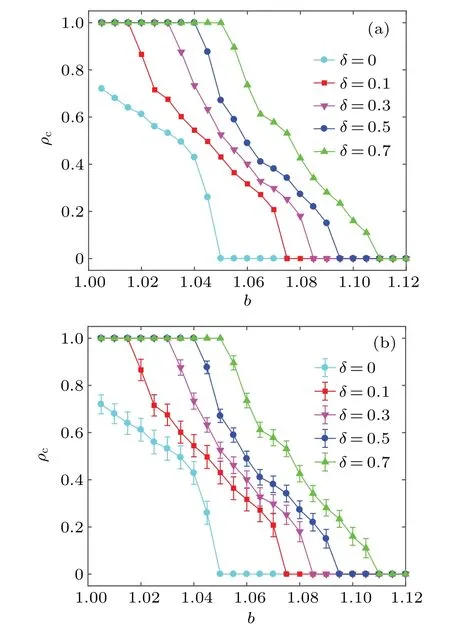
Fig.1.Density of cooperation ρc as a function of the temptation value b for different driving coefficient δ.(a)The results obtained by simulations; (b) the error bar of each data point.The evolutionary PDG is performed on a 100×100 directed and weighted square lattice.As can be seen from panel (a), compared with the traditional mode (δ =0),density of cooperation is significantly enhanced and cooperators can even attain the absolute superiority of dominating the whole population when considering the self-adapting interaction driven by the learning effect(δ >0).Some other relevant parameters: K=0.1,m=2×10³,T =104 (even 105)and n=100.
In addition, we survey the extent to which the density of cooperation obtained in each experiment deviates from the mean value of density of cooperation obtained in multiple experiments (see Fig.1(b)).The calculation method of error quantityτis as follows:
In Eq.(8),ρcdenotes the density of cooperation,which is the average value obtained byntimes independent experiments;the signalρi(i=1,2,...,n) represents the density of cooperation obtained in each experiment.According to statistics,although there are deviations betweenρiandρc(0<ρc<1),the length of the error bar for each data point is fairly small.For example, whenδ=0.3 andb=1.05, the value ofτis roughly equal to 0.03, which means that the result obtained through each experiment is almost always around the mean value.In brief, these data points in Fig.1 perfectly represent the relationship betweenρcandbfor different values ofδ.
It is worth noting that the above results are obtained under the assumption that the noise intensityKis set to 0.1,[45,46]but it is just a special case.Therefore,it is necessary to investigate if cooperation densityρcis affected by the temptation valuebfor different values ofK.After experiments,we find that it is more conducive to cooperation when the noise intensity is controlled within a certain range.Specifically speaking,for a fixed value ofb, whenK=0, all cooperators are wiped out by defectors(ρc=0);nevertheless,ρcwill rise rapidly as long as the value ofKis increased slowly.Unfortunately,once the value ofKexceeds 1.8,ρcwill begin to decrease asKcontinues to increase.Furthermore, the extinction threshold of cooperation(bcr)is also gradually enhanced with the increase ofK(0≤K ≤1.8).These phenomena indicate that cooperation will be inhibited when the noise is too low or too high,while the appropriate noise intensity is beneficial to cooperation.
4.2.Role of the driving coefficient
To accurately quantify the effects of self-adapting interaction driven by learning on cooperation,we study the relationship between the density of cooperation and the driving coefficient for different temptation values,as shown in Fig.2.Obviously,for each fixed value ofb,we can observe that the density of cooperation increases monotonously with an increasing value ofδ.Interestingly, for each small or moderate temptation value (such asb= 1.02 andb= 1.05), we notice that the cooperators have the absolute advantage of being able to dominate the whole population as long asδexceeds a critical threshold.That is,in this social dilemma,there is a small driving coefficientδminthat can make all individuals in the population reach the saturation state of cooperation.However,for a large temptation value (such asb=1.08), although cooperators do not have the advantage of dominating the whole population, there is still a small driving coefficientδminthat can provide a moderate environment for the survival of cooperators.More clearly,
Similarly, we also check the error bars of the above data points (see Fig.2(a)).As you can see, the length of the error bar for each data point is small.Just like the meaning expressed earlier for the error bar, the shorter the error bar,the smaller the difference between the density of cooperation obtained from per experiment and the mean.Curiously, the length of the error bar gradually decreases with increasing the driving coefficientδfor a fixedb.We believe that the reason for this phenomenon is that the randomness of interactions between individuals decreases asδincreases.We further consider the effect of noise intensityKon the density of cooperationρc.The results show that the appropriate noise can also improve the cooperation in the population and the value ofδmindecreases with the increase of noise in a certain range of noise.
Fig.2.The relationship between the density of cooperation ρc and the driving coefficient δ for different temptation values.(a) The results and the corresponding error bar.(b)The contrast between the theoretical analysis result and numerical simulation result.Obviously,for each fixed value of b, there is the smallest driving coefficient δmin which can provide the moderate environment for the spread of cooperative behavior.Furthermore,the results are basically coincident between theoretical analysis(bt)by the extended pair approximation and numerical simulation(bs),although there are some subtle differences.Some other relevant parameters: N =100, K =0.1, m=2×10³, T =104 (even 105)and n=100.
The following is an extension of the pair-approximation method[47]and we apply it to confirm the numerical simulation results showing that the density of cooperation changes with the driving coefficient.In Fig.3,we randomly choose an individual whose strategy isxto learn strategy by comparing his accumulated payoff with a randomly chosen partner with strategyy.herenc(y1,y2,y3) represent the number of cooperators in the neighborsy1,y2,y3.Likewise,we can also imagine that ifyis a defector andxis a cooperator,then the accumulated income of the defector for different configurations is

Fig.3.Concentrating on the pairwise two individuals with strategy x and strategy y on the directed and weighted square lattice shows the relevant configuration for the extended pair approximation.The change of pair configuration probabilities px,y→y,y can be determined based on this structure.For clarity,we only write the value of the unilateral interaction intensity(Wx⇀y and Wy⇀x)between x and y.
Obviously, the common factor 2pc,d/(p3cp3d) has been omitted in Eqs.(14) and (15).Even so, the equilibrium of system remains unaffected because the common factor only serves as nonlinear transformations in timescale.
Subsequently, combining the symmetry propertypd,c=pc,dand the constraint conditionpc,c+pd,c+pc,d+pd,d=1,we can obtain the density of cooperation in the populationρc=pc,c+pc,d.
As can be seen from Fig.2(b), the results are basically coincident between theoretical analysis by the extended pair approximation and numerical simulation, although there are some subtle differences.However, we think that the differences between them may be because we do not consider the effect of spatial clusters in the extended pair approximation method, especially the cooperative cluster.Despite this fact,our extension method also successfully verifies the simulation results and qualitatively reflects the role of self-adapting interaction driven by learning.
4.3.Dynamics analysis
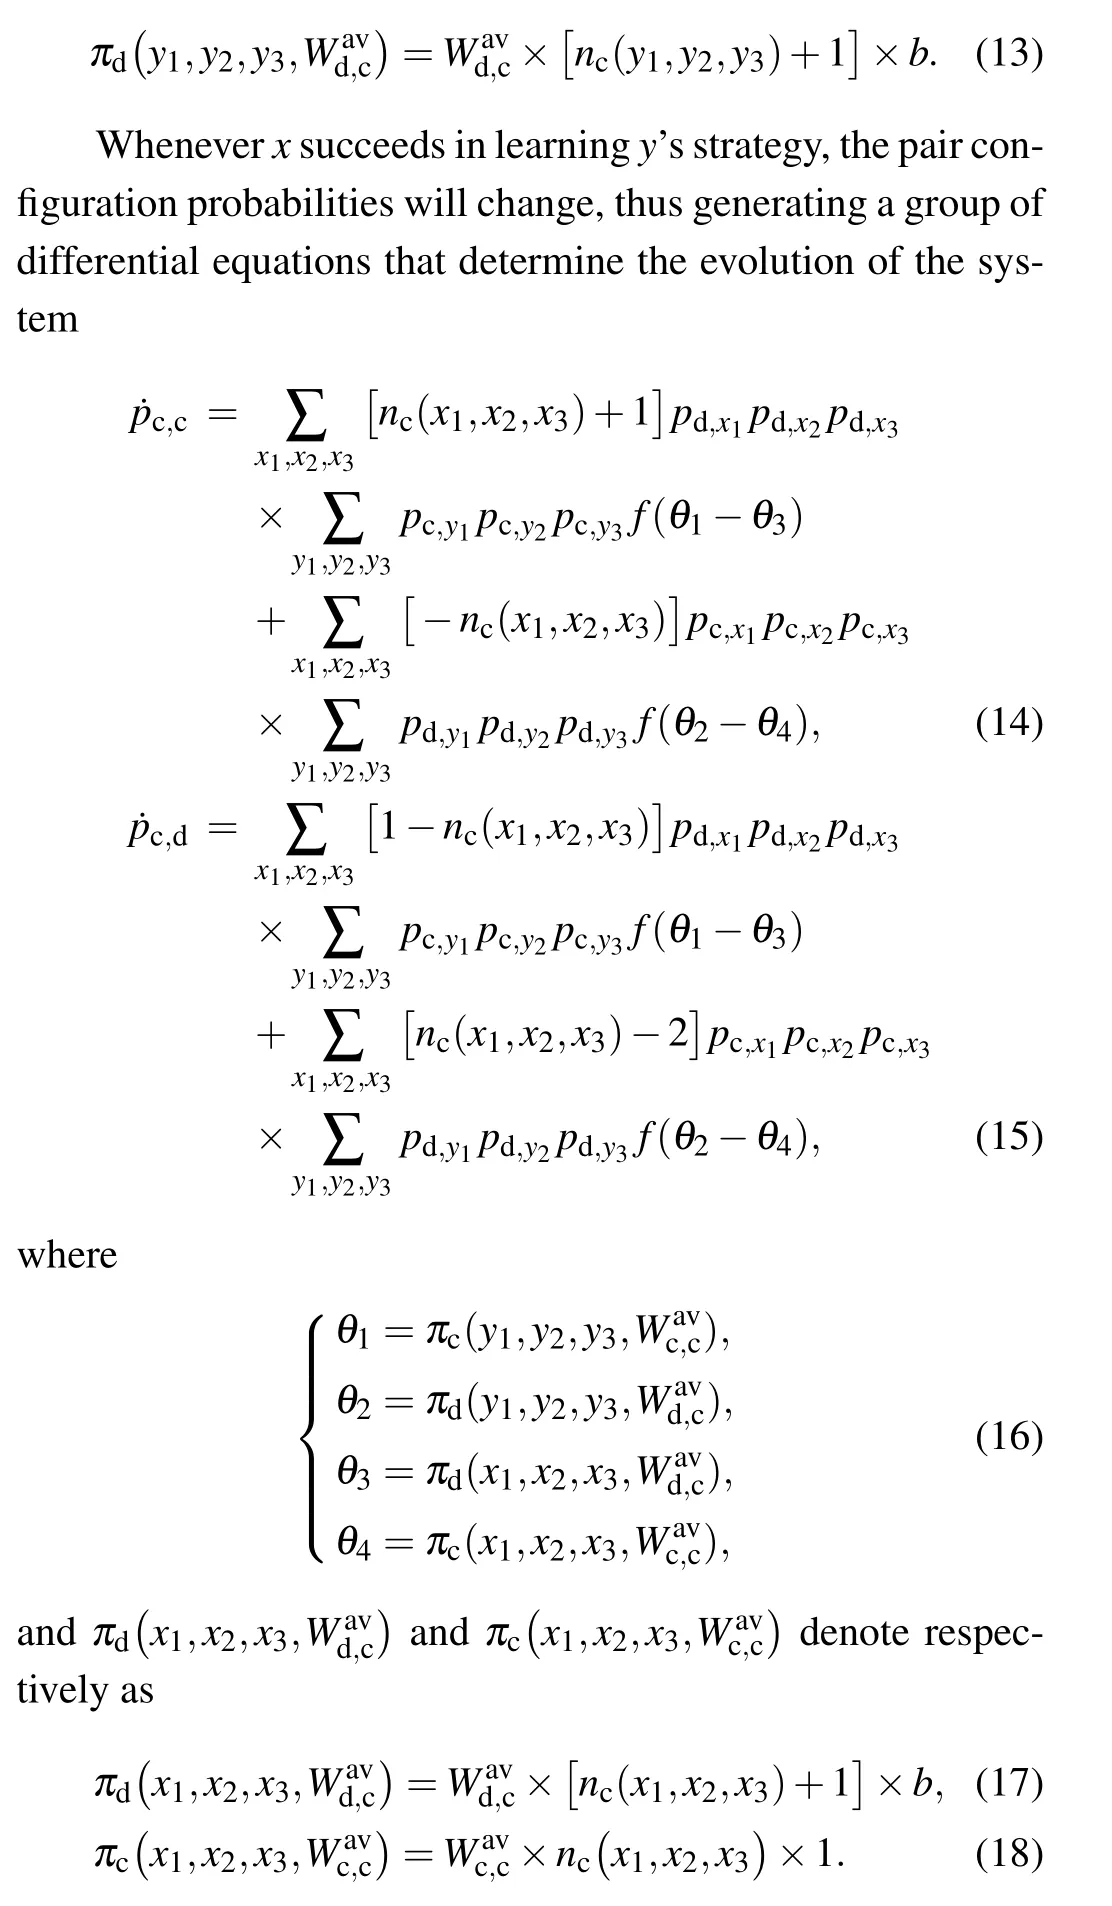
Next, we collect some typical evolution snapshots of individuals on the network to improve our comprehension of the mechanism of adaptive interaction driven by the learning effect, as shown in Fig.4.To visualize different states of individuals at each time step,we adopt several colors to represent individual behavior.Wine, dark green and blue represent the old cooperators, the old defectors and the isolators, respectively.Correspondingly, red and green denote the new cooperators (from other states to cooperation) and the new defectors(from other states to betrayal), respectively.We can also judge the equilibrium state of the system from the perspective of evolution snapshots by setting an individual’s color in this way.For example,when the proportion of the new cooperators is almost equal to that of the new defectors in the population,we can consider that the system probably arrives at the equilibrium state.
Fig.4.Some typical evolution snapshots of an individual’s states on a square lattice for a moderate level of temptation (b=1.05) and an appropriate driving coefficient (δ =0.6) at several representative time steps.Wine, dark green and blue represent the old cooperators, the old defectors and the isolators, respectively.Correspondingly, red and green denote the new cooperators (from other individual states to cooperation)and the new defectors(from other individual states to betrayal),respectively.From(a)to(j),the collected time steps are 0,1,20,50,100,200,300,500,1000 and 3000,respectively.Other relevant arguments: N=100,K=0.1.
Before the system runs,each individual in the population is defined as a cooperator(red)or a defector(green)with the fixed probability 0.5,so the network is evenly filled with two different types of individuals (Fig.4(a)).Nevertheless, once the system is up and running,about 33%of the individuals are at high risk of losing contact with their neighbors and they exist evenly in the population as isolators (blue) owing to very weak interactions that are decided by initialization(Fig.4(b)).It should be noted that we consider cooperators and defectors,whether in Fig.4(a)or in Fig.4(b),as the neonatal state in the corresponding time step.Therefore,we still use red and green to represent cooperators and defectors,respectively.In the first stage of system operation,the vast majority of individuals tend to choose the betrayal strategy in order to satisfy their own desires.In such an environment filled with selfishness,defection clusters (denoted byΩD) quickly form through the constant gathering of defectors.Unfortunately,some of the traitors located withinΩDwill be quarantined,which is a heavy price to pay for selfish interests at the expense of friendship.Despite that, there are still a few loyal collaborators who survive by forming close alliances (called cooperative clusters, denoted byΩC)(Fig.4(c)).The scale ofΩCin the initial stage of system evolution is noteworthy.As can be seen from Fig.4(c),when the system evolves to the end of the primary stage, not only is the number ofΩCsmall,but also their respective sizes are also small.However, for eachΩC, the partnership between individuals is very friendly because an individual (sayx) is likely to be satisfied with his current cumulative returns[πx(t)>πx(t-1)] by studying its cooperative neighbor (sayy).This leads to an increase of interaction intensity with his partnery.The more rounds of successful learning there are,the higher the frequency of interaction and the richer the individualxbecomes.Furthermore, with the increasing prosperity of individuals withinΩC, the surrounding cooperators are also getting richer.In contrast,a relatively static scene appears within eachΩDbecause the defectors will gain nothing from their interactions.In other words, within eachΩD, the interactive relation between individuals does not change over time.In this way,the unsuccessful defection group cannot bring any benefit to any of its members, including those individuals on the border.In such circumstances,opportunistic betrayers located at the boundary ofΩDeasily become cooperators by learning from their relatively affluent cooperation neighbors.Soon afterwards,the less cohesiveΩDcan be easily gradually destroyed by close-knitΩC.In addition,the cooperators never stop fulfilling the obligation of rescuing loners.Therefore,the scale ofΩCis gradually expanded as time passes (from Fig.4(d) to Fig.4(f)).Surprisingly, the size ofΩCdoes not always increase as the system further evolves.To be specific,at aboutt=300, the cooperators become almost absolutely dominant in the population because they form huge,interconnected slices through alliances (Fig.4(g)).However, this favorable situation is only temporary and is closely followed by a very different scene.The defectors renew their attack on the cooperators,which causesΩCto shrink gradually in size,while theΩDswells gradually(Fig.4(h)).After a fierce confrontation between collaborators and defectors,the proportion of neonatal cooperators is almost equal to that of the neonatal defectors (from Fig.4(i) to Fig.4(j)), which means that the system has entered a stable state.
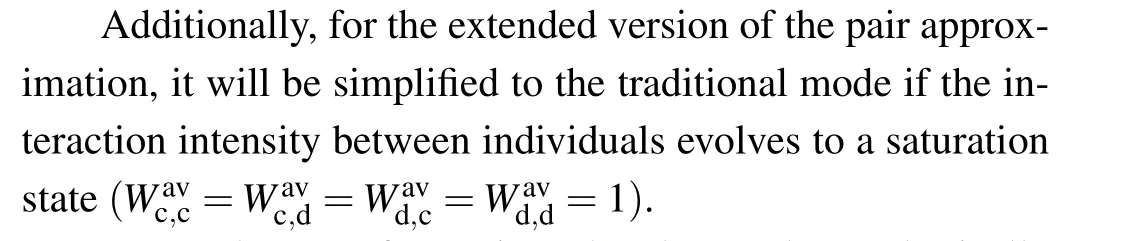
In the following, we will explain more clearly the dynamics of the evolution of these typical snapshots by looking at the average payoff (AP) of individuals with different types,as shown in Fig.5.As shown in Fig.5(a),although the fact that the AP of cooperators(denoted byAPc)is almost always less than that of defectors (denoted byAPd) during the primary stage (t <100), the difference between them gradually decrease over time.In other words,the probability that C learns from D(f[πC(t)-πD(t)])is almost always higher than the probability that D learns from C (f[πD(t)-πC(t)]) during this period,but the probability of a mutual switch between C and D is getting gradually closer.This meansΩCcan be formed gradually during the initial phase of the system.Owing to the fact thatΩCcan enhance the competitiveness of their circumjacent cooperators,the exploitation of collaborators by traitors will be effectively restrained.Furthermore, with the gradual enhancement of circumjacent cooperators’ competitiveness, they will have more and more opportunities to win over isolators.Therefore, throughout the process of system evolution beforet=100, the density of cooperation changes from a gradual decline at the beginning to a gradual rise later[see Fig.5(b)].However, once the value ofAPcexceeds that ofAPd(t >100), the density of cooperation will rise rapidly and gradually reach the uppermost point(aboutt=300),then quickly fall.For this phenomenon,in our opinion,asΩCgradually grows in size, the number of defectors around theΩCperhaps is getting less and less.However,the fighting capacity of those defectors is getting stronger and stronger because defectors are probably interacting with more and more cooperators and getting higher and higher payoffs.Unfortunately,the strong counterattack of the betrayers does not achieve great success,although it strikes at the cooperators’absolute dominance over the population.After a period of intense struggle between collaborators and defectors,the system reaches a state of relative equilibrium(t >2000).Note that because isolators are constantly being rescued by cooperators and defectors,the final scenario of system evolution is mainly the coexistence of cooperators and betrayers.
Fig.5.Dynamic analysis of typical snapshots by looking at the average payoff (AP) of different types of individuals.As can be seen from panel(a),although the fact that the AP of cooperators(APc)almost always is less than the one of defectors(APd)in the beginning,before long,APc not only succeeds in catching up with APd, but also surpasses it.With the further evolution of the system, APc begins to descend until it arrives at the same level with APd.Naturally, the density of cooperation ρc (see panel (b)) accordingly follows the trajectory from an initial decline to a gradual increase and then to a steady amplitude.Other relevant parameters: N=100,K=0.1,b=1.05,δ =0.6,and T =104.
Definition 3 (effective neighbor) The adaptive interaction mechanism can be divided into two processes,one is that an individual adaptively selects some neighbors as his interaction objects according to the corresponding interaction intensity,the other is that a game relationship occurs with mutually selected individuals.In doing so,an individual is likely to interact successfully with only some of his neighbors.We treat the partner who actually interacts with individualxas the effective neighbor ofx.
Based on the context, we can easily analyze the evolutionary dynamics of interaction intensity.As we know, the interaction intensity between an individualxand its neighboryis described as
According to Eq.(1), we know that mutual cooperation can result in the equal payoffRfor each party; so, whenxis located inside the cooperative clusterΩC,its accumulated payoff should be proportional to the number of effective neighbors
Obviously,for an individual located insideΩC,he likely to be satisfied with his current payoff obtained by learning from his cooperative neighbor, so he will spontaneously enhance the interaction intensity from himself to his mentor, which possibly leads to there being more chances to interact.That is to say, the number of an individual’s effective neighbors will increase as time goes on.Furthermore, the higher the satisfaction frequency, the more effective neighbors an individual will have.In turn,the satisfaction frequency increases with the number of effective neighbors.Obviously,a positive feedback effect can occur as an individual’s satisfaction frequency and the amount of effective neighbors influence each other.Due to this, the competitiveness of the cooperators located at the boundary can be improved step by step.When the attack force of boundary cooperators is greater than the defense force of boundary defectors,ΩDwill be demolished and opportunistic turncoats can easily evolve into cooperators through learning.
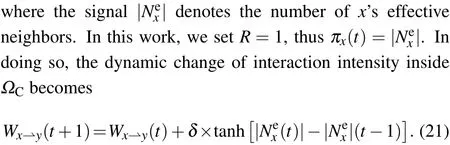
Fig.6.Dynamic evolution of cooperation density ρc(t) for different driving coefficients δ.It is shown that solely relying on spatial reciprocity (δ = 0) cannot promote the emergence of cooperation when individuals face a higher temptation to defect.However, for the selfadapting interaction mode driven by learning from neighbors,the scene has changed dramatically and the higher value of δ indicates a stronger positive feedback effect.Relevant parameters: N =100, K =0.1 and b=1.05.
Through the above analysis, it becomes evident that the positive feedback in the system plays a pivotal role in shaping cooperation dynamics.Therefore it is important to gain an indepth understanding of this phenomenon by investigating the dynamic evolution of cooperation densityρc(t) for different driving coefficientsδ,as shown in Fig.6.One can see that the cooperators in the population quickly vanish over time in the traditional interaction mode(δ=0),which means that relying solely on spatial reciprocity cannot promote the emergence of cooperation when individuals are faced with the high temptation value.However, for the self-adapting interaction mode driven by learning from neighbors,the scene changes dramatically.For example,whenδ=0.1,the initial drop ofρc(t)is quickly controlled, then turns to a period of rapid spreading of cooperators and, finally, arrives at a relatively stable state.Evidently, the essential reason for providing a superior environment for collaborators is the positive feedback effect in the system.In addition,the time required,which is the initial descent ofρc(t), will be gradually reduced with increasingδ,and the earlier the decline is suppressed, the faster cooperation recovers and the greater the dominance of the cooperators in the population.These phenomena indicate that the higher the value ofδis,the stronger the positive feedback effect will be.
4.4.Robustness of the system under noise
The final but highly significant question pertains to the robustness of the system under the influence of noise intensity in the strategy updating process.On this point,we further investigate the density of cooperationρcwhen influenced by the noise intensityKand the driving coefficientδ, for a smaller(such asb=1.02,left panel)and a bigger(such asb=1.10,right panel) temptation value, as shown in Fig.7.We divide theKOδcoordinate plane into three regions so as to be convenient description,
Forb= 1.02, when (K,δ)∈Θ1a, cooperators are in a state of extinction.Namely, when 0≤K <0.1, the cooperators are completely gone regardless of the value ofδ.When(K,δ)∈Θ2a, for an arbitrary value ofδ,ρcis promptly enhanced,and even reaches a saturation condition with the slight increase ofK.However, asKfurther increases,ρcstarts to decrease gradually when (K,δ)∈Θ3a.These phenomena highlight the presence of an optimal noise environment that can most effectively facilitate the propagation of cooperation,aligning with the outcome that appropriate noise levels can bolster cooperative behavior.[48,49]On the other hand,the qualitative result, i.e., the cooperators have the absolute advantage of being able to dominate the whole population whenδexceeds a critical threshold (δ >δmin), is not changed.In brief,these results show that the effect of noise is robust for the system when the individuals are faced with a smaller temptation.Remarkably,similar phenomenon emerges when we examine the system’s resilience under a higher temptation factor,specifically forb=1.1,in contrast to the case whereb=1.02.In other words,we find that an optimal noise environment can facilitate cooperation under a high temptation level.Namely,
As a consequence,we believe that the effect of noise is robust in the system for different values ofb, although the interval width ofKoptgets narrower and narrower with increasingb.
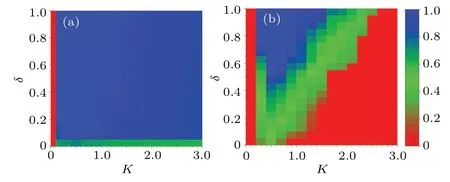
Fig.7.Density of cooperation ρc is influenced by the noise intensity K and the driving coefficient δ.It shows that the qualitative result does not change under the influence of noise whether the temptation value is smaller or bigger,so we believe the system is robust for different values of temptation.(a) For a smaller temptation b=1.02; (b) for a bigger temptation b=1.10.Other relevant parameters: N=100,m=2×10³,T =104 (even 105)and n=100.
We have presented all the experimental results for our computation model and analyzed the cooperative dynamics in the population in detail.However,it is necessary to state that these results are obtained on a 100×100 square lattice with a von Neumann neighborhood.When we adjust the size of lattice, whether for a small-scale network (e.g., 50×50) or a large-scale one(e.g.,200×200),the results obtained are consistent with those in this paper.Also, we tested the evolution of cooperation on a square lattice with a Moore neighborhood and on a scale-free network, respectively.The results show that the qualitative results do not change by comparing them with those presented in foregoing statistics diagrams,although the dependence ofρconb(orδ)is more continuous on such networks.Here,we briefly explain the reason why the results are more continuous on the square lattice with a Moore neighborhood.As is known to all, there are triangular frames in the spatial structure;for full interaction(the interaction intensity between paired individuals is equal to 1), it will lead to the defectors having more opportunities to invade the cooperative cluster.However,when we introduce our mechanism,which is an adaptive interaction driven by the learning effect,the chances of invading are reduced for defectors.On the other hand, the characteristic of high clustering in the lattice promotes the clustering ability of the cooperative cluster.For these reasons,a smaller-scale cooperative cluster can exist and be maintained near the transition point,which reduces fluctuations of the data points.Over the next few years,our research will primarily focus on the cooperative dynamics of adaptive interaction within the context of virus transmission[50-52]in terms of single-layer and multi-layer networks.
5.Conclusion
Within social groups,the connections among individuals are intricately linked to the process of mutual learning.For this reason, we establish a model of self-adapting interaction driven by the learning effect to investigate the evolutionary PDG on a directed and weighted square lattice.In this computation model,a learner is likely to naturally increase the interaction strength directed towards his mentor,whom he mimics,when his cumulative payoff is more than the reference payoff.Conversely, the interaction strength will weaken when the cumulative payoff is less than the reference payoff.Experimental results indicate that the mechanism can drastically improve the cooperation level in the spatial PDG.The parameterδ,which is the driving coefficient of interaction intensity,plays an important role in cooperation within the population.Interestingly,for a certain range of temptations,we notice that cooperators have the absolute advantage of being able to dominate the whole population whenδexceeds a critical threshold.However, for a large uncooperative faction, although the cooperators do not have the advantage of dominating the population,there is still a small driving coefficientδminthat can provide a moderate environment for the survival of cooperators.By kinetic analysis, we find that there is a positive feedback effect between an individual’s satisfaction frequency and his number of effective neighbors.This positive feedback effect is observably enhanced with increasingδ.Furthermore, we extend the pair-approximation method and apply it to verify the simulation results.The results from the theoretical analysis and the numerical simulation are basically coincident, although there are some subtle differences.Finally,by studying the robustness of the system under the influence of noise, we find that our system is robust under different strengths of social dilemma.
Acknowledgement
Project supported by the National Natural Science Foundation of China(Grant No.61963013).

- Chinese Physics B的其它文章
- Does the Hartman effect exist in triangular barriers
- Quantum geometric tensor and the topological characterization of the extended Su–Schrieffer–Heeger model
- A lightweight symmetric image encryption cryptosystem in wavelet domain based on an improved sine map
- Effects of drive imbalance on the particle emission from a Bose–Einstein condensate in a one-dimensional lattice
- A new quantum key distribution resource allocation and routing optimization scheme
- Coexistence behavior of asymmetric attractors in hyperbolic-type memristive Hopfield neural network and its application in image encryption