
Impact of different interaction behavior on epidemic spreading in time-dependent social networks
2024-03-25 09:30ShuaiHuang黄帅JieChen陈杰MengYuLi李梦玉YuanHaoXu徐元昊andMaoBinHu胡茂彬
Chinese Physics B 2024年3期
关键词:陈杰
Shuai Huang(黄帅), Jie Chen(陈杰), Meng-Yu Li(李梦玉),Yuan-Hao Xu(徐元昊), and Mao-Bin Hu(胡茂彬),†
1School of Engineering Science,University of Science and Technology of China,Hefei 230026,China
2School of Mathematics,Southeast University,Nanjing 210096,China
Keywords: epidemic transmission,complex network,time-dependent networks,social interaction
1.Introduction
The outbreak of epidemics poses a significant threat to human society, emphasizing the crucial need to develop effective epidemic-control strategies.[1-3]The emergence of complex network theory provided a novel framework for better comprehension of various propagation problems, including epidemics, rumor, ideas, and cyber viruses.[4-7]Compartment models including susceptibleinfected (SI), susceptible-infected-susceptible (SIS), and susceptible-infected-recovered (SIR) models have been extensively investigated to provide insights on how to mitigate spreading.However,most studies in literature assume that individual interactions are static,[8,9]potentially leading to erroneous conclusions.[10]Indeed, interactions between individuals have strong time-dependent and evolving properties,which can be effectively captured by temporal or activitydriven (AD) networks.[11]In the AD network, each node has an activity potential,representing the probability of being activated.Wanget al.[12]utilized the AD network to investigate the effects of individual behaviors on epidemics.Houet al.[13]analyzed the impact of social attitudes on the spread of epidemics.
In research of epidemic transmission patterns in social networks, various methods for intelligent analysis of social network images have been proposed to extract relevant information from social networks.For instance,Liet al.introduced the weakly supervised deep matrix factorization(WDMF)algorithm, which effectively addresses issues related to social image label refinement,label assignment,and image retrieval by revealing latent representations of images and labels.[14]Subsequently, Liet al.also proposed a model called deep collaborative embedding (DCE) to achieve knowledge from images contributed by the community and leverage weakly supervised contextual information for multiple image understanding tasks.[15]This model adopts a unified framework that combines end-to-end learning and collaborative factor analysis to optimize representation learning and explore latent spaces.
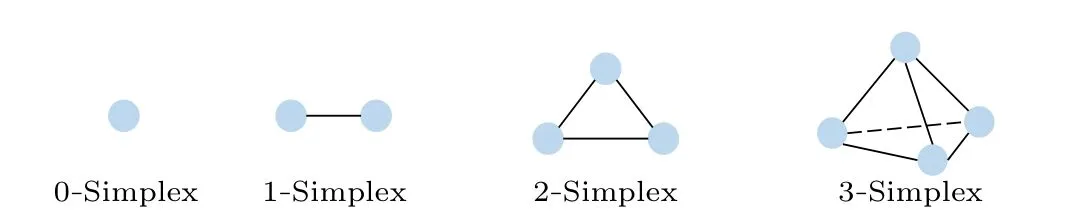
Fig.1.The structures of (s-1)-simplex (s=1, 2, 3, and 4) and simplex complex.Here(s-1)-simplex is a(s-1)-dimensional polyhedron, which is a convex hull composed of its s-1 vertices(nodes).
Most studies modeled individual interaction as pairwise links,while neglecting the effects of group interaction on epidemics.In social networks,the simultaneous sharing of false information by multiple individuals increases the likelihood of it being believed.[16]In collaborations among scientists,group connections are common involving multiple authors working on a scientific paper.[17]Therefore,networks with higherorder interactions describing group dynamics have emerged as powerful framework for modeling collective behaviors,including simplicial complexes and hypergraphs.[18]As shown in Fig.1, a simplicial complexKis a set of simplexes that satisfy the following conditions: (i)all proper subfaces of the simplexsare also ins; (ii) the intersection of any two simplexesσ1∈sandσ2∈s[19-21]is a common face ofσ1∈sandσ2∈s.Based on this concept, Petriet al.introduced a simplicial activity-driven(SAD)model and demonstrated that the structure of the simplicial complex influences the contagion process.[22]In the SAD model, nodes activated at each time step randomly choose (s-1) other nodes to form a simplex,where a(s-1)-simplex is defined as a set ofsvertices.
During the COVID-19 pandemic, there exist diverse social interactions in response to government measures,including pairwise and group interactions.[23-25]However, the effects of different social interactions on the spread of epidemics in time-dependent networks are still not well understood.To fill this gap, this paper presents a comprehensive model that integrates both pairwise and group interactions.In this model,group interactions are modeled by simplicial structures,while pairwise interactions are represented by pairwise links.A parameterpis introduced to control the pairwise interaction proportion in the network (i.e., 1-pis the proportion of group interaction).Meanwhile, the parameter (s-1) represents the group social intensity, and the parameter ofm(links to other individuals) represents the pairwise social intensity.By extensive simulation and theoretical analysis,the effects of pairwise/group interaction proportions, and pairwise/group interaction intensities are widely explored.It is found that an increase in the pairwise interaction proportion can effectively mitigate the spread of the epidemic under the condition that the group social intensity equals the pairwise social intensity.Reducing the group social intensity can slow down the epidemic spreading when the pairwise interaction proportion is low.However, as the pairwise interaction proportion increases, the epidemic suppressing effect of reducing group social intensity becomes less significant.Interestingly, with high group social intensity (larger than or equal to pairwise social intensity), increasing the pairwise interaction proportion leads to a decrease in the scale of infection.Conversely,when group social intensity is low (less than pairwise social intensity), increasing the proportion of pairwise interactions results in larger scale of infection.Additionally, a weak heterogeneous activity distribution raises the epidemic threshold while reduces the scale of infection.These results can benefit the design of epidemic control strategies.
The paper is structured as follows: In Section 2 we introduce the epidemic model.In Section 3,we analyze the impact of pairwise/group interaction proportions, the pairwise/group interaction intensities,and heterogeneous activity distribution on the epidemic threshold.Finally,in Section 4 we summarize the main findings.
2.Model
This section introduces our model of activity-spreading network with multiple modes of social interactions.
2.1.Activity-driven network with pairwise/group interactions
In this time-varying network,Nnodes are characterized by an activity distributionF(a), from which the activityai=1,2,...,Nof each nodeiare extracted.[11]The activityairepresents the firing probability of nodeiand is fixed throughout the whole process.Its probability distribution isF(a)∝a-γa,where 2<γa <3 andε≤a≤1,to avoid divergence.
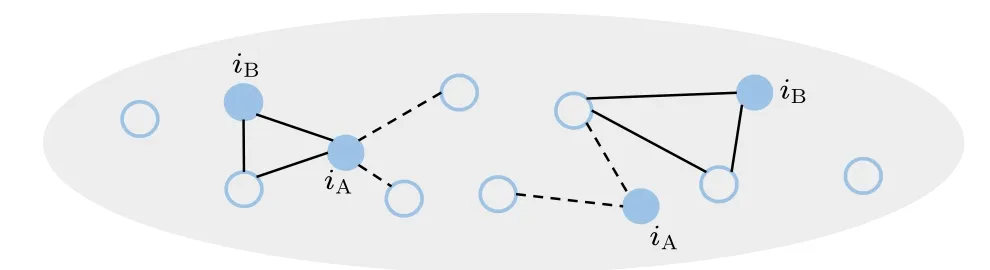
Fig.2.Schematic illustration of time-varying network of populations with different social interactions.Here the blue solid nodes represent active nodes.
For the simplicity of mean field analysis,we assume that group interactions involve individuals who do not participate pairwise social interactions.Similarly,individuals engaged in pairwise social interactions will not participate in group activities.Individuals are classified into two types based on their social interaction patterns during epidemic outbreak.Each individual is randomly assigned to one of the two types (A or B).Type-A individuals engage in pairwise interactions,while type-B individuals engage in group interactions.The pairwise interaction proportion is denoted byp, indicating thatpNindividuals out of the total population ofNengage in pairwise interactions.The remaining (1-p)Nindividuals engage in group interactions.
At each time step, each nodeifires with probability ofaiΔt.If nodeibelongs to type A, it connectsmnodes randomly; on the contrary, if nodeibelongs to type B,it selects(s-1) nodes uniformly at random to form a (s-1)-simplex,wheresrepresents the social intensity of nodei.The parameter (s-1) is called the group interaction intensity, and the parametermis called the pairwise interaction intensity.Note that nodeionly produces links if it is active,thus forming an instantaneous networkGt.At the end of time step,the existing edges in networkGtare removed.
2.2.Epidemic spreading
The classical susceptible-infected-susceptible (SIS)model was utilized to simulate epidemic spreading processes.In the model, individuals can be either susceptible (S) or infected (I).During each time step, susceptible individuals become infected at a rate ofλwhen they contact with infected individuals, and infected individuals recover to susceptible at a rate ofµ.
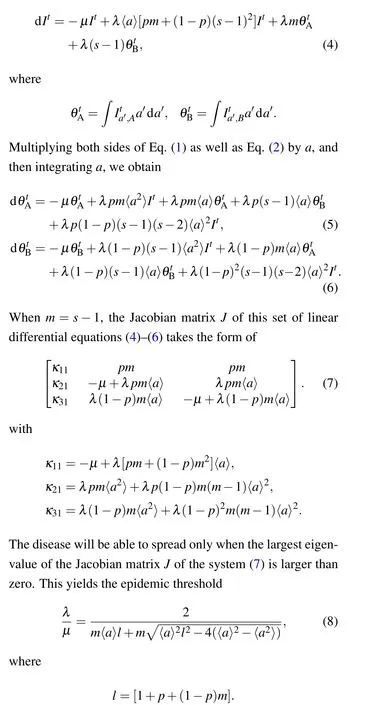
Integrating the spreading process with the network evolution allows for a more accurate representation of epidemic spreading.Theoretical estimation of the epidemic threshold and size can be derived as follows.[13]At a mean-field level,the population engaged in pairwise interactions at timetcan be obtained as
where the first term on the right-hand side represents the recovery of nodes with activitya, the second term signifies the probability that susceptible nodes with activityaof type A become active and get infected after contact with infected nodes of any activity level(hence,the integration overa′).The third term represents the susceptible nodes with activityaof type A that can be selected and infected by an active infected node with any activity level (hence, the integration overa′).Similarly, the fourth term denotes the susceptible nodes with activityaof type B that can be chosen and infected by an active infected node with any activity level (hence, the integration overa′).Finally, the last term describes the scenario where a susceptible node with activityais selected by a susceptible node with activitya′of type B, which then becomes active(with probability ata′Δt) and creates a simplex that includes an infectious node with activitya′′.
The number of population with group interaction at timetis given by
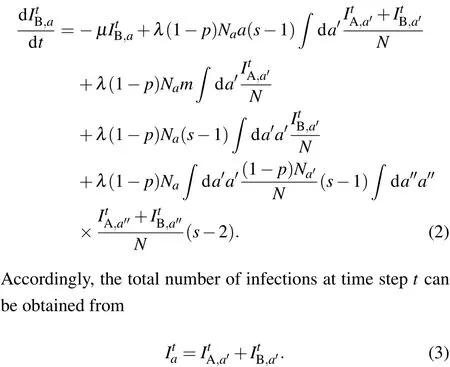
By integratingain Eq.(3),we obtain
3.Simulation results and discussion
In this section, we analyze the influence of various social interactions on the spread of epidemic.Numerical simulations are carried out using the following parameters:population sizeN=2000,time step Δt=1,recovery rateµ=0.01,0.01 ≤a≤1,γa=2.1,m=3,ands=4.The initial fraction of infected nodes is set to 0.01.Simulations are performed forT=10000 steps,and the average covers the final 1000 steps.Each presented result is an average of 100 independent experiments conducted through Monte Carlo simulations.
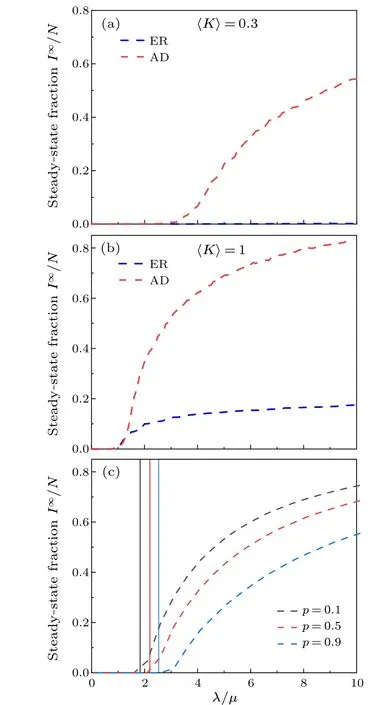
Fig.3.The relationship between the steady-state fraction of infected individuals I∞/N and λ/µ for Erdos-Renyi(ER)random network and activitydriven (AD) network with the same average degree of 〈K〉=0.3 (a), and〈K〉=1.0(b).(c)The relationship between the steady-state fraction of infected individuals I∞/N,λ/µand the pairwise interaction proportion p,with p=0.1(black),0.5(red),0.9(blue).The vertical lines on the plot represent the theoretical thresholds calculated with Eq.(8).
Figures 3(a)and 3(b)display the relationship between the steady-state fraction of infected individualsI∞/Nand epidemic parameterλ/µfor static Erdos-Renyi (ER) random network and activity-driven (AD) network with the same average degree of〈K〉=0.3, and〈K〉=1.0, respectively.One can see that, when the average degree is low [Fig.3(a)], disease will spread in the AD network whenλ/µ >2.5,while it will disappear in the ER network.This is due to the fact that the nodes are not well-connected when the links are very sparse,so that the epidemic spreading is local and limited.In the AD network, active nodes and the links appear at different times,providing a passageway for the virus to spread in the system.When the average degree is high[Fig.3(b)],the epidemic will spread in both static ER networks and dynamic AD networks.Although both networks show similar threshold of epidemic spreading, the steady-state fraction of infected individuals of the AD network is much higher than the ER network.The different behavior of static ER networks and dynamic AD networks shows the importance of investigating the effect of timedependent networks on the spreading of epidemics.
Figure 3(c) further shows the relationship between the steady-state fraction of infected individualsI∞/Nand epidemic parameterλ/µfor different value of pairwise interaction proportionp.The results show that the epidemic size increases withλ/µ.With a larger pairwise interaction proportion,a higher threshold and a smaller size of epidemic will be observed.This is due to the fact that a decrease of group interactions means a reduction in social gatherings, consequently limiting the spread of the epidemic.
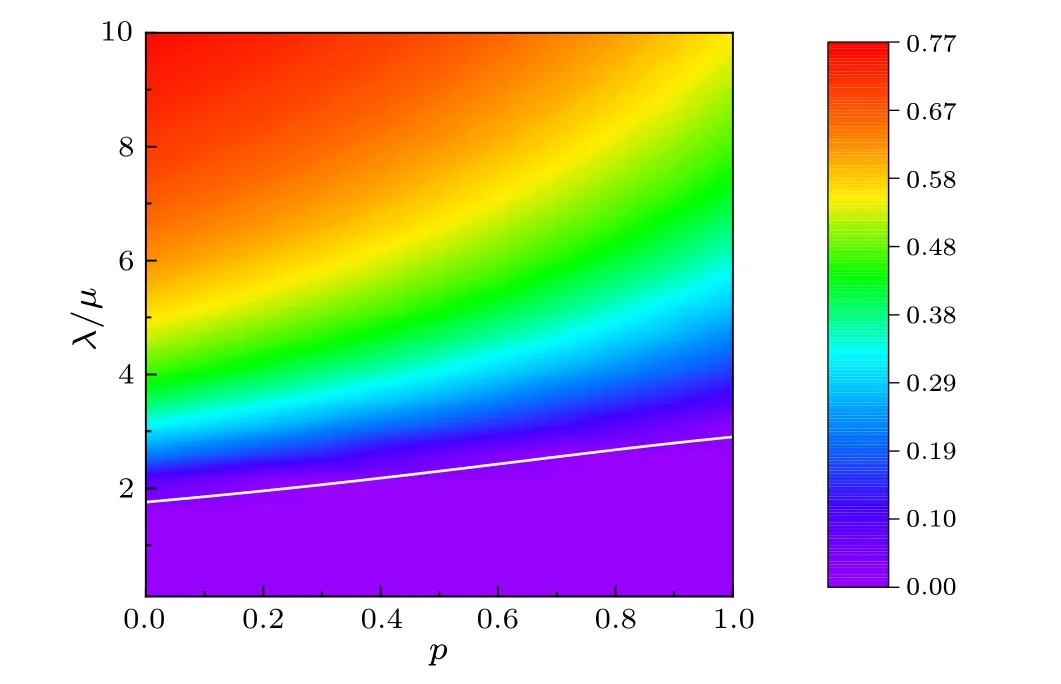
Fig.4.The relationship between the steady-state fraction of infected individuals I∞/N (color coded),λ/µ and the pairwise interaction proportion p.The white solid line corresponds to the theoretical threshold calculated using Eq.(8).
Figure 4 illustrates the variation of steady-state fraction of infected individualsI∞/Nwith epidemic parameterλ/µand pairwise interaction proportionp.One can see that,for differentp, the scale of infection increases withλ/µ.Meanwhile,the epidemic threshold increases withp.The simulation results agree well with the result of theoretical thresholds.Aspincreases,a higher value ofλ/µis needed to attain a given steady-state fraction of infection.This indicates that as the pairwise interaction proportion increases,it becomes more difficult for the epidemic to spread.Conversely, a higher prevalence of individuals with group interactions increases the likelihood of epidemic outbreak.
Figure 5 shows the relationship between the steady-state fraction of infected individualsI∞/Nand the epidemic parameterλ/µ,for various values of pairwise interaction proportionpand group interaction parameters.Note that (s-1) represents the group social intensity.One can see that,for all values ofpands,the infection density increases withλ/µ.Increase the pairwise interactions proportionpresults in a higher epidemic threshold and a reduction in the scale of the epidemic.Figures 5(a)-5(c) show that, as the pairwise interaction proportionpincreases, the threshold variation value decreases.Forp=0.2,the threshold range changes from 1.4 to 3.2,and forp=0.8,the threshold range changes from 1.8 to 2.8.Furthermore, as the pairwise interaction proportionpincreases,the infection size variation value gradually decreases.Forp=0.2,the proportion of infected nodes decreases from 0.83 to 0.57, and whenp=0.8, the proportion of infected nodes decreases to 0.59.whens=4 ands=3) as the pairwise interaction proportionpincreases.On the other hand,when the level of group social intensity is less than the pairwise social intensity(e.g.,s=3),the size of infection generally increases aspincreases.This phenomenon can be attributed to an increase in the number of individuals engaged in pairwise interactions, indicating an increase in the number of socially intense individuals within the group.Consequently, this can lead to a rise in the overall number of contacts within the network and, subsequently, an increase in the size of the infection.
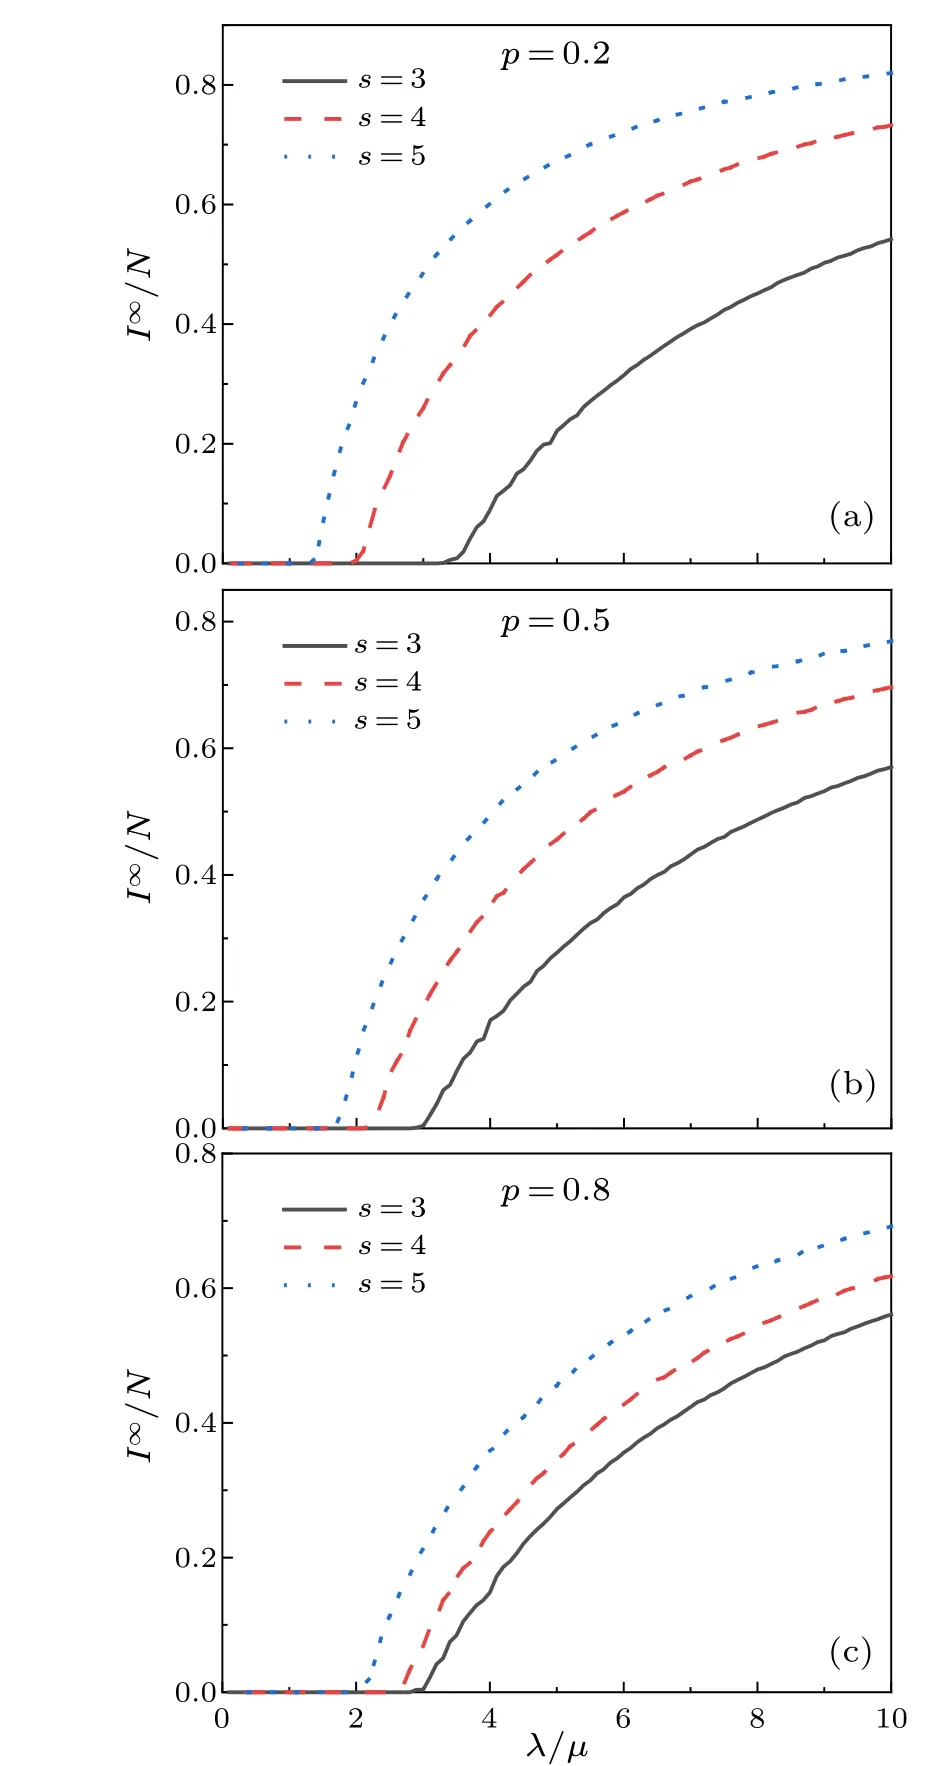
Fig.5.The steady-state fraction of infected individuals I∞/N as a function of λ/µ with different values of group social parameter s for p=0.2 (a),p=0.5(b),and p=0.8(c).

Fig.6.The relationship between the steady-state fraction of infected individuals I∞/N and the pairwise interaction proportion (p) under different group interaction parameter s=3(square),4(circle),5(triangle).Here we fix λ =0.05.
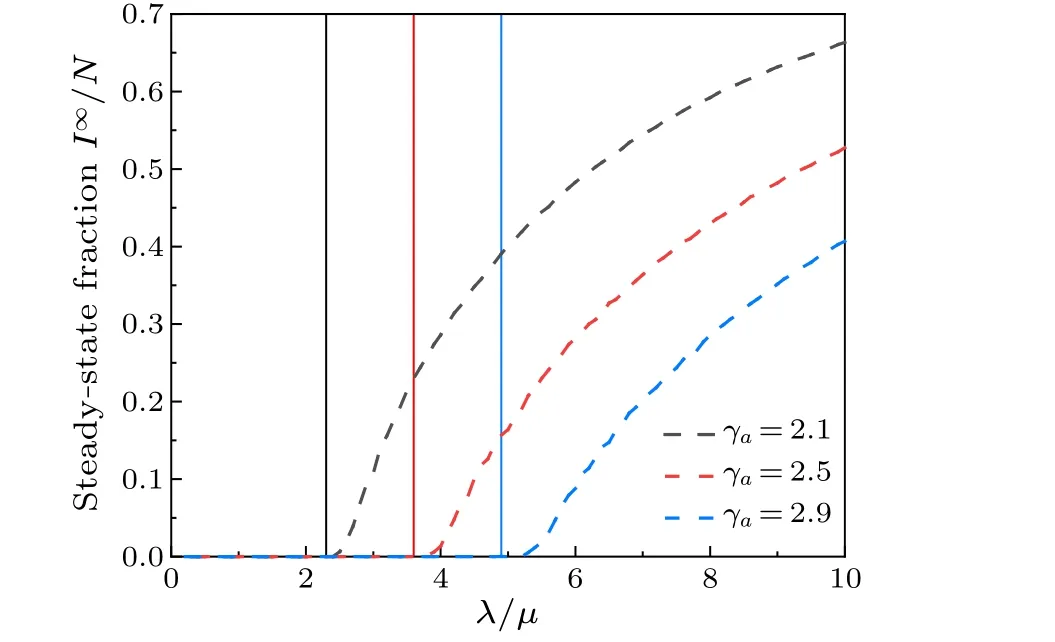
Fig.7.The relationship between the steady-state fraction of infected individuals I∞/N, and the λ/µ ratio under different exponents γa.The vertical lines indicate the theoretical thresholds calculated with Eq.(8)for three different values: γa =2.1 (black), γa =2.5 (red), γa =2.9 (blue), and the pairwise interaction proportion p=0.7.
We further investigate the relationship between the steady-state fraction of infected A-type/B-type individuals and the epidemic parameterλ/µ.Figure 6 shows the steady-state fraction of infected individualsI∞/Nas a function of pairwise interaction proportionpfor different values of group interaction parameters(s=3, 4, and 5).It is evident that, the size of infection decreases when the level of group social intensity is greater than or equal to the pairwise social intensity (e.g.,
Figure 7 presents the epidemic size against epidemic parameterλ/µfor various exponentsγa.It is evident that, irrespective of the value ofγa, the epidemic size consistently increases with higher values ofλ/µ.A smallerγavalue signifies a more heterogeneous activity distribution,[26]indicating a greater degree of heterogeneity in the network.Consequently,larger epidemic sizes are observed at the sameλ/µwhen the activity distribution is more heterogeneous.This phenomenon can be attributed to the presence of hub nodes in the social network.Infection among hub nodes facilitates the rapid spread of the epidemic throughout the network.Conversely,reducing the heterogeneity of the network can restrict the spread of an epidemic.
4.Conclusion
In summary, the influence of pairwise and group social interactions on the spread of epidemics is explored in activitydriven time-dependent social networks.Higher-order simplicial structures are adopted to describe group interactions.Mean-field approach is extended to derive the epidemic threshold for the activity-epidemic model theoretically.Monte Carlo simulations are carried out to verify the theoretical results.
The research yields several key findings.First,when the group social intensity is equal to the pairwise social intensity,as the pairwise interaction proportion increases,the epidemic threshold increases and the infection scale decreases.Second,regardless of the value of the pairwise interaction proportion,as group social intensity decreases,the epidemic threshold increases and the infection scale decreases.Third, when the level of group social intensity is greater than or equal to the pairwise social intensity,the infection scale tends to decrease as the pairwise interaction proportion increases.Conversely,when the level of group social intensity is less than the pairwise social intensity,the size of infection tends to increase as the pairwise interaction proportion increases.Furthermore, a weak heterogeneous distribution of activities can elevate the threshold of epidemic and reduce the scale of infection.
These findings emphasize the significance of group interactions in the spread of epidemics.The results are helpful for designs of epidemic control strategies in long-term process of fighting against COVID viruses.
Acknowledgments
This work was supported by the National Natural Science Foundation of China (Grant No.12072340), the China Postdoctoral Science Foundation (Grant No.2022M720727), and the Jiangsu Funding Program for Excellent Postdoctoral Talent(Grant No.2022ZB130).
猜你喜欢
Chinese Physics B(2023年9期)2023-10-11
牡丹(2023年7期)2023-04-13
知音(月末版)(2022年5期)2022-05-23
牡丹(2022年9期)2022-05-17
Plasma Science and Technology(2022年1期)2022-02-15
文艺生活(艺术中国)(2021年9期)2021-10-13
中华建设(2019年4期)2019-07-10
小天使·一年级语数英综合(2018年1期)2018-06-22
新传奇(2018年3期)2018-05-14
河南电力(2017年7期)2017-11-30

- Chinese Physics B的其它文章
- Does the Hartman effect exist in triangular barriers
- Quantum geometric tensor and the topological characterization of the extended Su–Schrieffer–Heeger model
- A lightweight symmetric image encryption cryptosystem in wavelet domain based on an improved sine map
- Effects of drive imbalance on the particle emission from a Bose–Einstein condensate in a one-dimensional lattice
- A new quantum key distribution resource allocation and routing optimization scheme
- Coexistence behavior of asymmetric attractors in hyperbolic-type memristive Hopfield neural network and its application in image encryption