
Exploration of the coupled lattice Boltzmann model based on a multiphase field model: A study of the solid–liquid–gas interaction mechanism in the solidification process
2024-03-25 09:33ChangShengZhu朱昶胜LiJunWang王利军ZiHaoGao高梓豪ShuoLiu刘硕andGuangZhaoLi李广召
Chinese Physics B 2024年3期
关键词:李广
Chang-Sheng Zhu(朱昶胜), Li-Jun Wang(王利军), Zi-Hao Gao(高梓豪),3,Shuo Liu(刘硕), and Guang-Zhao Li(李广召)
1College of Computer and Communication,Lanzhou University of Technology,Lanzhou 730050,China
2State Key Laboratory of Gansu Advanced Processing and Recycling of Non-Ferrous Metal,Lanzhou University of Technology,Lanzhou 730050,China
3Institute of Modern Physics,Chinese Academy of Sciences,Lanzhou 730000,China
Keywords: multiphase field model,lattice Boltzmann model(LBM),Shan-Chen multiphase flow,solidification organization
1.Introduction
With the development of the field of materials science and engineering,the study of the behavior and interaction mechanisms of complex multiphase fluids during solidification has become increasingly important.Bubbles and dendrites are two common microstructures in the solidification process,and their morphological evolution and interactions during solidification have an important impact on the properties and structure of materials.[1]Therefore,an in-depth understanding of the interaction mechanism between bubbles and dendrites as well as the influence of various factors on the solidification tissue morphology is of great theoretical significance and application value.[2,3]
In order to investigate the growth evolution mechanism of solidified tissues as well as the bubble formation mechanism,scholars have conducted a large number of experimental studies.However, the opacity of metallic materials largely limits researchers’ real-time observation of tissue evolution during alloy solidification.With the rapid development of computer technology,numerical simulation has become an effective way to solve such complex problems.[4]
In recent years, scholars have widely applied the phasefield method(PFM),level-set method(LSM),and cellular automata(CA)methods in microporosity simulations.The goal of these simulations is to study the generation and evolution of microporosity in order to obtain simulation results that couple the real-time mesoscopic and microscopic scale microstructure morphology.Among them, the phase field method[5,7](PFM) is a simulation method that describes the kinetic evolution process of the system based on thermodynamics, and it has many advantages over other methods, such as the ability to accurately simulate a variety of complex microstructures without having to track the complex solid-liquid interface.[8,9]In addition, multiphase flow systems play an important role in natural and industrial processes, and the lattice Boltzmann method[10](LBM), as a mesoscopic simulation method between macroscopic continuum simulation and microscopic molecular dynamics simulation, has been developing rapidly in the field of computational fluid dynamics(CFD)and shows great potential.[11]Currently,many scholars have successfully simulated complex multiphase flow systems using LBM.[12]
Meidaniet al.[13]developed a two-dimensional/threedimensional phase field model to simulate the growth process of irregular pores confined by the dendrite lattice using a multiphase field approach,and investigated the effect of factors such as the solid-phase fraction on the pores morphology.However, the model did not consider the effect of dendrite growth.Zhanget al.[14]developed a solid-liquid-gas multiphase field lattice Boltzmann model for the study of complex multiphase flow interactions during solidification of pure metals,and they developed a mixed-phase-field lattice Boltzmann method as well as a parallel adaptive lattice refinement algorithm for simulating the interactions between the gas bubbles and the solid-growth fronts during the solidification process and successfully solved the solid growth and bubble evolution problems using the phase field method.Sunet al.[15]successfully simulated the formation of pores and microstructure evolution of binary sub-eutectic Al-Si-Mg alloys during solidification using a two-dimensional multicomponent multiphase metatronic cellular automata model,considered the solute and hydrogen partitioning at the solid-liquid interface, and simulated the growth of dendrites and solute migration using the CA-FDM method.Guet al.,[16]on the other hand,used meta cellular automata to simulate the coupled process of hydrogen porosity evolution and dendrite growth during the solidification of the alloy,calculated the diffusion of solute and hydrogen using the finite difference method,observed the competing growth and porosity between columnar dendrites and isometric dendrites, and explored the effect of the cooling rate on the radius of the porosity; it is worth noting that the model can only describe the static state of the gas bubbles during the solidification process.In addition, Zhanget al.[17]proposed a coupled LB-CA-FD model for simulating the formation of hydrogen pores during the solidification of binary subeutectic aluminum alloy dendrites.They used the LBM simulation to calculate the hydrogen transport as well as the nucleation,growth and motion of bubbles.
It should be noted that the meta cellular automata (CA)method is mostly used in the above studies.As for the cellular automata (CA) method compared with the phase field(PF) method, the PF method can more realistically simulate the complete process of dendrite growth.[18]Moreover,due to the relevant simulation techniques,there are almost no studies on the interaction between dendrites with different orientations and gas bubbles during the directional solidification process.Therefore,in the face of the above research gap in this field,a multiphase field simulation coupled lattice Boltzmann method(PF-LBM)is proposed in this study for simulating the distribution mechanism of bubbles and solutes at the solid-liquid interface during solidification of SCN-0.24wt.%butanedinitrile alloys,the interactions between dendrites and bubbles,as well as the effects of different temperature gradients, anisotropic strengths,and tilting angles on the solidified organization.The model combines the advantages of multiphase field simulation of dendrite growth and Shan-Chen multiphase flow-based LBM simulation of bubble motion,and is able to describe the multiphase flow phenomena during solidification more comprehensively.Through this study, we reveal the important physical mechanisms of bubble nucleation,growth and motion evolution and interaction with dendrite growth during solidification.These research results are of great significance for the in-depth understanding of the behavior of complex multiphase flow during solidification, and provide new ideas and theoretical basis for the preparation and property optimization of materials.
2.Multiphase field model and Shan–Chen model for LBM multiphase flow
2.1.Multi-phase field mathematical model
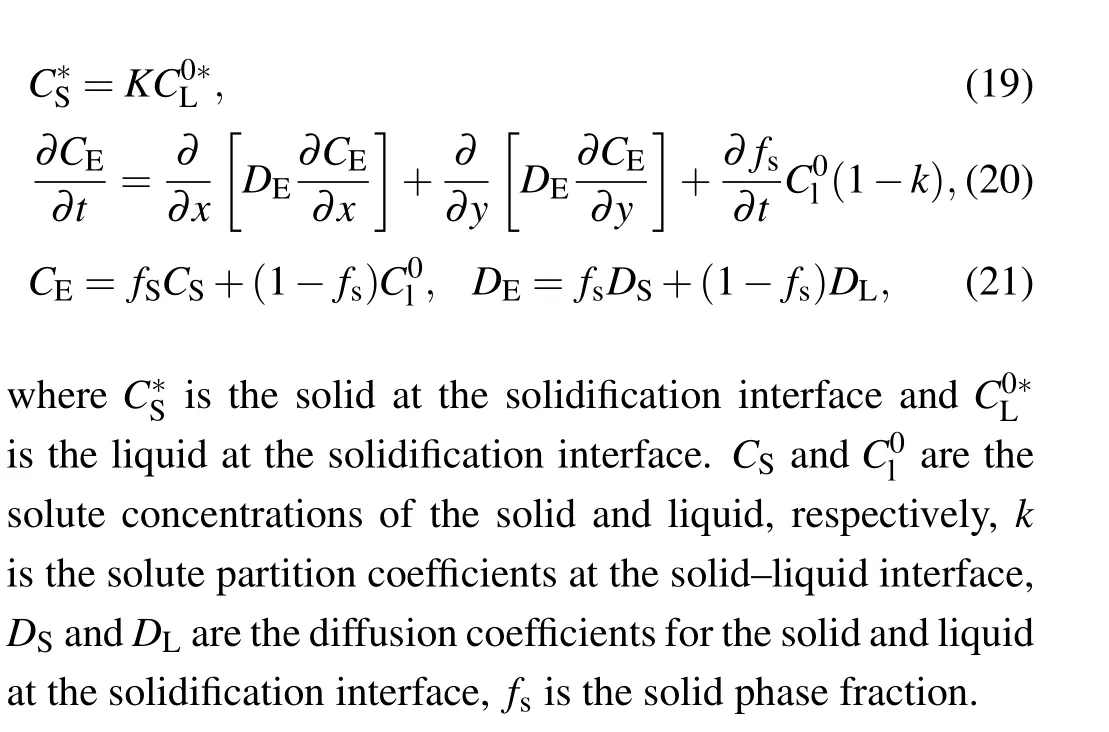
A multi-phase field mathematical model is a physical model used to describe a system of matter with different phases.In this model, matter is viewed as consisting of multiple phases, and each phase has different characteristics and properties.These phases can be transformed through interactions and form specific spatial and temporal distributions throughout the system.The multi-phase field mathematical model provides an effective tool for describing the phase transition process.Its emergence effectively solves the problem of describing the interaction and evolution laws of multiple phases(different states)in matter, and has important applications and significance in multiple fields.In this study,a quantitative multi-order parametric phase field model for dilute binary alloys developed by Ofori-Opokuet al.[19]is used,where the following multi-phase field equations are used in this paper:
Assuming negligible solute diffusion in the solid phase,the temperature is replaced by an approximation of the condensation temperatureT=Tref+G(x-Vpt),whereTrefis the reference temperature and the position above the solidification axis is denoted byx.τis the interfacial relaxation time,Wis the thickness of the diffusive interfacial layer,φiis a whole representing the phase field variables,Uis the liquid flow velocity,kis the solute partition coefficient at the solid-liquid interface.The strength of the interfacial energy anisotropy is given by
whereas=1-3ε4,θare the direction of the thermal gradient and the angle perpendicular to the grain interface,respectively,andΘi0is the top angle of the first grain interface.
Thec0l=c0/kis the concentration of the liquid portion of the solid-liquid interface, the coupling constantλrepresents the width of the diffusion interface,d0=a1W0/λis the solute capillary length,τ0is the interfacial relaxation time,x,yare the horizontal and vertical axes respectively,Gis the temperature gradient at the solid-liquid interface.ε4is the anisotropic strength of the interfacial free energy,and the solute saturation in Eq.(3) dimensionlessUis obtained by solving the solute conservation equation with the solute equation
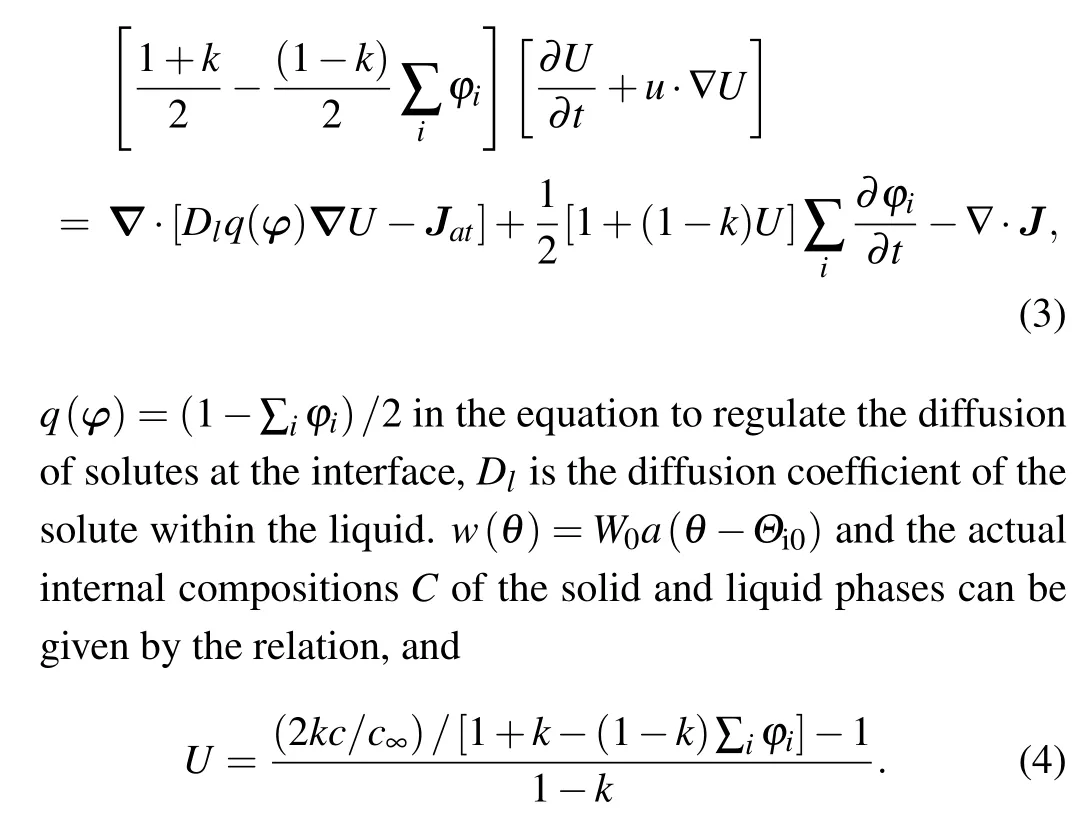
Due to the influence of the interface width selection, the scales simulated by the phase field method model are relatively small, which is difficult to realize in the real process, so the thin interface theory is used to analyze the interface so that the selection of the interface width is greater than the width of the actual interface.And when the width of the interface increases, solute shedding occurs, and this occurrence introduces a degree of computational error.In order to minimize the error generated in this part will be introduced in the solute equation the inverse solute trap flow proposed by Karmaet al.[19]in the anti-solute trapping flow.τ0=a1a2W30/(d0Dl),
wherea1,a2take the results of the derivation of the asymptotic analysis of thin interfaces by Karma and Rappel,[19,21]a1=0.8839 anda2=0.6762.When the sample is fixed and cooled at a given temperature gradientGat cooling rateR,the rate of movement of the isotherm is called the pulling speedVp=R/Gand the inverse solute trap flowJatin Eq.(3)is
2.2.Shan–Chen model for LBM multiphase flow
The Shan-Chen model is a multiphase flow model in the lattice Boltzmann method(LBM)used to simulate phase separation phenomena in complex fluid systems.LBM is a numerical simulation method based on the discrete grids,which approximately discretizes a continuous medium into discrete spatial and time step grids, and describes fluid dynamics behavior using the microscopic velocity distribution function of particles.LBM has the advantages of strong parallelism and ease of handling complex geometric shapes and boundary conditions.The main use of different mutual characteristics can be simulated by adjusting model parameters to handle various multiphase flow situations such as gas-liquid, solid-liquid,and so on.The following are the equations of the LBM multiphase flow Shan-Chen model used in this article.The Boltzmann evolution equation for LBM multiphase flow lattice can be expressed as
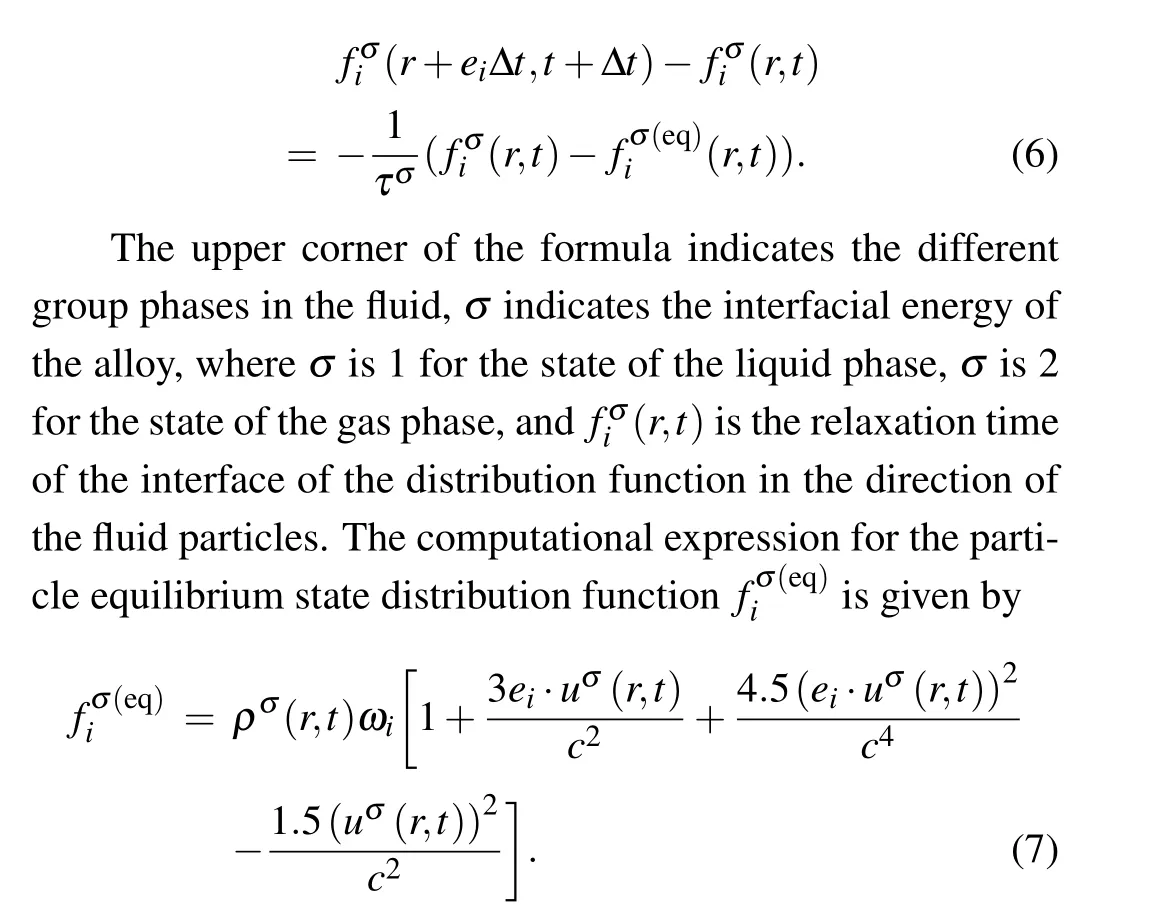
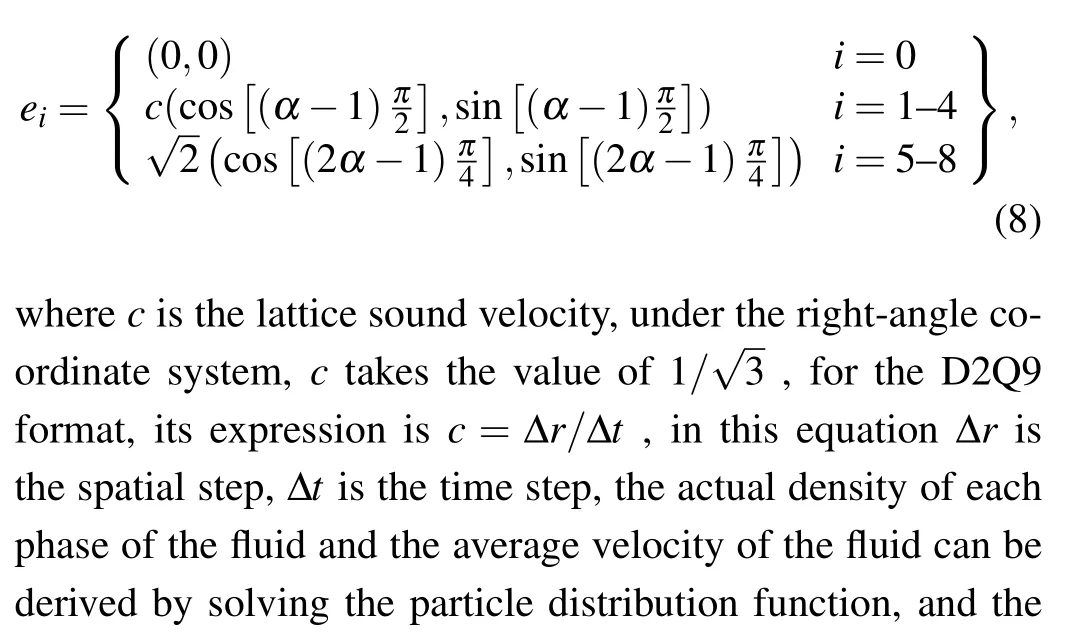
Regarding the particle equilibrium state distribution function calculation expression:ρσ(r,t)anduσ(r,t)represent the density and velocity of the fluid in theσcomponent, respectively,ωiis the weight coefficient, in the D2Q9 model,the value ofωiis taken as follows:ω0=4/9,ω1-4=1/9,ω5-8=1/36,eirepresents the velocity of the particle in theidirection of motion,andeiis the configured velocity

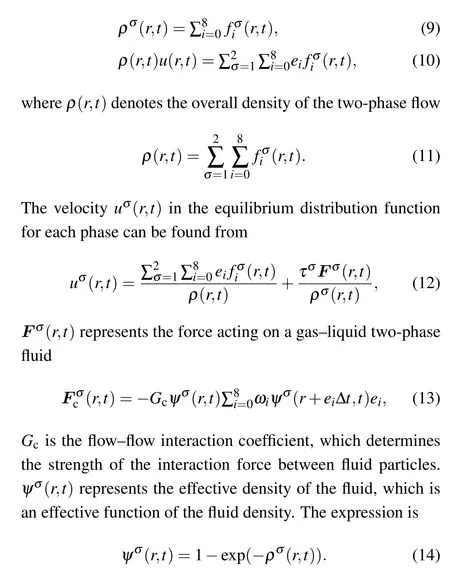
The value of pressureρ(r,t) at the lattice point of the fluid phase can be obtained from the following equation of state:
In the formula,ρ(r,t) for the density of the fluid, when different phases are transformed into each other, will cause the density of the particles change, such as gas to liquid conversion with the increase of the gas phase liquid phase will be gradually reduced,the following for the gas-liquid phase particles density changes in the relationship is
whereρgandρldenote the particle densities of the gas and liquid phases of the fluid, respectively, Δφis the amount of conversion from the liquid phase to the gas phase, which is very much related to the amount of conversion of the liquid phase to the solid phase.Δfsdenotes the amount of conversion of the particles from the liquid phase to the solid phase,andAis the coefficient,which is taken to be the value of 10-6in this paper.Coupling the multiphase field model with the LBM multiphase flow Shan-Chen model, whereCandDare the hydrogen concentration as well as diffusion coefficients,respectively, andKis the hydrogen partition coefficient, the evolution of bubbles and dendrites growth can be solved coupled by the following equations:
2.3.Physical parameters
SCN-0.24wt.% butanedinitrile alloy was used as the object of study,the grid spacing of the computational range was set tox=1W0,and the time step was selected ast=0.002τ0.Periodic boundary conditions were applied to the LBM model for simulation of the periodic fluid behavior during the interval of solidified tissue calculation in order to facilitate a better study of the phenomena between different states.The dendrite tilt angle was measured according to the angle of rotation in the counterclockwise direction.The physical parameters used in this paper are shown in the table.
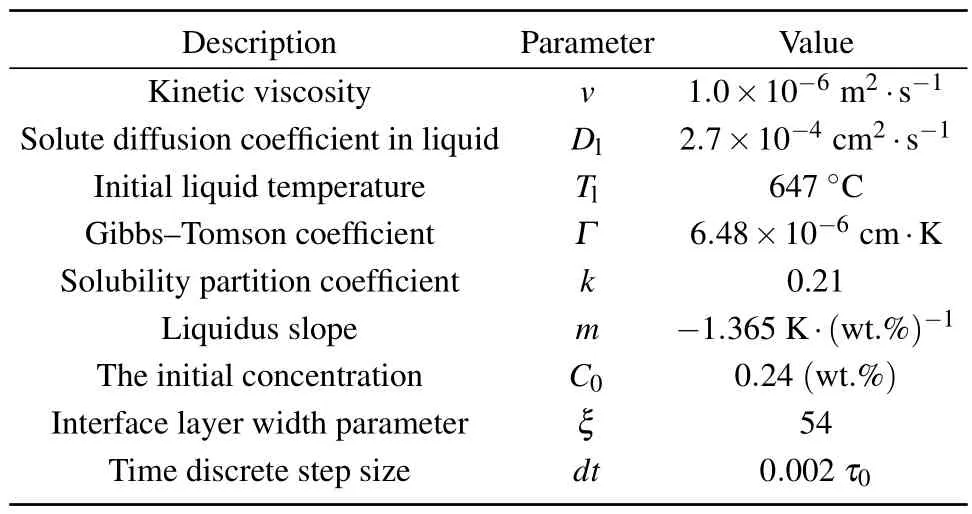
Table 1.Calculation parameters used in the simulation process.
2.4.Validation of the PF-LBM model
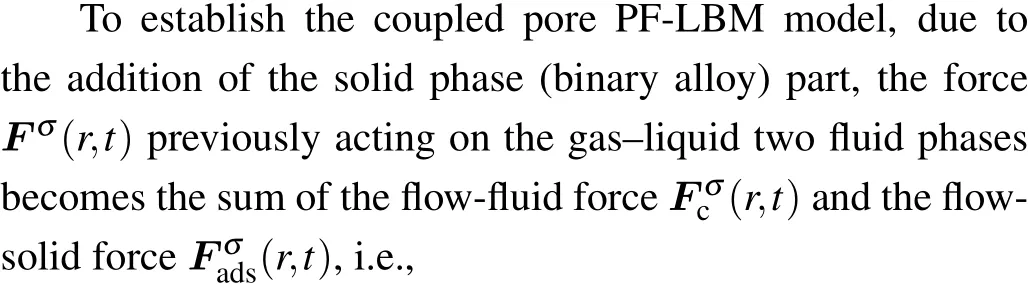
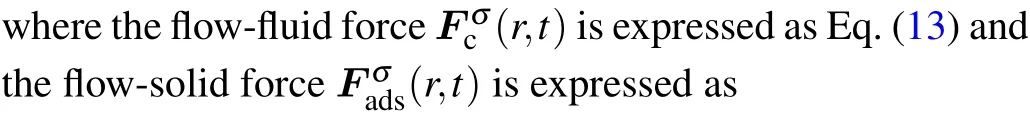
whereGσadsis the coefficient of interaction between fluidsolid, which determines the strength of the force between the fluid particles and the solid phase,s(r+eiΔt,t)eiis the labeling function, which is used to label the solid-liquid phase composition of the current lattice node,with a value of 1 when it is the solid phase,and a value of 0 when it is the liquid phase.
In order to verify the correctness of the PF-LBM model,the simulation of the wetting phenomenon between the solidliquid-gas three-phase is used to verify our model.Figure 1 shows the schematic diagram when the bubble is in a stable state after contact with a smooth solid-phase surface.At the solid-liquid-gas three-phase contact point,the angleθformed between the horizontal line of the solid-gas interface and the tangent line of the gas-liquid interface is the contact angle.The contact angle can be calculated by the following expression:
whereγlg,γls, andγsgare the gas-liquid, solid-liquid and solid-gas interfacial tensions,respectively.
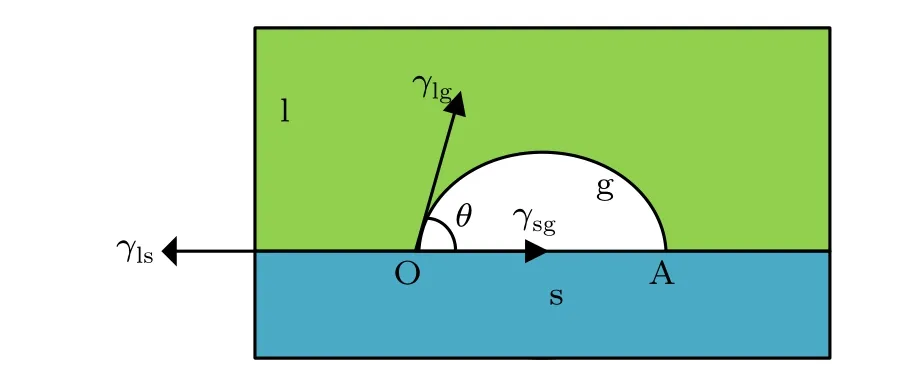
Fig.1.Relationship between dendrites and bubbles at different temperature gradients.
There is a relationship between the contact angleθwhen it has three specific values and the flow-fluid interaction coefficientGcin Eq.(13)and the flow-solid interaction coefficientGadsin Eq.(23)
whereψis a function that calculates the effective density of the fluid with the expression of Eq.(14).
Equation(25)can be understood as follows:whenθ=0°,i.e., there is no gas-phase portion above the unit circle at the contact point O in the schematic diagram of Fig.1,so only the solid-phase portion and the liquid-phase portion remain in the unit circle.At this point the density of the phase above the unit circle at the contact point O is only the density of the liquid phase.Whenθ=180°,it follows from the same reasoning that the density of the phase above the unit circle at the contact point O at this point is only the density of the gas phase.Whenθ=90°, at this point, the upper left part of the unit circle at point O has only the liquid phase portion,and the upper right part has only the gas phase portion, so the density above the unit circle at point O is half of the sum of the density of the gas phase and the density of the liquid phase.
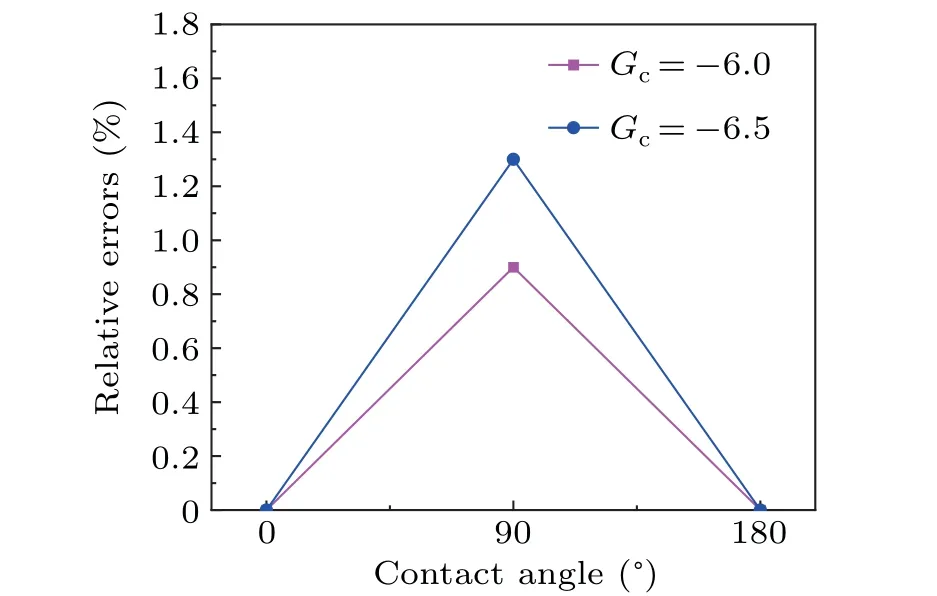
Fig.2.Relative errors of the three special contact angles with respect to the contact angles obtained by simulation.
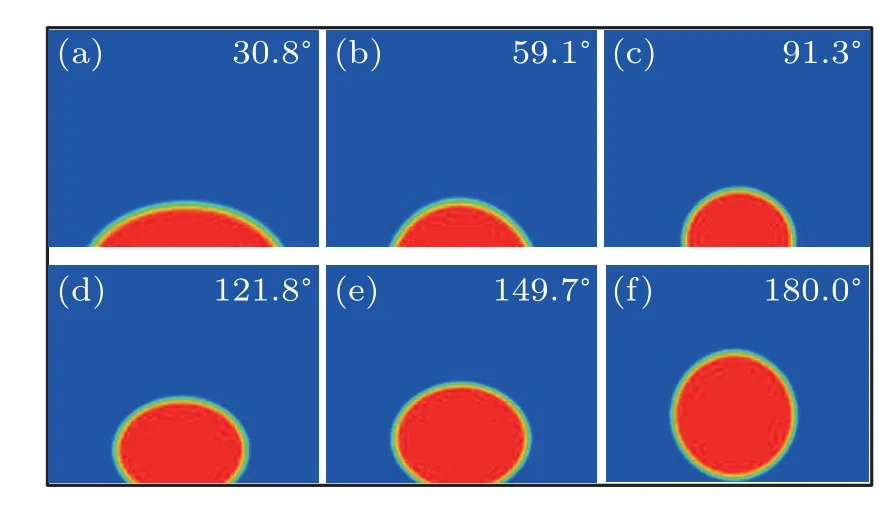
Fig.3.Morphology of the bubbles on the surface of the smooth solid phase: (a)Gads=-4.77,(b)Gads=-3.90,(c)Gads=-3.03,(d)Gads=-2.16,(e)Gads=-1.29,(f)Gads=-0.42.
In the cases ofGc=-6.0 andGc=-6.5, respectively,theGadstheoretical values of the three special angle values are calculated,and then theGadstheoretical values are substituted into the model for calculation, and the obtained contact angle simulation values are compared with the three special contact angle values,respectively,to calculate the relative errors.Equation(26)is used to calculate the size of the obtained contact angle simulation values and format(27)is used to calculate the contact angle simulation values and special contact angle relative errors,respectively,
In Eq.(26),His the value of the length of the vertical line from the highest point of the bubble to the surface of the solid phases,andLis the value of the bottom of the contact between the bubble and the surface of the solid phases, i.e., the value from point O to point A in the schematic diagram of Fig.1.In Eq.(27),ERis the relative error,θsis the simulated angle of the obtained contact angle,andθtis the theoretical value of the three special contact angles.The simulation region is set to be 120×120,the initial density of the liquid phaseρl=2.8,the initial density of the gas phaseρg=0.07,the relaxation time of both phases is 1.0, and the initial radius of the bubbleRis set to be 15.The bottom boundary condition of the model is used to simulate the solid phase,and the rest of the boundaries are used for the periodic condition.From Fig.2,it can be seen that the relative error does not exceed 2%,which indicates the correctness of our model.Figure 3 shows the different contact angle topographies resulting from the contact of a bubble with a smooth solid phase surface under theGc=-6.0 condition.The red region in the figure is the bubble and the surrounding red-blue region is the liquid phase.From the figure, it can be seen that the contact angle obtained from the simulation is gradually increasing as the fluid-solid interaction coefficientGadsincreases,i.e.,the wettability between the fluid phase and the solid phase is gradually decreasing.
3.Results and discussion
3.1.Interaction between dendrites and bubbles at different temperature gradients
In the numerical simulation of directional solidification of alloys,numerous physical parameters have a significant impact on the morphology changes of dendrites, and dendrite morphology is of great significance for studying the interaction between dendrites and bubbles.Therefore, statistical characterization of some interesting quantities and exploring the internal mechanisms of research from different appearances are issues that we are more concerned about.Among them, temperature gradient and anisotropic strength are the two main factors that affect the morphology of dendrites.
Figure 4 demonstrates the morphological changes of the interaction between dendrites and bubbles under different temperature gradient conditions.At the beginning of the simulation, we set up a region as a square of 800×800 grids,and three directionally growing dendrite nuclei were set up in the region at the beginning of solidification.With time, the dendrites began to grow slowly and the solid-liquid interface gradually advanced upward.The density of the liquid at the left bottom of the region is lower than that of the liquid at the right bottom, and the high-density region is gradually transformed into a solid state with the prolongation of solidification time.According to the law of conservation of energy,the density of low density areas will decrease.When the liquid density drops to the critical value of the solid-liquid interface,the hydrogen concentration in the dendrites gap will exceed the hydrogen concentration at the initial solidification,resulting in the formation of bubbles.Due to the tendency of high-density areas to promote bubble formation,bubbles are more likely to form and develop within the area.This process indicates that in the early stage of solidification, dendrites and bubbles will grow together, and high-density liquid regions are conducive to the formation of bubbles.
At low temperature gradients, as shown in Figs.4(a1)-4(a3), the solute content around the solid-liquid interface is higher,resulting in a relatively low concentration of the liquid phase, which generates some small bubbles in the dendrites interstices.Due to the hydrogen concentration difference,the growth of dendrites simultaneously inhibits the gas bubbles from entering the liquid phase, and the solute concentration around the solid-liquid interface is higher than that elsewhere,which provides the conditions for the gas bubbles to be transformed.Bubbles between dendrites have an important effect on dendrite growth.Gas bubbles start in a dispersed state,but they fuse together due to the pressure difference at the solidliquid interface.Thus, bubble formation promotes dendrite growth,and in the middle stage of solidification,the high concentration of solute inhibits the growth of secondary dendrite arms.
As the temperature gradient is further increased,as shown in Figs.4(b1)-4(b3), the gas bubbles absorb hydrogen atoms around the surrounding liquid-phase dendrites during growth,leading to overflow,enlargement and fusion.As the secondary dendrite arms grow and the bubbles enlarge and fuse,the liquid and gas generate different pressures, creating a pressure difference in the interstitial space.This causes the bubbles to move irregularly between the dendrites, being squeezed from the secondary dendrite arms into the interstices of the dendrite arms,causing the bubbles to deform,or fuse with another bubble.For example,the bubble M1 in Figs.4(b1)-4(b3)initially appears within the secondary dendrite arm, and as solidification proceeds,the bubble increases in size and passes through the secondary dendrite arm to the primary dendrite arm gap M2.The increase in size and deformation of the bubbles is accompanied by the growth of the dendrites, resulting in the formation of bubble M3,which takes on different shapes.
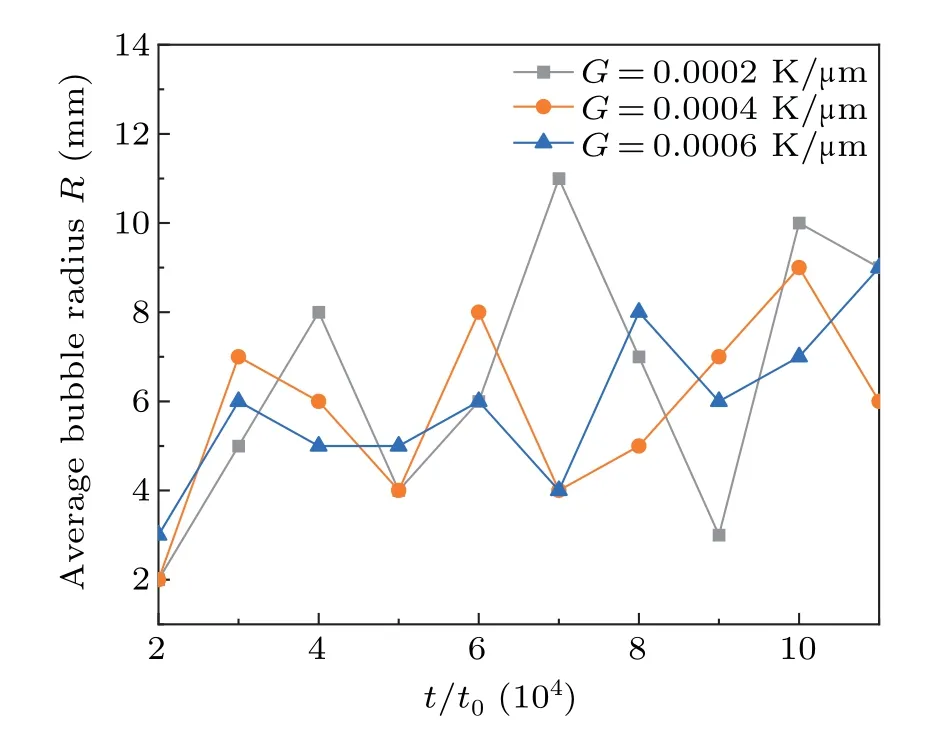
Fig.5.Evolution of bubble mean radius with time step for temperature gradients of G = 0.0002 K/µm, G = 0.0004 K/µm, and G =0.0006 K/µm.
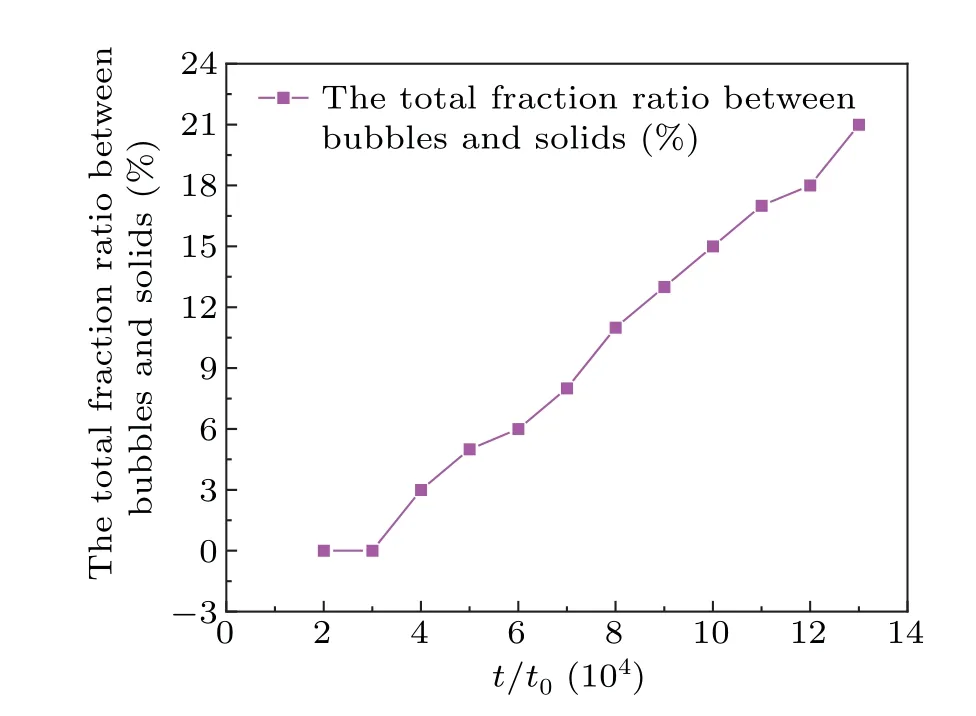
Fig.6.Evolution of the total fraction ratio between bubbles and solids for temperature gradients of G=0.0002 K/µm,G=0.0004 K/µm,and G=0.0006 K/µm.
When the temperature gradient increases to 0.0006, as shown in Figs.4(c1)-4(c3),the initial bubble N1 grows in the interstices of the dendrites,and the co-growth of the dendrites and bubbles leads to the extrusion and deformation of the bubble at N2, forming two parts.As the dendrite grows over a larger area, the bubble at N3 is more significantly extruded and deformed.Over time,the growth of dendrites and bubbles compete together for growth space, and the growing bubbles absorb solute excretion,contributing to the growth of dendrites and the development of secondary dendrite arms.At the same time, there is also competition between bubbles, while some bubbles grow,other bubbles may disappear or fuse,and large bubbles are more likely to aggregate with surrounding small bubbles to form irregular large bubbles.Figure 5 shows the variation curves of the average radius of bubbles with time step for temperature gradientGat 0.0002, 0.0004 and 0.0006, respectively.It can be seen that the curve fluctuates more whenG=0.0002.As the temperature gradientGreaches 0.0006,the bubble radius becomes smaller and has better continuity.Figure 6 shows the variation curves of the total fraction ratio between bubbles and solids for temperature gradientGat 0.0002, 0.0004 and 0.0006, respectively.The curves in the figure show that the bubbles are formed gradually during the solidification organization process, the radius of the bubbles is getting bigger and bigger, and the dendrites do not stop growing because of the appearance of the bubbles,but are still growing.The curve shows a monotonous upward trend, and the bubble continues to get bigger and bigger accompanied by a decrease in the ratio of bubble to solid, and finally until stabilized, which shows that the bubble has a great role in promoting the solidification of dendrites.
3.2.Interaction between dendrites and bubbles at different anisotropic strengths
Under different anisotropic strength conditions, we perform simulations of dendrite growth and stomatal evolution modeling to quantitatively explore the effect of anisotropic strength on the interaction between oriented columnar dendrites and bubbles during solidification.We set the computational range as a square area of 800×800 grids,each of which represents a computational grid.The temperature gradient in the whole area is assumed to be uniform and the pulling speed is kept constant.The anisotropy intensity is increased from 0.02 to 0.06 to observe the evolution process of dendrites and bubbles.
At the beginning of the solidification simulation, we set up three initial nuclei in the calculation area.As the solidification process advances, the number of dendrites starts to increase,and it can be clearly observed from Fig.7 that the oriented dendrites and pores change with time, and the primary dendrites grow gradually and interact with the bubbles.From Figs.7(a1)-7(a3), it can be seen that when the anisotropic strength is small, the primary dendrites are thicker and generate a large number of secondary dendrite arms.At the same time,solutes accumulate in the gap between the primary dendrite and the secondary dendrite arms, and the growth of the secondary dendrite arms is slowed down by the accumulation of solutes.When the dendrite grows to a critical value, hydrogen bubbles emerge from the low end of the dendrite(e.g.,at L1) and then continue to increase until the local hydrogen concentration falls below the hydrogen saturation or the dendrite grows around it hindering the growth of the bubbles.And the lush secondary dendrite arms keep colliding with the bubbles, forming a squeeze on the bubbles, and then the bubbles deform,and part of the bubbles will be divided into two parts by the secondary dendrite arms.Some other bubbles are compressed by the secondary dendrite arms, which leads to the fusion phenomenon, as in Figs.7(a1)-7(a3), the bubbles at L1 gradually migrate and fuse together (at L2).With the increase of the time step,the volume fraction of microhydrogen bubbles increases, and the pores also increase, and when the pressure difference in dendrites is larger than the critical value of the bubbles it will divide the bubbles into two parts (e.g.,at L3),and the density of the bubbles is not much affected by the increase of the time step.It is worth noting that the solutes released from the solid phase in the dendrites gap cannot be completely discharged and accumulate in the dendrites gap resulting in the inability of the secondary dendrites arms to continue to develop,and the effect of the secondary dendrites arms on the bubble will gradually slow down.
With the further increase of the anisotropic strength,the primary dendrite spacing becomes correspondingly larger and the secondary dendrite arms gradually decrease whenε4=0.04.At the same moment, compared with the smaller anisotropy strength,the interaction between the dendrites and the bubbles slows down,and the deformation rate of the bubbles decreases significantly.As shown in Figs.7(b1)-7(b3),due to the content of hydrogen concentration of bubbles in the dendrite organization growth process is less than the concentration in the dendrite, bubbles are crowded by the dendrite piled together, such as M1, the dendrite’s continuous growth process, the density of the dendrite is greater than that of the hydrogen bubbles that is divided into two sections, such as M2, with the increase of the time step, the dendrite channel bubbles accompanied by dendrites competing for the growth of the dendrite infinite close to the connected together(e.g.,at M3).
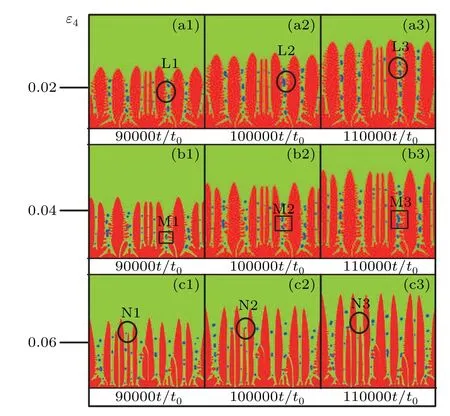
Fig.7.Relationship between dendrites and bubbles under different anisotropy.
Whenε4=0.06,the overall morphology of the dendrite becomes elongated, only part of the dendrite has weak secondary dendrite arms,and the surface of the primary dendrite arms of the rest of the dendrite is nearly smooth.As shown in Figs.7(c1)-7(c3),only a small number of secondary dendrite arms are in contact with the bubbles, and the primary dendrite arms of the rest of the dendrites have less contact with the bubbles,and the interaction between the two is very weak.Among them, the dendrite at N1 will be close to the bubble during the growth process,and when the bubble grows to the tip of the dendrite,it will be interspersed by the tip of the dendrite through the bubble to divide the original bubble into two bubbles of different sizes (as shown at N2).Until the liquid phase that grows to the solid-liquid interface contains more hydrogen than in the hydrogen bubbles, it engulfs the small bubbles,causing them to disappear(shown at position N3).
As shown in Fig.8,we count the average radii of the bubbles under different anisotropic strength conditions.It is worth noting that, when the anisotropy strength is increasing, along with the primary dendrite arms become finer and their number increases,and the surface of the dendrite is also gradually smooth, the secondary dendrite arms are reduced, and the interstitial channel between the dendrite arms is wider, and the dendrite gradually reduces the pressure on the bubbles,resulting in the bubbles from more continuity to the existence of a separate dendrites channel, which is less prone to the splitting and fusion phenomena.It can be found that the larger the anisotropy strength is,the more stable the curve fluctuation expressed by the mean radius of bubbles is, and also due to the reduction of fusion phenomenon of different bubbles,thus the mean radius of bubbles is also relatively reduced.
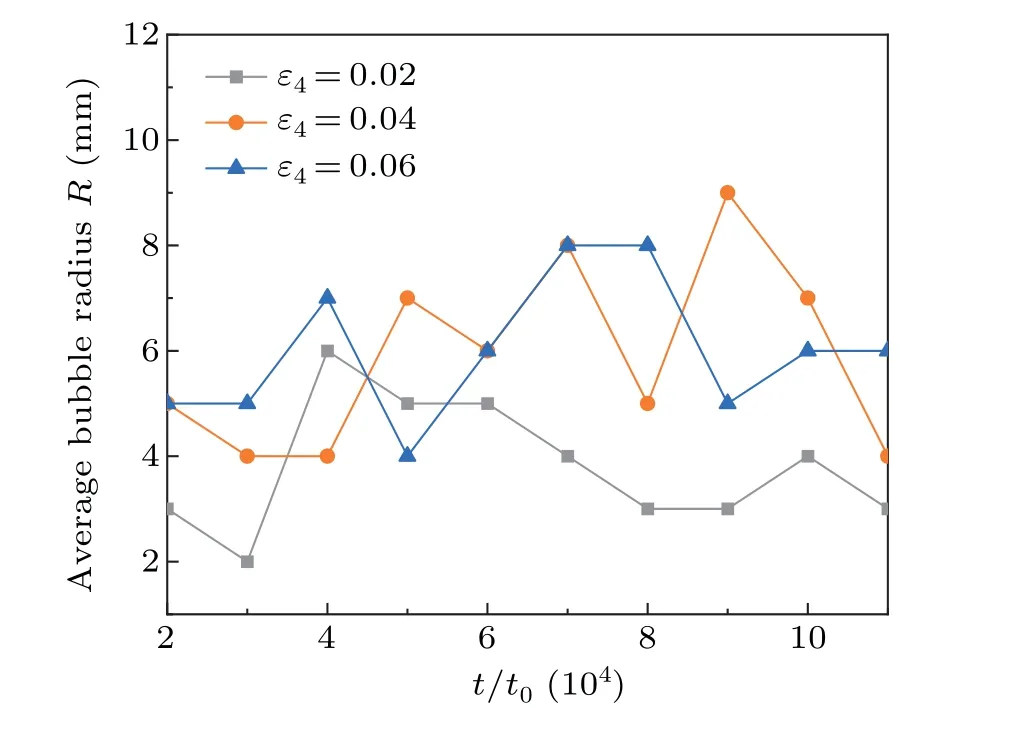
Fig.8.Variation curves of bubble mean radius with time step for anisotropy strengths of ε4=0.02,ε4=0.04,and ε4=0.06.
3.3.Interaction of tilted dendrites with gas bubbles
The interrelationship between dendrites and gas bubbles during directional solidification at an initial angle of dendrite growthΘi0=70°is illustrated in Figs.9(a1)-9(a3).As the solidification process progresses,due to the relatively low solubility of hydrogen atoms in the solid phase, the hydrogen atoms are repelled by the solid-liquid interface and thus undergo migration into the liquid phase.When the hydrogen concentration in the liquid phase exceeds a critical value,bubbles begin to form and start generating from the interstices of the dendrites and move irregularly,in which case the morphology of the dendrites will not be changed by the deformation of the bubbles.Bubbles show irregular motion patterns as they are captured by the solid phase.The coupled growth of bubbles and dendrites leads to the appearance of micropores in the solidified tissue.It is well known that the defects in the microstructure due to bubble generation are mainly due to the trapping of bubbles at the solid-liquid interface.The interaction between bubbles and dendrites directly determines the formation of defects in the microstructure.In Fig.9(a1) at L1 the bubble does irregular movement between the dendrites,due to the solid-liquid interface and the different densities of the hydrogen bubbles,the bubble is divided into two sections by the dendrites while passing through the dendrites, and the bubble absorbs the hydrogen atoms from the dendritic interstices into itself during the growth of solidified tissues,so that the two sections of the differently shaped bubbles undergo deformation and are fused together (e.g., Fig.9(a2)).With the continuous growth of the dendrite,hydrogen atoms will be excluded by the solid-liquid interface,which will lead to the reduction of hydrogen atoms in the liquid phase,along with the growth of bubbles, the microstructure of the dendrite grows relatively fast, when the bubble encounters the dendrite during the growth process,its growth will be inhibited,and in the dendrite gap in the new position with other bubbles connected together to form a worm-like bubble as shown in Fig.9(a3).It is worth noting that due to the tilted growth of the dendrite,the growth direction of the secondary dendrite arm on the left side of the dendrite is closer to the direction of the temperature gradient, resulting in the secondary dendrite arm on the left side of the dendrite being relatively more developed,which will be more helpful for the interaction between the dendrite and the bubbles,resulting in bubbles being more susceptible to deformation and the phenomena of multi-bubble fusion and bubble splitting.
Figures 9(b1)-9(b3) reflect the interaction between dendrite and bubble when the initial angle of dendrite growth is 70°and 90°,respectively.Dendrite A is grown along the direction of temperature gradient, and the preferential orientation angle of dendrite B is 70°.Dendrite A and dendrite B show convergence in the left layer region and divergence in the right side, and the interstitial channels of converging bicrystals are narrower than those of parallel dendrites, and the interstitial channels of diverging bicrystals are wider than those of parallel dendrites.Bubble growth exists in the interstices of the dendrites,and the continuous growth of the dendrites with tilt angles of 70°and 90°creates the convergence phenomenon,and the bubbles are located above the dendrites at this moment(as in Fig.9 M1).Subsequently, with the continuous growth of the dendrites,the bubble grows to be in infinite contact with the converging dendrites on both sides(as in Fig.9 M2).
When the dendrite contacts the bubble, the gap between the converging dendrites decreases, the bubble is compressed and deformed, and finally the bubble is squeezed by the converging dendrites in three directions in the shape of a flower(as in Fig.9 M3).In the space of divergent twin crystals on the right,the bubble(as in Fig.9 N1)is sandwiched in a narrow channel and squeezed into a strip shape by the secondary dendrite arms.As the dendrite continues to grow, the angle between the two dendrites grows wider and wider, giving the bubbles enough space to migrate in motion.The bubbles pile up into the wide channel (as in Fig.9 N2).When the angle is large enough,the bubbles are extruded from the narrow channel to the uppermost position to fuse with other bubbles to form larger bubbles (as in Fig.9 N3).It can be seen that when the bubbles located in the gap between the dendrites interact with the dendrites at different inclination angles, when the bubbles are located between the converging dendrites,the bubbles will be squeezed more obviously, and the interaction between the dendrites and the bubbles will be more intense.When the bubbles exist in the space formed by the divergent bicrystals,due to the gap between the bicrystals is expanding,and the bubbles will have a narrow channel through the divergent tendency of the dendrites to be squeezed into the larger dendritic gaps to form large bubbles.
Figure 10 shows the curves of the average radius of bubbles with time when the growth angle of both kinds of dendrites is 70°.It can be seen that when the growth direction of the dendrites is the same, the gap between the dendrites is more uniform,the radius of the bubbles is in a constant state,and their areas are roughly the same, which is smoother and less volatile in the curve.Figure 11 reflects the curve of the average radius of the bubbles as a function of the time step when the bicrystal forms a pinch point.When the dendrites perpendicular to the 70°dendrites to form the angle, such as Fig.11,AΘi0=70°dendrites gap from wide to narrow the formation of convergent dendrites, the bubble will be squeezed from large to small.The radius of the curve tends to decrease from large to small downwards, and vice versa the formation of evanescent dendrites bubbles within the narrow channels of the dendrites.As the dendrites diverge, the gap suddenly becomes larger, and under pressure the bubbles rush out and become larger in the narrow channel.
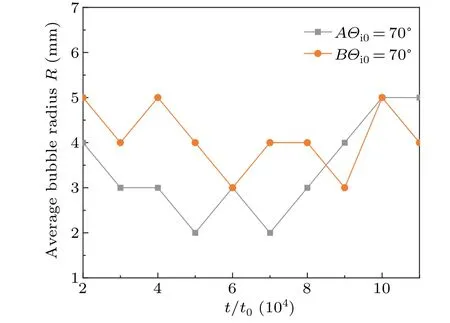
Fig.10.Curve of average radius of bubbles versus time for growth angle of 70° for both dendrite AΘio and dendrite BΘio.

Fig.11.Curve of average radius of bubbles versus time when dendrite A and dendrite B are formed at angles of AΘi0=70° and BΘi0=90°.
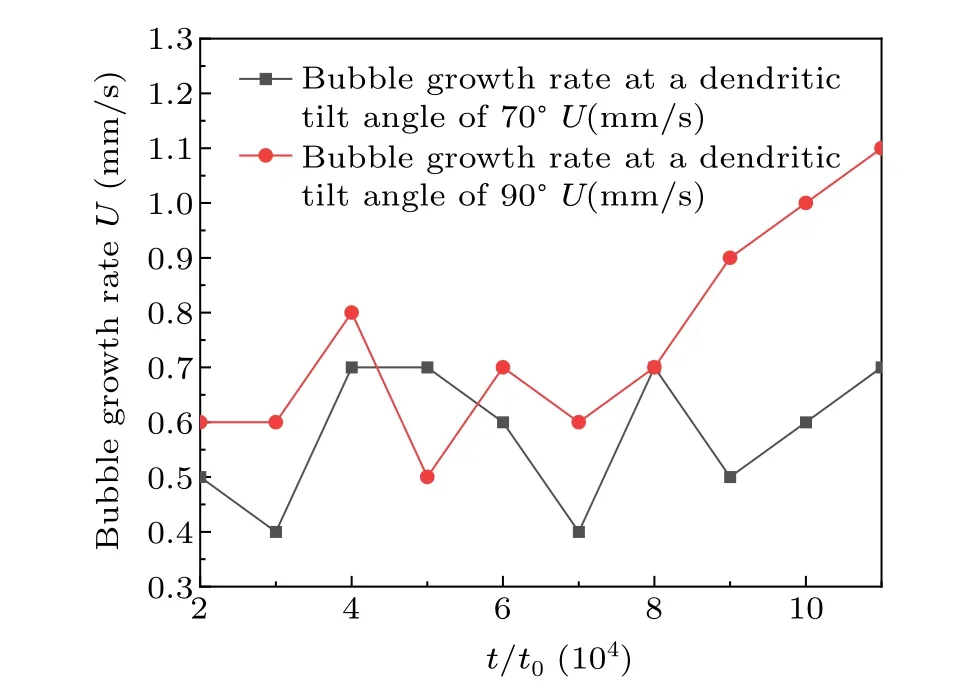
Fig.12.Relationship between bubble growth rate and time step for different dendrite growth angles.
Figure 12 examines the bubble growth rate curves of dendrite A and dendrite B under different growth angles.When the growth angle of both dendrite A and dendrite B is 70°,the gap channel between dendrites is narrower,the size of bubbles is relatively uniform, the bubble movement is in a relatively uniform speed, and the bubble growth rate curve is relatively smoother.When the growth angle of dendrite A is 70°, the growth angle of dendrite B is 90°, the bubble growth rate at the beginning of solidification is in a smooth state, with the formation of dispersive bicrystals, the solid-liquid interface and the pressure difference between the hydrogen pore lead to the bubbles be rushed out to the wider channels to migrate a little faster.
4.Conclusion
A multiphase field model coupled with an LBM model is successfully proposed.For in-depth investigation of the complex phenomenon of solid-liquid-gas interactions between the three phases of an alloy during solidification.With this model,we are able to simulate the distribution mechanism of bubbles and solutes at the solid-liquid interface to explore the interactions between dendrites and bubbles, as well as the effects of different temperatures,anisotropies,and tilt angles on the solidification organization.In this study, we have drawn some interesting conclusions and findings through an in-depth analysis of the relevant physical parameters and elucidated the physical mechanisms of bubble nucleation, growth and kinematic evolution during solidification as well as the interactions with the growth of dendrites.
First, our simulation results show that during the directional growth of columnar dendrites, bubbles will precipitate out at the bottom of the dendrite gap, and then gradually rise due to the differences in solid-liquid densities and differential pressures, and this process involves interactions between the bubbles and the dendrites,such as extrusion,spillage,fusion,and disappearance.All these phenomena have a significant effect on the solidification organization.
Secondly,in cases where the gap between dendrite channels is wide,bubbles have more opportunities to fuse and form irregularly larger bubbles.At the dense channels,the bubbles are deformed by the extrusion of the dendrites.This suggests that the channel structure has an important influence on the evolution and morphology of bubbles,which is of great engineering significance in the actual solidification process.
Finally,our study also reveal that with the divergence and convergence of dendrites in the simulation area, bubbles will precipitate out under the compression and diffusion of dendrites, and also lead to physical phenomena such as bubble fusion and overflow.This phenomenon manifests the dynamic complexity of the solidification process and provides a strong theoretical basis for better understanding and controlling the material solidification process.
This study has successfully investigated in depth the interaction between bubbles and dendrites during the solidification process through the application of the PF-LBM model,which provides important insights into our understanding of the physical mechanisms involved in the solidification process of materials.These research results not only help to optimize the solidification of industrial arts of materials, but also provide strong support for related engineering applications and useful information for further development in the field of materials science and engineering.In the future,we can continue to extend this model to deepen our understanding of the microscopic phenomena in the solidification process and to promote further research in related fields.
Acknowledgments
Project supported by the National Natural Science Foundation of China (Grant Nos.52161002, 51661020, and 11364024), the Postdoctoral Science Foundation of China(Grant No.2014M560371), and the Funds for Distinguished Young Scientists of Lanzhou University of Technology of China(Grant No.J201304).
猜你喜欢
鸭绿江·华夏诗歌(2021年10期)2021-05-12
速读·中旬(2018年7期)2018-08-17
小学阅读指南·低年级版(2017年3期)2017-03-23
数学学习与研究(2017年3期)2017-03-09
High Technology Letters(2016年1期)2016-12-06
儿童故事画报(2015年10期)2016-01-26
幼儿智力世界(2015年5期)2015-08-20
幼儿智力世界(2015年6期)2015-08-17
幼儿智力世界(2009年9期)2009-10-22
幼儿智力世界(2004年2期)2004-03-23

- Chinese Physics B的其它文章
- Does the Hartman effect exist in triangular barriers
- Quantum geometric tensor and the topological characterization of the extended Su–Schrieffer–Heeger model
- A lightweight symmetric image encryption cryptosystem in wavelet domain based on an improved sine map
- Effects of drive imbalance on the particle emission from a Bose–Einstein condensate in a one-dimensional lattice
- A new quantum key distribution resource allocation and routing optimization scheme
- Coexistence behavior of asymmetric attractors in hyperbolic-type memristive Hopfield neural network and its application in image encryption