
Studying the co-evolution of information diffusion,vaccination behavior and disease transmission in multilayer networks with local and global effects
2024-03-25 09:30LianganHuo霍良安andBingjieWu武兵杰
Chinese Physics B 2024年3期
Liang’an Huo(霍良安) and Bingjie Wu(武兵杰)
1Business School,University of Shanghai for Science and Technology,Shanghai 200093,China
2School of Intelligent Emergency Management,University of Shanghai for Science and Technology,Shanghai 200093,China
Keywords: information diffusion,vaccination behavior,disease transmission,multilayer networks,local and global effect
1.Introduction
Infectious diseases have always threatened people’s lives,from smallpox to the SARS virus to today’s global pandemic public health emergency, COVID-19,[1,2]which resulted in considerable numbers of deaths and changed people’s lifestyles.These major public health safety problems are endangering people’s physical and mental health and hindering social and economic development.[3-5]Increasing numbers of experts and scholars are studying disease transmission patterns and clarifying disease transmission mechanisms to better control and prevent disease transmission.[6]
Several studies have proposed various classical models of infectious diseases to clearly describe the process of disease transmission, such as the susceptible-infected-susceptible(SIS)model[7,8]and the susceptible-infected-recovered(SIR)model.[9,10]Meanwhile, the susceptible-exposed-infectedrecovered(SEIR)model[11]was proposed to describe the disease transmission pattern as a way to take better measures to control the transmission of diseases.In recent years,with the rapid development of complex networks, more studies have been conducted using complex networks to analyze disease transmission,more closely to the real network.[12,13]Newmanet al.[13]used complex networks to build multiple methods and models to help better understand the dynamic process of disease transmission over the network.Buonoet al.[14]studied disease transmission models in partially overlapping complex networks and found that vaccination or isolation of only the layers with higher transmission capacity could significantly reduce the transmission threshold of the network.
During disease outbreaks, we obtain disease-related information from various sources, such as online media and surrounding neighbors, to understand the risks of disease.We then take appropriate protective measures, such as washing hands frequently, wearing masks outside, and isolating ourselves at home, and these conscious behavioral responses will inhibit the transmission of disease to some extent.Many scholars analyze disease transmission patterns based on the framework of a complex network theory, and use a new way to study how disease-related information, individual conscious reactions, and individual behavior affect disease transmission.[15-21]Funket al.[15]used the SIR model to analyze disease transmission patterns and studied the influence of disease awareness on disease outbreaks,and the results showed that awareness transmission can reduce the scale of disease transmission.Granellet al.[17]established a two-layer coupled network model to analyze the relationship between information and disease transmission,and found that information diffusion affects the disease transmission threshold; the simulation results showed that at the meta-critical point, the diffusion of awareness can effectively control the transmission of disease.In practice, the different information perception abilities of individuals and the different conscious responses of different individuals who are informed of information also have an impact on disease transmission.[22-26]Sunet al.[22]studied the asymmetric interaction between disease transmission and consciousness diffusion in multiple networks, distinguishing susceptibility and infectiousness between conscious and unconscious individuals, and the results showed that the introduction of self-awareness in infected individuals increased.Changet al.[25]investigated the effect of the heterogeneity of information layers on disease transmission thresholds,and showed that weak heterogeneity of information layers was more effective in inhibiting disease transmission than strong heterogeneity when the rate of consciousness transmission was within a certain range.In addition, by considering that individuals are informed of different sources of diseaserelated information, some scholars have analyzed the effects of mass media-disseminated information and neighborhooddisseminated information in the information layer on disease transmission.Granellet al.[27]and Xiaet al.[28]used a model to study the role of mass media-disseminated official information in disease and information diffusion,and analyzed the effects of different sources of competing information diffusion mechanisms on disease transmission; the results showed that official information played an important role in inhibiting disease transmission.Some studies found that different types of information also have different effects on disease transmission.Wanget al.[29]extended the UAU-SIS model to classify information into positive and negative information, and analyzed the effects of both types of information on disease transmission thresholds, the results showed that negative information can promote the transmission of disease, and positive information can effectively inhibit the transmission of disease.Yinet al.[30]used the UAU-SIS model to analyze the effects of negative information on vaccination behavior and disease transmission.They found that negative information leads to a decrease in individuals’willingness to be vaccinated, increases the probability of infection,and can promote the transmission of disease.
In addition,some scholars considered that different individuals have different impacts on the perception of information and disease, and may also produce different emotional changes; therefore, they further studied its impact on the disease transmission process with individual heterogeneity and individual emotional changes.[31-39]Xuet al.[31]considered the effects of individual heterogeneity on disease transmission and analyzed the effects of heterogeneity on the degree of local and global disease perception within layers;the results showed that individual heterogeneity has a large effect on the proportion of disease transmission.Duet al.[32]developed a threelayer network model to analyze how social media and human behavior affect disease transmission.Here, individuals form risk perceptions of diseases through multiple sources of information,and this risk perception affects individuals’behavioral adoption, which in turn affects disease transmission.Nieet al.[39]studied the effects of homogeneous competitive behavior on the propagation dynamics of heterogeneous populations in a higher-order interaction network.The most effective protective measure when an epidemic breaks out is vaccination,which is more efficient at reducing the probability of infection and the proportion of disease transmission.[30,34-37,40-44]Zuoet al.[35]proposed a new SEIR/V-AI model to study the interaction between vaccination behavior and hip-hop,and the results showed that individual sensitivity to information affects individual vaccination behavior.Jainet al.[37]analyzed the effects of fear generated by individuals during disease transmission on information diffusion.Kabriet al.[39]considered the effects of vaccination strategies on disease transmission to better understand actual disease transmission patterns.
As we can see from the above,most of the current studies usually assume that information dissemination directly affects disease transmission,and consider that all individuals who are informed will take immediate action, which integrates information and individual behavior,and ignores the heterogeneity of the behavior of individuals with known information.However, the assumptions of the previous studies are correct to some degree, while not entirely true.The actual control process of disease transmission is very complex and is affected by many factors, such as information and behavior.If the individuals who know the information do not have any behavioral response or adopt protective behavior,the probability of these individuals being infected will not be changed, and the information dissemination will not affect the transmission of the disease at this time.Only if the individuals who know the information and adopt certain protective behavior to fight the disease, such as vaccination to improve immunity and wearing masks, will the probability of being infected be reduced,and only then will it affect the process of disease transmission.Therefore, we can see that information diffusion does not directly affect disease transmission;it first affects individual behavior, and individual behavior further affects the process of disease transmission.In the process of a disease outbreak,the dissemination of information will affect the choice of individual vaccination behavior,while the individual’s choice of vaccination will also affect the dissemination of information;similarly, an individual’s vaccination will affect the transmission of the disease process,while the scale of disease transmission will also affect the individual’s willingness to vaccinate to a certain extent.However, while some papers have considered one or only a few of the above factors, there have been few studies on the coupling between the layers of information dissemination, vaccination behavior and the transmission of the disease.
Based on this,we established a three-layer network model to investigate the co-evolution of information,vaccination,and disease transmission,and considered four influential relationships between adjacent layers.This paper considers the unidirectional process of information dissemination affecting individual behavior,and individual behavior affecting disease dissemination.Meanwhile, we consider the reverse process of disease dissemination to individual behavior, and individual behavior to information dissemination.We introduce the concepts of local and global, which can more comprehensively and carefully describe the transmission process of disease prevention and control, and portray the inner mechanism of disease transmission.The first layer is the information layer,which describes the diffusion of negative information by considering the strength of the effects of local and global feedback in the behavioral layer on individuals’willingness to believe negative information.The second layer is the behavioral layer,describing the choice of individuals’vaccination behavior.Here, the probability of an individual receiving vaccination is influenced by two factors: the influence of the information layer, and the influence of the disease layer, by considering local and global individuals’nervousness about the disease.The third layer is the disease layer,which describes the transmission of disease; the influence of the individuals’susceptibility is considered based on vaccination behavior.Epidemic thresholds are derived using the micro Markov chain approach (MMCA).Finally, a simulation analysis is performed to describe the co-evolution information, behavior, and disease.During the course of the experiment,we obtain interesting results that show that negative information dissemination is mainly affected by global vaccination behavior and is basically unaffected by local vaccination behavior; meanwhile,vaccination behavior is mainly affected by the local disease situation and basically unaffected by the global disease situation.Furthermore, in the experiment, we also find that the vaccination rate affects the threshold of disease transmission and, the larger the vaccination rate, the larger the threshold of disease transmission.At the same time,when studying the influence of information and behavior on the transmission of disease, we find that the smaller the rate of transmission of negative information and the larger the vaccination rate, the smaller the scale of disease transmission and the more conducive to control the transmission of disease.
The rest of the paper is organized as follows: we introduce the multilayer network coupled model of information,behavior and disease, and its transformation process in Section 2.We analyze the model using the micro Markov chain approach(MMCA)and derive disease transmission thresholds in Section 3.We perform numerical simulations and present our simulation results to validate our analysis in Section 4.We conclusions are presented in Section 5.
2.The three-layer network coupled model
In practice, the information does not directly affect disease transmission,but individuals who are informed make corresponding behavioral responses to influence disease transmission.For example, at the beginning of COVID-19, there were multiple types of negative information about the vaccine,and individual’s willingness to vaccinate was low; thus, the probability of being infected greatly increased.The outbreak of disease would trigger individuals’ nervousness and fear of the disease, which in turn increases individuals’ willingness to vaccinate, and there will be interactions between adjacent layers.Firstly, the diffusion of negative information is influenced by feedback from the behavioral layer,when individuals learn that the proportion of vaccination is larger, individuals are more likely to choose to believe in the vaccine.They will be resistant to related negative information, which will affect the rate of the actual information diffusion.Secondly, individual vaccination behavior is influenced by two aspects.The first is the influence of the information layer, when individuals know vaccine-related negative information, they think the vaccine is not mature enough and will produce side effects.Therefore, their probability of vaccination will be reduced.The second aspect is the influence of the disease layer.When individuals think the disease is serious,this will increase their nervousness about the disease which, in turn, will increase their willingness to vaccinate.Finally, disease transmission will be influenced by vaccination behavior and,in the process of disease transmission,individuals’vaccination behavior will reduce individual susceptibility.
Generally, the transmission paths of information, behavior and disease are usually different.For example,information can be transmitted through virtual contacts,such as the internet and social media, while individual vaccination behavior and disease transmission often occur in real physical contact networks.In fact,the regular mechanisms of information,behavior and disease transmission are the same;information dissemination can be seen as a mental level of dissemination,where individuals exchange information between each other through any form of exchange.However, in a physical contact network,individuals influence each other to change their own behavior and,at the same time,will also transmit diseases.Since the processes of information, behavior and disease transmission are closely related, today, most studies reasonably simplify the specific paths of information transmission, vaccination behavior and disease transmission,and assume them to be a coupled interactive transmission process.[15-20,27-29]Along these lines, this manuscript also adopts this simplification of the assumptions, and chooses to build a multi-layer network model(as in Fig.1)to analyze the co-evolution of negative information, behavior, and disease transmission, and considers four influential relationships (I, II, III, IV) between adjacent layers.The model consists of a multiplex network with three layers,where each node in each layer represents each individual, and nodes correspond to each other between layers.The first layer is a virtual contact network-the information layer(UAU) - which is used to describe the process of individuals’ disseminating negative information related to vaccines through social media,whereUrepresents individuals with unknown information andArepresents individuals with known and diffused negative information.The second layer is a physical contact network-the behavior layer(WVW)-which is used to describe individual vaccination behavior,whereWrepresents unvaccinated individuals andVrepresents vaccinated individuals.The third layer is a physical contact networ-the disease layer(SIS)-which is used to describe the process of disease transmission through close contact among individuals,whereSrepresents susceptible individuals andIrepresents infected individuals.The network model transmission process is assumed as follows:
Assumption 1 In the information layer, the negative information diffusion process is described by theUAUmodel,which includes two states,UandA.When individuals in theUstate contact with neighbors in theAstate, and individuals in theAstate diffuse negative information with the probability ofλ, the willingness of individuals in theUstate to believe negative information will be affected by the behavioral layer,as in effect IV in Fig.1.This occurs by learning the feedback on vaccines from the surrounding neighborhoods or the whole network group, which will affect the true rate of information diffusion.
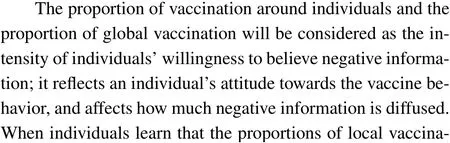
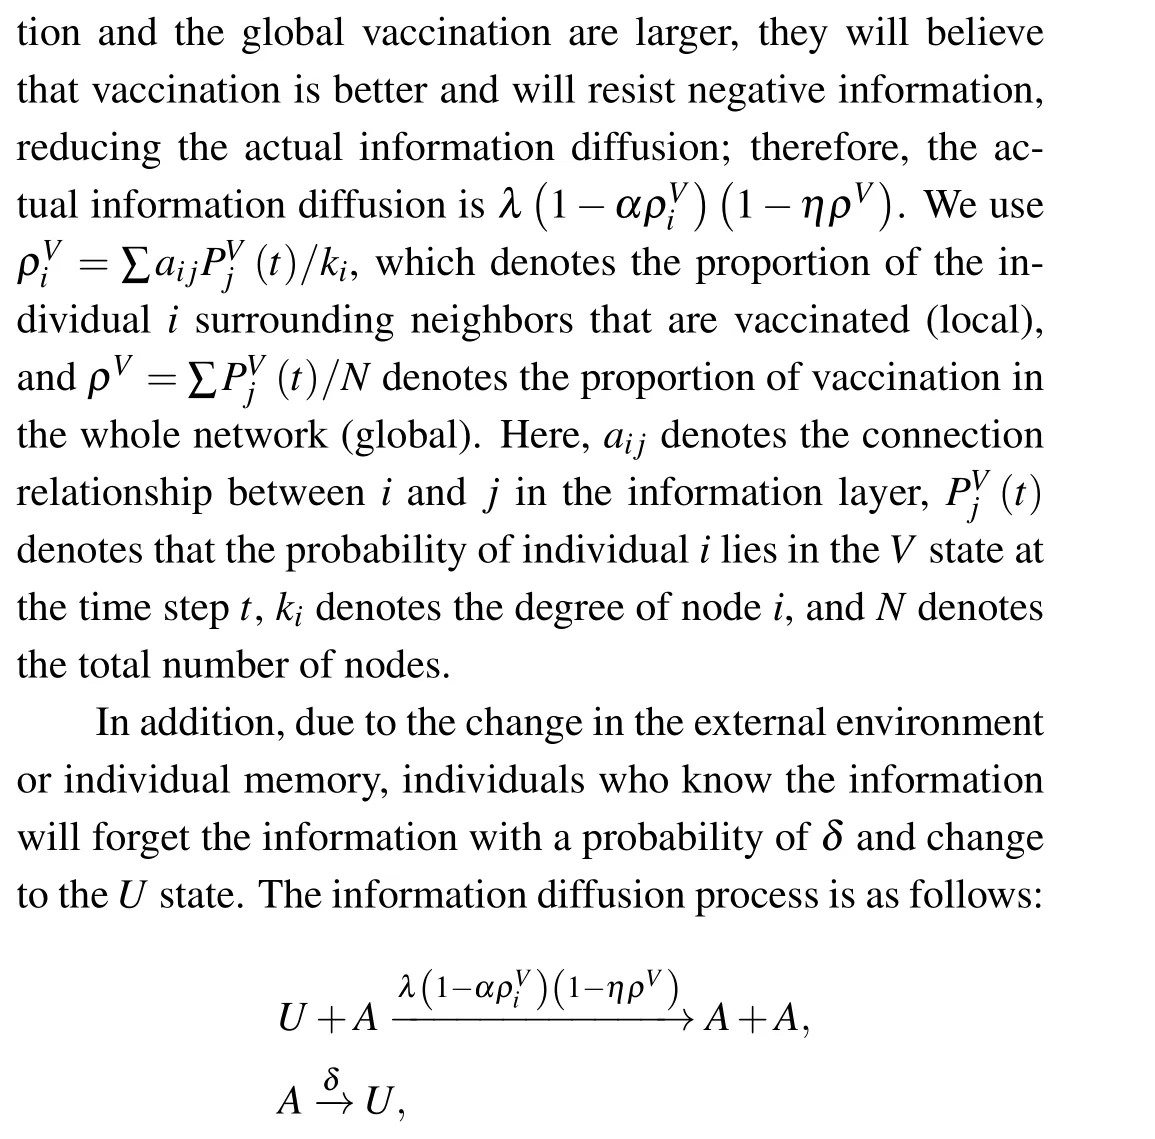
whereαdenotes the intensity of the effect of the proportion of locally vaccinated individuals on individuals’ willingness to believe negative information.Here,ηdenotes the intensity of the effect of the proportion of globally vaccinated individuals on individuals’willingness to believe negative information;0≤α ≤1 and 0≤η ≤1.
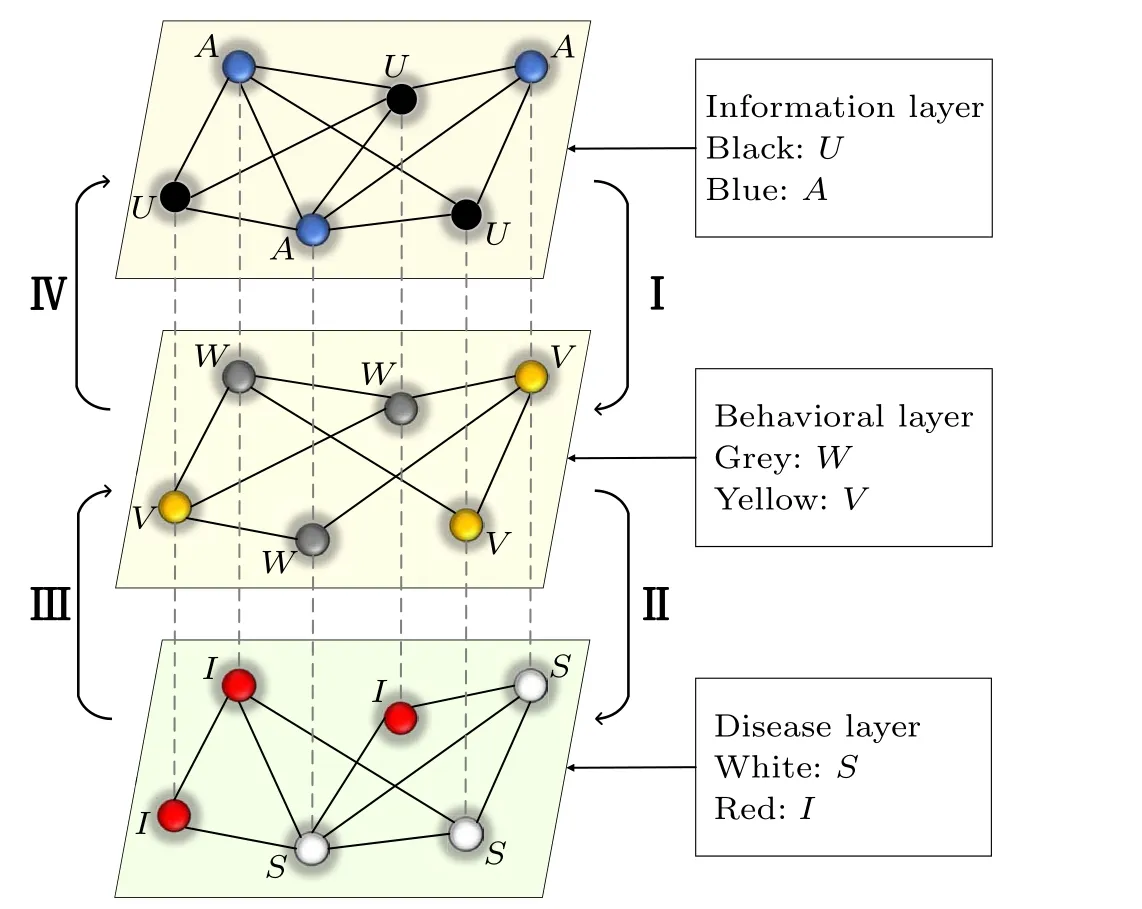
Fig.1.The first layer is the information layer: black represents individuals with unknown negative information(U),and blue represents individuals with known negative information(i.e.,rumors)(A).The second layer is the behavioral layer: grey represents unvaccinated individuals(W),and yellow represents vaccinated individuals(V).The third layer is the disease layer:white represents susceptible individuals(S),and red represents infected individuals(I).
Assumption 2 In the behavioral layer,the vaccination behavior process is described by theWVWmodel, which includes two states,WandV.The probability of vaccination for individuals who do not know negative information about the vaccine isθU,whereθU=θ,and the probability of vaccination for individuals who do know negative information isθA.The probability of individuals in theAstate receiving vaccination is influenced by two factors: the influence of negative information, i.e., as in effect I in Fig.1, and the influence of disease severity(local and global),i.e.,as in effect III in Fig.1.
(i)Effects of negative information about vaccines(effect I).In this paper,individuals who learn negative information related to vaccines, such as being told that the vaccine is not effective, that vaccination will cause adverse reactions,that vaccination causes cancer, and that vaccination changes human genes, will reduce the individual’s willingness to receive a vaccine.Here, we cite the parameterγas the impact factor of negative information on the willingness to receive a vaccine; therefore, the probability that the individual will be vaccinated due to negative information about vaccines isγθ,where 0≤γ ≤1.

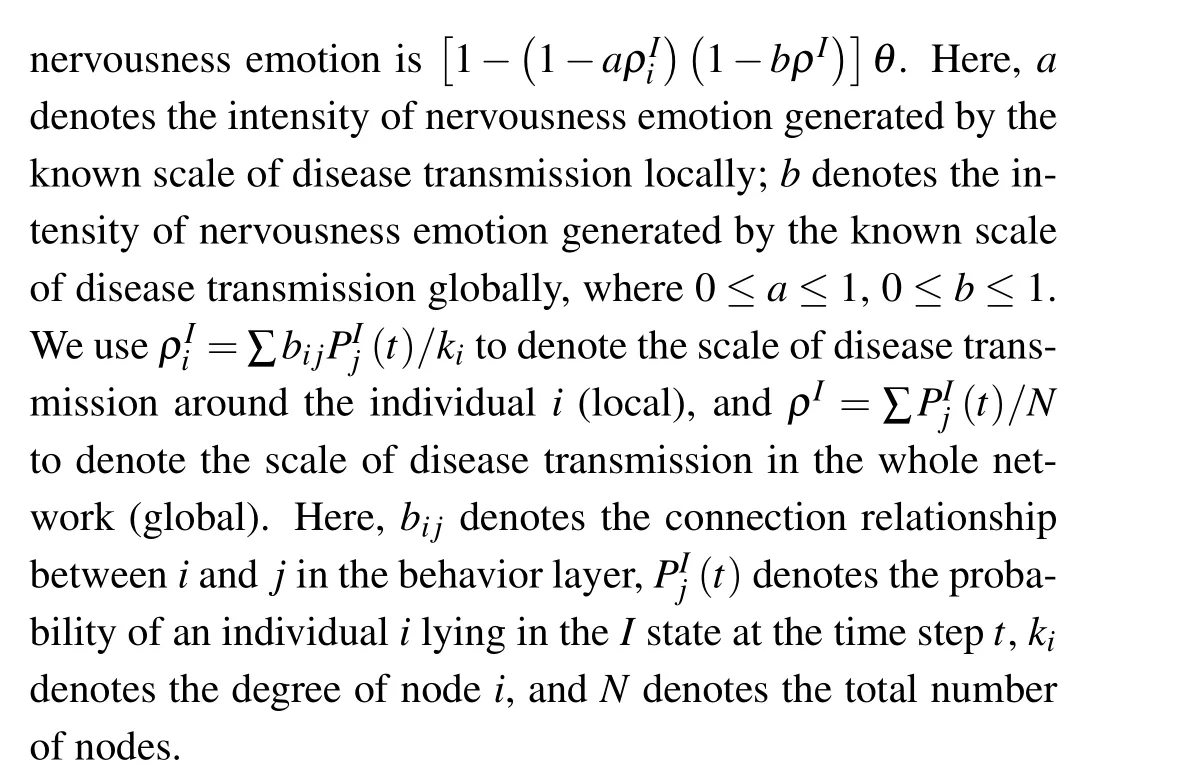
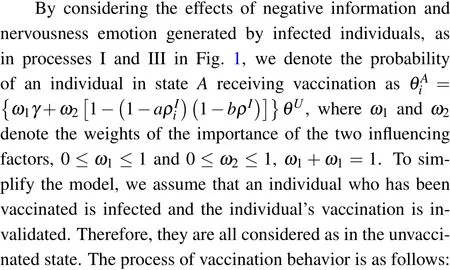
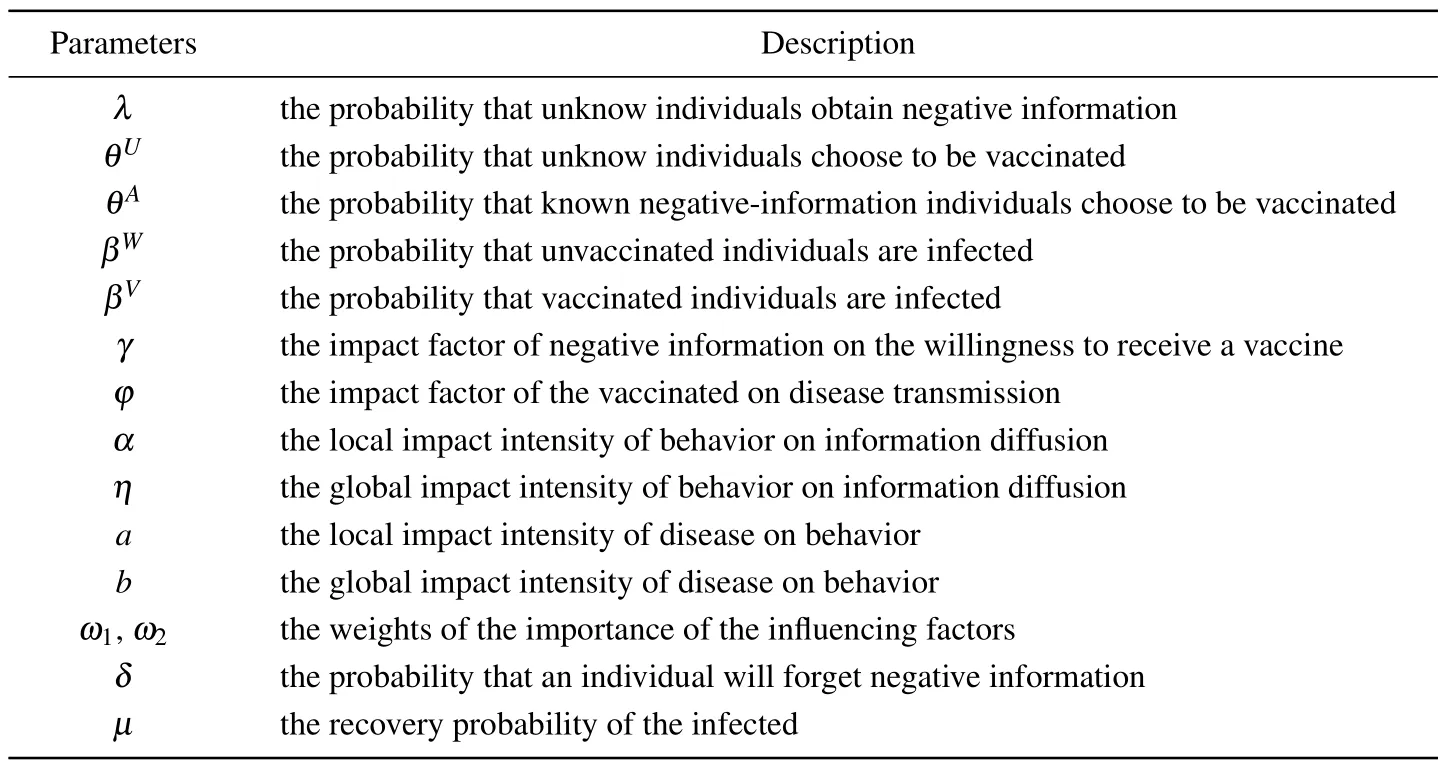
Table 1.The parameters of the model.
Assumption 3 In the disease layer,theSISdisease transmission model is used to analyze the disease transmission process,and the presence or absence of vaccination in the behavioral layer of the model will affect the susceptibility of individuals in the disease layer, as in effect II in Fig.1.Let the disease transmission rate beβ, the susceptibility of unvaccinated individuals beφ0=1, and the susceptibility of vaccinated individuals beφ1=φ, whereφrepresents the impact factor of the vaccinated on the disease transmission,0≤φ ≤1.Therefore,note that the probability of an unvaccinated susceptible individual being infected when in contact with a neighbor in an infected state isβW, whereβW=φ0β=β.Note that the probability of a vaccinated susceptible individual being infected when in contact with a neighbor in an infected state isβV,whereβV=φ1β=φβ.Whenφ=0 andβV=0,it means that the vaccinated individual must not be infected;however, in real life, even if the vaccinated individual is still infected,the vaccination behavior only reduces the risk of infection.Therefore, this paper does not consider the fully immune state;whenφ=1 andβV=β,it means that vaccination has no effect on the disease infection rate.In addition,individuals in the infected state revert to the susceptible state with a probabilityµ.The disease transmission process is as follows:
Assumption 4 To simplify the model, it is assumed that when an individual is infected, he or she is immediately informed of the negative information.Therefore, there are two ways for an individual to obtain information: one is to be informed at the information layer; the other is to self-perceive after being infected.In addition,when an individual who has been vaccinated is infected,the individual’s vaccination is invalidated;therefore,all are considered to be in an unvaccinated state.The meaning of each important parameter involved in the propagation of the model is shown in Table 1.In our simulation section we will focus on analyzing the effects of these parameters.
3.MMCA theoretical analysis
Theoretically, the MMCA is used to further understand the interactions between the network processes at each layer.The nodes of each layer of the network in this model correspond to one another and,according to the propagation process of each layer of the network described in Section 2,there are a total of eight states of mutual coupling, namely,UWS,UWI,UVS,UVI,AWS,AWI,AVS, andAVI.From Assumption 4,we consider that once an individual is infected,he or she will immediately know negative information related to vaccines,i.e., in the information layer, the individual will change from stateUto stateAwith probability 1.When a vaccinated individual is infected,we consider that the protection effect of the vaccine disappears and the individual immediately changes to the unvaccinated state,i.e.,in the behavior layer,the individual will change from stateVto stateWwith probability 1;therefore,UWI,UVI,andAVIare directly transformed to the stateAWIwith probability 1.In summary, there are five effective states, namely,UWS,UVS,AWS,AVS, andAWI.The state transformation probability tree built using MMCA is shown in Fig.2.
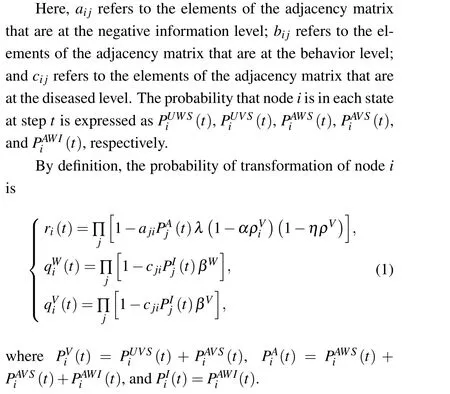
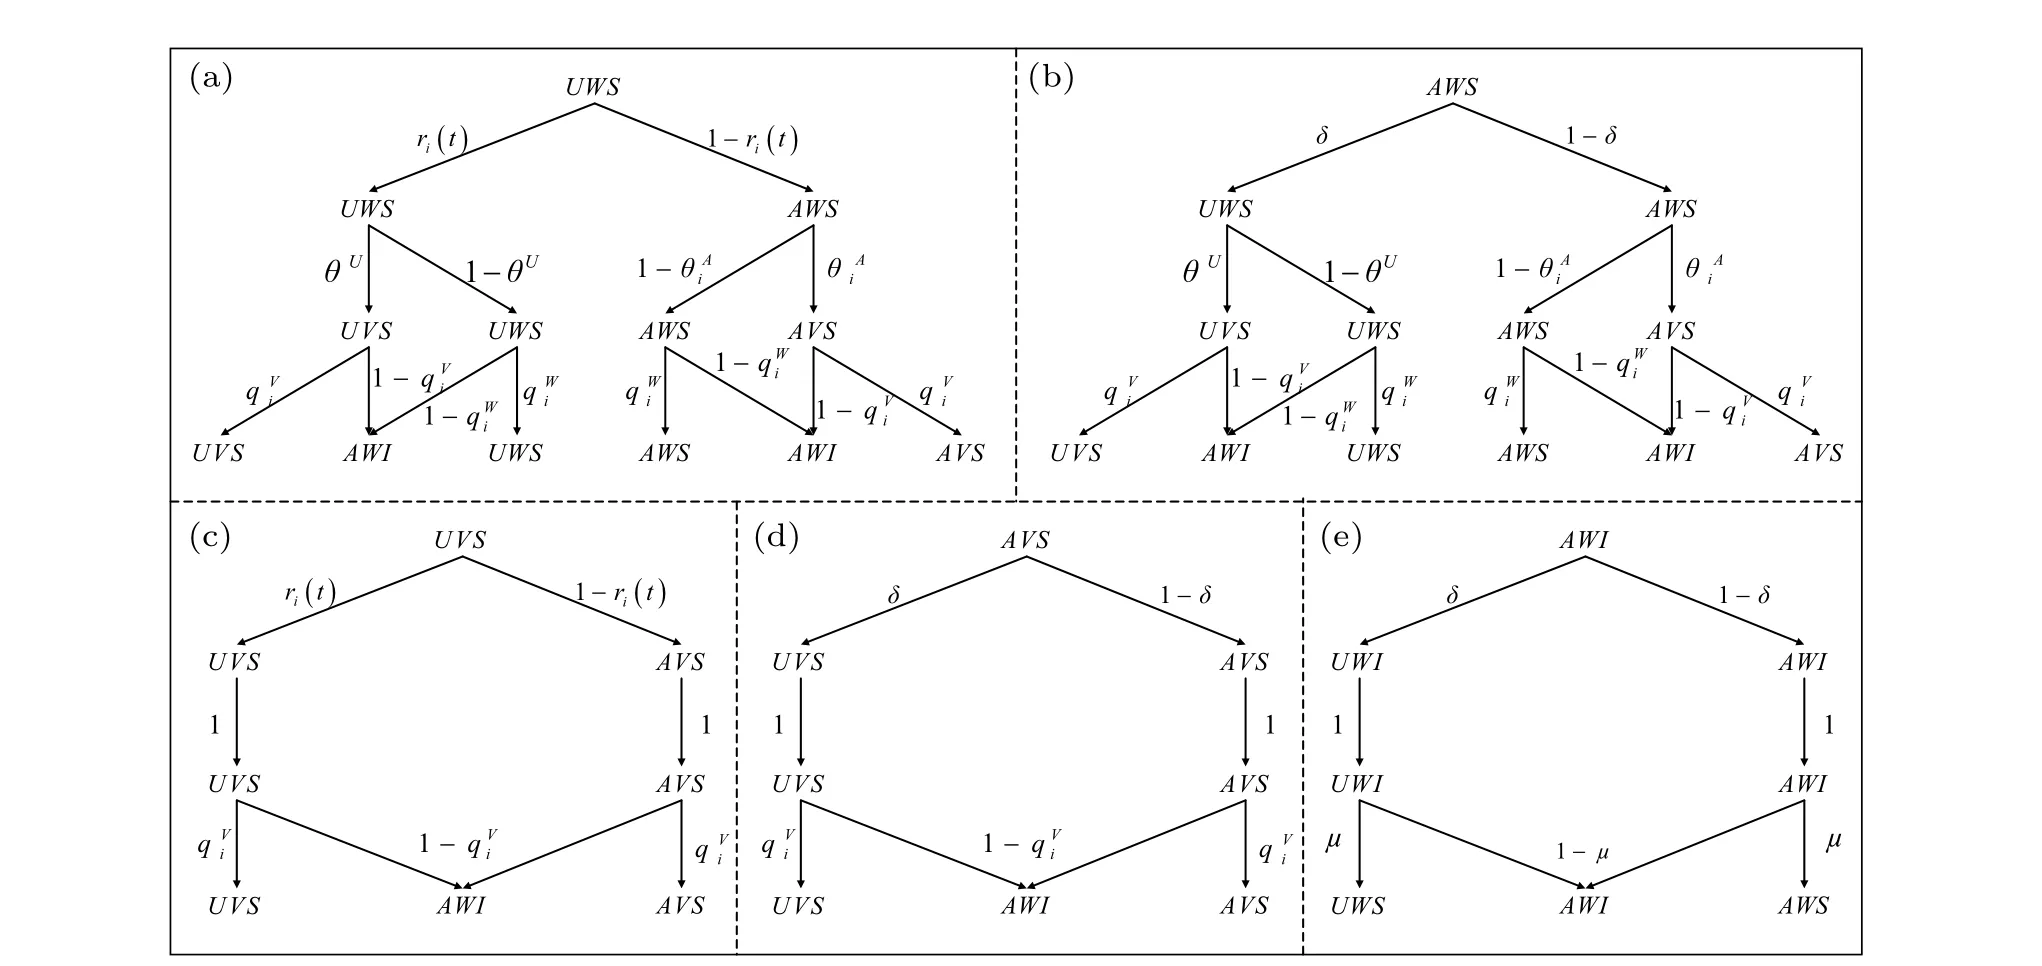
Fig.2.The transition probability tree of five possible states in the model.Here,ri refers to the probability that the node in state U does not obtain information from its neighbors in state A;qWi refers to the probability that without vaccination nodes are not infected by their neighbors;and qVi refers to the probability that vaccinated nodes are not infected by their neighbors.
According to the probability transfer process of the five states in Fig.2,we can use the MMCA to establish the probability transfer equation
When the system reaches a steady state,it satisfies the constant equation
Combining Eq.(2)-(4)to simplify,the equation is obtained as follows:
4.Simulation analysis
In this section, we focus on analyzing the effects of the parameters affecting disease transmission in the model on the disease transmission threshold and the scale of disease transmission.In the simulation, Monte Carlo (MC) simulations are used to validate the usability of our proposed model.For this three-layer network model that considers Barab´asi-Albert(BA) scale-free networks, the size of the number of network nodes was fixed atN=5000 for consistency.Since the average degree〈k〉=6 for BA networks is very similar to the average shortest path length of realistic Facebook,[30,45,46]the average degree was set to 6 for all experiments.All the simulation results were obtained by averaging 40 iterations.Here,ρA,ρV,andρIare the densities of individuals in statesA,V, andI,respectively,and their initial values areρA=ρV=ρI=0.3.
First,we analyze the relationship between the rate of negative information diffusionλand the rate of disease transmissionβand the scale of disease transmissionρI.As can be seen in Fig.3, asλincreases, the color becomes lighter andρIis greater,which is due to the fact that individuals who know negative information are less likely to receive vaccination,which can promote disease transmission.The parameter set in Fig.3(a) indicatesω1=0, where the vaccination behavior of individuals will only be influenced by the disease layer; the parameter set in Fig.3(b) indicatesω2=0, where the vaccination behavior of individuals will only be influenced by the information layer; the parameter set in Fig.3(c) indicatesω1̸=0 andω2̸=0, where the vaccination behavior of individuals will be influenced by both the information layer and the disease layer.Comparison of(a)and(c)shows thatρIin Fig.3(c)is smaller than in Fig.3(a),and comparison of(b)and(c)shows thatρIin Fig.3(c)is smaller than in Fig.3(b).The comparison shows thatρIis the smallest in Fig.3(c),indicating thatω1̸=0 andω2̸=0, i.e., the vaccination behavior of individuals will be influenced by both the information layer and the disease layer, and it can better inhibit the transmission of disease.In summary,managers should control the transmission of negative information at an early stage and take measures to increase the willingness of individuals to adopt vaccination behavior,thereby playing a key role in controlling the spread of the disease by the relevant authorities.

Fig.3.The functional relationship between the scale of disease transmission ρI and the disease transmission rate β and the negative-information diffusion rate λ at a steady state.The colors represent the scale of disease transmission ρI, where the parameters are set as the information forgetting rate δ =0.4,the disease recovery rate µ =0.6,the vaccination rate θ =0.6,the influence of the vaccination factor γ =0.6,and the influence of the infection rate factor φ =0.2: (a)ω1=0,ω2=1,(b)ω1=1,ω2=0,and(c)ω1=0.5,ω2=0.5.All the results were obtained by averaging 40 independent runs.
In Fig.4,we analyze the relationship between the scale of disease transmissionρIand the disease transmission rateβat a steady state for different rates of negative-information diffusionλ.Unlike most previous studies that considered the direct influence of information on disease transmission, this study established a three-layer network model.Here, the information layer first affects the behavioral choices of individuals and then affects disease transmission, which is closer to reality;therefore,it can be seen from Fig.4 that the disease transmission thresholdβCwill not be affected by negative-information transmission,and the scale of disease transmissionρIwill be affected by negative-information transmission.The parameter set in Fig.4(a) indicatesω1=0, where the vaccination behavior of individuals will only be influenced by the disease layer; the parameter set in Fig.4(b) indicatesω2=0, where the vaccination behavior of individuals will only be influenced by the information layer; the parameter set in Fig.4(c) indicatesω1̸=0 andω2̸=0, i.e., that the vaccination behavior of individuals will be influenced by both the information layer and the disease layer.Comparison of Figs.4(a)-4(c) shows thatβCin Fig.4(c) is greater than in Fig.4(a) and 4(b), andρIin Fig.4(c)is smaller than in Figs.4(a)and 4(b).Because in Fig.4(c),ω1̸=0 andω2̸=0, i.e., the vaccination behavior of individuals will be influenced by both the information layer and the disease layer, at this time, with the increase in the negative information diffusion rate, the scale of disease transmission increases, and the resulting nervousness will increase the willingness to vaccinate.Therefore,it will increase the difficulty of disease transmission and reduce the scale of disease transmission.
Next, we analyze the impact of vaccination ratesθand disease transmission ratesβon disease transmission.As can be seen in Fig.5,the disease transmission threshold gradually increases and the scale of disease transmissionρIgradually decreases as the vaccination rate increases,suggesting that the vaccination behavior can effectively inhibit disease transmission.It can also be seen that when vaccination ratesθare small,ρIsignificantly as the rate of disease transmission increases, at which point there is a large-scale outbreak of disease.The parameter set in Fig.5(a) indicatesω1=0, where the vaccination behavior of individuals will only be influenced by the disease layer; the parameter set in Fig.5(b) indicatesω2= 0, where the vaccination behavior of individuals will only be influenced by the information layer;the parameter set in Fig.5(c) indicatesω1̸=0 andω2̸=0, i.e., that the vaccination behavior of individuals will be influenced by both the information layer and the disease layer.When we compare Figs.5(a)-5(c),it is clear that when individual vaccination behavior is chosen with both information and disease in mind,the scale of disease transmission is reduced, suggesting that information plays as important a role as vaccination behavior in disease prevention and control.
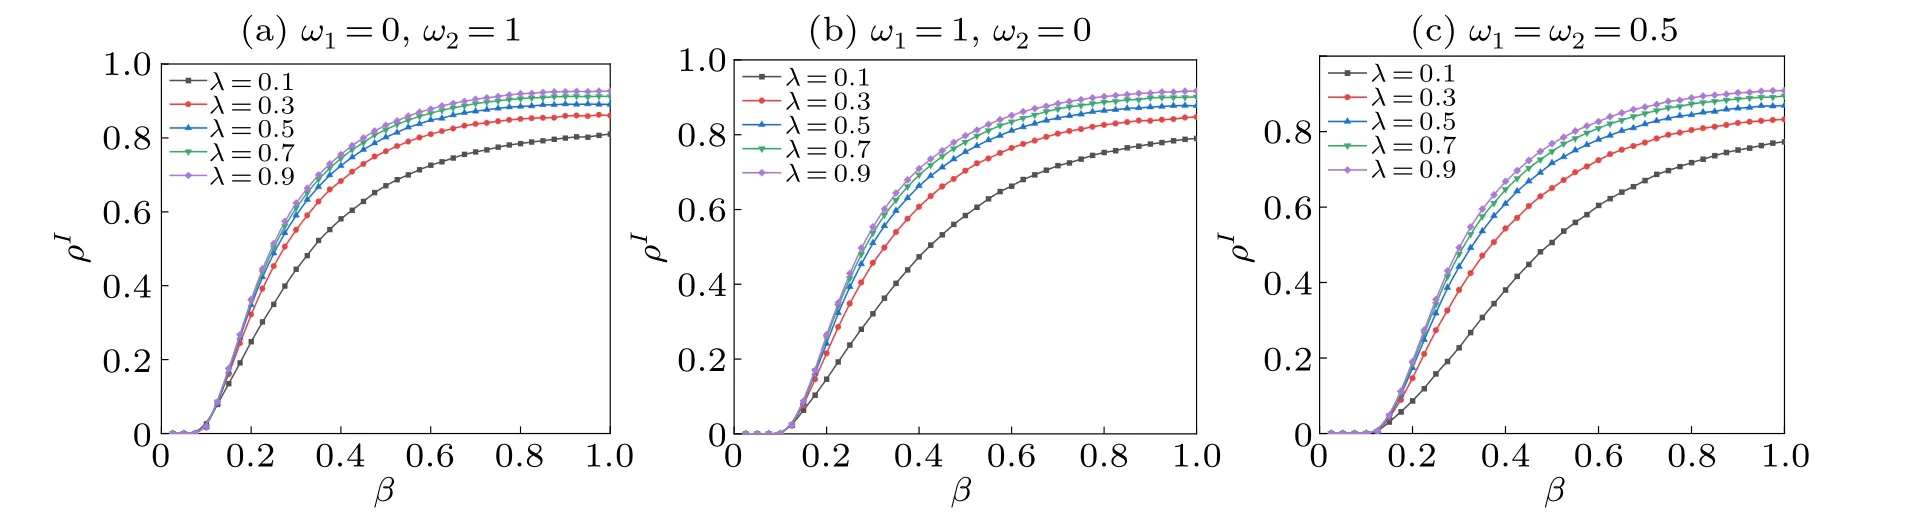
Fig.4.The functional relationship between the scale of disease transmission ρI and the disease transmission rate β at a steady state for different rates of negative-information transmission λ.The colors of the curves represent the information transmission rates λ,where the parameters are set as the information forgetting rate δ =0.4, the disease recovery rate µ =0.6, the vaccination rate θ =0.6, the influence of the vaccination factor γ=0.6,and the influence of the infection rate factor φ=0.2: (a)ω1=0,ω2=1,(b)ω1=1,ω2=0,and(c)ω1=0.5,ω2=0.5.All the results were obtained by averaging 40 independent runs.

Fig.5.The scale of disease transmission ρI at the steady state as a function of the disease transmission rate β for different vaccination rates θ.The colors represent the scale of disease transmission ρI, where the parameters are set as the information forgetting rate δ =0.4, the disease recovery rate µ =0.6, the negative-information transmission rate λ =0.6,the influence of the vaccination factor γ =0.6,and the influence of the infection rate factor φ =0.2: (a)ω1=0,ω2=1,(b)ω1=1,ω2=0,and(c)ω1=0.5,ω2=0.5.All the results were obtained by averaging 40 independent runs.
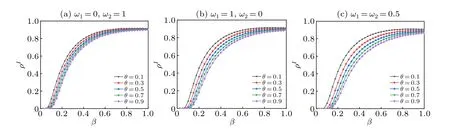
Fig.6.The scale of disease transmission ρI at a steady state as a function of the disease transmission rate β for different vaccination rates θ.The color of the curve represents the vaccination rate θ, where the parameters are set as the information forgetting rate δ =0.4, the disease recovery rate µ =0.6, the negative-information transmission rate λ =0.6,the influence of the vaccination factor γ =0.6,and the influence of the infection rate factor φ =0.2: (a)ω1=0,ω2=1,(b)ω1=1,ω2=0,and(c)ω1=0.5,ω2=0.5.All the results were obtained by averaging 40 independent runs.
Next, we analyze the relationship between the scale of disease transmissionρIand the disease transmission rateβat a steady state for different vaccination ratesθ.As can be seen in Fig.6, both the scale of disease transmissionρIand the threshold of disease transmissionβCare affected by the vaccination rate.As the vaccination rateθincreases,βCgradually increases andρIgradually decreases;when the disease transmission rateβis large, such as when the transmission rate is close to 1, it means that the disease transmission is repaid, at which time the role of the vaccination rate decreases.The parameter set in Fig.6(a)indicatesω1=0,where the vaccination behavior of individuals will only be influenced by the disease layer; the parameter set in Fig.6(b) indicatesω2=0, where the vaccination behavior of individuals will only be influenced by the information layer; the parameter set in Fig.6(c) indicatesω1̸=0 andω2̸=0,where the vaccination behavior of individuals will be influenced by both the information layer and the disease layer.Comparison of Figs.6(a)and 6(c)shows thatβCin Fig.6(c)is greater than in Fig.6(a),andρIin Fig.6(c)is smaller than in Fig.6(a).Comparison of Figs.6(b)and 6(c)shows thatβCin Fig.6(c)is greater than in Fig.6(b),andρIin Fig.6(c)is smaller than in Fig.6(b).Through comparison,we find that when individuals choose to consider both information and disease in their vaccination behavior,the threshold of disease transmission increases and the scale of disease transmission decreases.The reason for this is that as information and disease simultaneously influence individual behavior, the severity of the disease makes people nervous,thus increasing their willingness to be vaccinated and slowing the transmission of disease.

Fig.7.The functional relationship between the scale of disease transmission ρI at a steady state and the disease transmission rate β at different γ.The colors of the curves represent γ, where the parameters are set as the information forgetting rate δ =0.2,the disease recovery rateµ=0.6,the negative-information transmission rate λ =0.6, the vaccination rate θ =0.6,and the influence of the infection rate factor φ =0.3,ω1=0.8,and ω2=0.2.All the results were obtained by averaging 40 independent runs.
In Fig.7,the main analysis is the effect of differentγon the scale of disease transmissionρI.Theγindicates the inhibition of vaccination behavior when individuals are informed of negative information,which indirectly affects disease transmission.The parametersω1̸=0 andω2̸=0 set in Fig.7 indicate that the vaccination behavior of individuals will be influenced by both the information layer and the disease layer.It can be seen from Fig.7, asγincreases, the disease transmission thresholdβCgradually increases and the scale of disease transmissionρIgradually decreases; we can see thatγhas more of an effect on the scale of disease transmission and has less influence on the disease transmission threshold.In summary,γfirstly influences individual behavior, and has an indirect influence on disease transmission; the largerγis,the better disease transmission can be controlled.
Next, we analyze the relationship between the vaccine impact factorφand the disease transmission rateβand the scale of disease transmissionρI.From the previous analysis,it is clear that the inhibition of disease transmission is better when the influence of both information and disease is considered for the vaccination behavior; therefore, the parametersω1=ω2=0.5 are set in Fig.8.As can be seen in Fig.8,fixingφ,as the disease transmission rate increases,ρIincreases.When the disease transmission threshold is exceeded,the disease transmission rate is fixed,and asφincreases,the scale of disease transmission increases.This is due toφlarger, thus,the lower the effectiveness of the vaccine and the greater the susceptibility of the individual,which will promote transmission of the disease.

Fig.8.The scale of disease transmission ρI at a steady state as a function of the disease transmission rate β and vaccine impact factor φ.The color of the curve represents the scale of disease transmission ρI,where the parameters are set as the information forgetting rate δ =0.4,the disease recovery rate µ =0.6, the negative-information transmission rate λ =0.3, the vaccination rate θ =0.6, and the influence of the vaccination factor γ=0.6,ω1=0.5,and ω2=0.5.All the results were obtained by averaging 40 independent runs.
In Fig.9, the relationship between the scale of disease transmissionρIat the steady state and the disease transmission rateβis analyzed for different vaccine impact factorsφ.The specific parameter settings of Fig.9 are the same as those of Fig.7, i.e.,ω1=ω2= 0.5.As can be seen from Fig.9, we can see thatφgreatly affects the disease transmission threshold and the scale of disease transmission in the process of disease transmission,with the disease transmission threshold gradually decreasing and the scale of disease transmission increasing asφincreases.As can be seen from the graphβV=φ1β=φβ,whenφis smaller,this means that the vaccination behavior is more effective, i.e., the susceptibility of vaccinated individuals is reduced, and the scale of disease transmission is smaller.Whenφis larger,this means that the vaccination behavior is less effective, which may be due to reasons such as the vaccine is not very protective or individuals do not regularly enhance vaccine protection,resulting in a high possibility of individuals still being infected after vaccination,and the scale of disease transmission is larger.Therefore, to increase vaccine effectiveness, individuals should be given booster vaccines regularly and in time to strengthen the protective effect of vaccines,which can effectively reduce the scale of disease transmission.
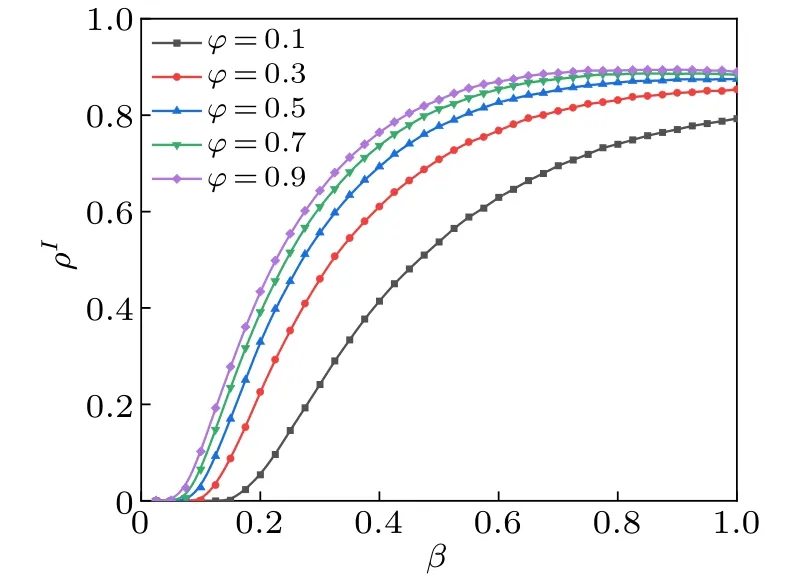
Fig.9.The relationship between the scale of disease transmission ρI at a steady state and the rate of disease transmission β for different vaccine impact factors φ.The color of the curve represents vaccine impact factors φ,where the parameters are set as the information forgetting rate δ =0.4,the disease recovery rate µ =0.6,the negative-information transmission rate λ =0.3, the vaccination rate θ =0.6, and the influence of the vaccination factor γ =0.6, ω1 =0.5, and ω2 =0.5.All the results were obtained by averaging 40 independent runs.
In Fig.10,when the intensity of the effects of vaccination behavior on the willingness of individuals to believe negative information varies, the effect of vaccination behavior on the scale of disease transmissionρIis analyzed.Figure 10(a)represents the effect of the local vaccination impact intensityαon the scale of disease transmission, and figure 10(b) represents the effect of the global vaccination impact intensityηon the scale of disease transmission.From Fig.10, it can be seen that the larger the intensity of the influence, the smallerρIis.When we compare Figs.10(a)and 10(b),it can be seen thatρIis mainly influenced by the impact intensityη.Since,in practice,individuals tend to obtain information through the internet, when individuals learn about the vaccination information of their neighbors around them, they are more likely to ignore this influence.However,asβincreases,individuals pay more attention to their surroundings;at this time,the vaccination situation around individuals is more likely to affect the diffusion of negative information,and the impact of vaccination behavior in the entire network gradually disappears.In summary, it can be seen that global vaccination has a greater impact on the model, and these results are more in line with reality.When the rate of disease transmission is small,the impact of global vaccination on the transmission of information should be increased,and once the disease is out of the controllable range,the impact of local vaccination on the transmission of information should be increased to suppress the transmission of disease more effectively.
In Fig.11,when the effect of disease severity on individual vaccination behavior varies,the scale of disease transmissionρIis analyzed.Figure 11(a)represents the effect of local tensionaon the scale of disease transmission,and figure 11(b)represents the effect of global tensionbon the scale of disease transmission.In Fig.11, it can be seen that as local tensionaand global tensionbincrease,the scale of disease transmission decreases.This indicates that the largeraandbare, the more sensitively individuals will perceive the severity of the disease and the greater the degree of tension, which will persuade individuals to receive vaccination and reduce the probability of individuals being infected and thus can better control the transmission of the disease.This effect fades away when the disease transmission rate is large and the disease is difficult to control.Comparison of Figs.11(a) and 11(b) shows thatρIis mainly influenced bya,due to the fact that,in practice, the disease is transmitted through contact between individuals, and an increase in the scale of disease transmission around them is more likely to cause individuals to be nervous about the disease.Therefore, to prevent themselves from becoming infected,they will increase their willingness to receive vaccination, which can better inhibit the transmission of the disease.In summary,it is clear that local disease severity has a greater impact on vaccination,and these results are more in line with reality.We should increase the willingness of individuals to be vaccinated,thereby suppressing the transmission of disease more effectively.

Fig.10.The relationship between the scale of disease transmission ρI at a steady state and the rate of disease transmission β for different α and η.Here,the parameters are set as the information forgetting rate δ =0.2,the disease recovery rate µ =0.6,the negative-information transmission rate λ =0.3,the vaccination rate θ =0.6,the influence of the vaccination factor γ =0.6,and the influence of the infection rate factor φ =0.2.[(a)and(b)]ω1 =0.5,ω2 =0.5.All the results were obtained by averaging 40 independent runs.

Fig.11.The relationship between the scale of disease transmission ρI at a steady state and the rate of disease transmission β for different a and b.The color of the curve represents a, where the parameters are set as the information forgetting rate δ =0.2,the disease recovery rateµ=0.6,the negative-information transmission rate λ =0.6, the vaccination rate θ =0.6,the influence of the vaccination factor γ=0.6,and the influence of the infection rate factor φ =0.2.[(a)and(b)]ω1=0.5,and ω2=0.5.All the results were obtained by averaging 40 independent runs.
It can be seen from the analysis of Figs.10 and 11 that local and global conditions have opposite effects on different layers;the negative information diffuses in the virtual network,which mainly has the global impact,and the disease transmits in the actual contact network,which mainly has the local impact.For the information layer, the effect of the global intensityηhas a more obvious impact on the scale of disease transmission.This is because,in daily life,individuals mainly obtain information through the network.When the information about the global vaccination proportion is obtained from the network, individuals are more likely to have a good impression of vaccination behavior,which will inhibit the diffusion of negative information, thereby inhibiting the transmission of disease.For the behavioral layer,the local nervousnessahas a more obvious impact on the scale of disease transmission,which is because the disease can only be transmitted through mutual contact between individuals.When individuals learn about the global disease severity, they believe that their chances of being exposed to the infected individual are smaller; when individuals learn about the severity of the disease around them,they believe that their chances of being infected increase, which reinforces the nervousness of the disease.Thus, the effect of nervousness generated by local disease severity is more pronounced.Therefore,the effects of the resultant local nervousness are more obvious.In addition, it can be seen from Figs.10 and 11 that when the disease transmission rateβexceeds a certain value, the local and global impacts on the scale of disease transmission will be smaller.In summary, we should curb the diffusion of negative information and increase the proportion of vaccination when the rate of disease transmission is small to better control the transmission of disease.
5.Conclusion
In this paper,we established a three-layer network model to analyze the dynamic process of the co-evolution of information and behavior and disease transmission,and we considered four influential relationships between adjacent layers.Firstly,in the negative-information diffusion process,the influence of the behavioral layer on the initiative of individuals to believe negative information is considered.Secondly, in the behavioral layer, the individual vaccination behavior is described,and the probability of the individual’s choice of vaccination behavior is influenced by two factors: the influence of negative information,and the influence of disease severity,by considering local and global individuals’ nervousness about the disease, to respond to the real influence of disease severity on behavior.Finally, in the disease layer, individual susceptibility is considered to be influenced by vaccination behavior.The model is analyzed using MMCA to obtain probability trees and state transition equations to derive disease transmission thresholds.The simulation analysis shows the following results.
(i) The negative information diffusion is less influenced by local vaccination behavior and is mainly influenced by global vaccination behavior, the largerη, resulting in less willingness of individuals to believe negative information and slower negative-information diffusion.
(ii)Vaccination behavior is less influenced by global disease conditions and is mainly influenced by local disease conditions.The largerais,the stronger the tension of individuals and the higher the vaccination rate.
(iii) The disease transmission threshold is directly influenced by vaccination behavior,the larger the vaccination rate,the larger the threshold.
(iv) The scale of disease transmission is influenced by both negative information and vaccination behavior;reducing the diffusion of negative information and lowering the influence of negative information on behavior will reduce the scale of disease transmission.
Finally, it is found that when individual vaccination behavior considers the influence of both information and disease,it can increase the threshold of disease transmission and reduce the scale of disease transmission,which has a good effect on inhibiting disease transmission.Therefore,the vaccination behavior should be increased to enhance the role of the vaccine,so that people can take appropriate protective measures in time to effectively prevent being infected.In this paper,from the perspective of emergency management, we analyzed the mutual influence relationship between information dissemination,vaccination behavior and disease transmission,and measured the specific amount of the coupled influence process between the layers in the model via the model’s parameter simulation,which can provide a reference basis for the behavioral measures of emergency managers.
In addition, in the process of infectious disease prevention and control, not only will the relevant negative information be disseminated in the social network, but some positive information will be disseminated in large quantities.The dissemination of this type of information will also be related to the individual’s vaccination behavior,which will further affect the process of disease prevention and control.Over time, the validity of the information will change, which will also have an impact on individual behavioral measures,and we will also include the influence of time scales in our future research to further deepen the analysis of the influencing factors of the disease transmission process.Also, in the study process of transmission dynamics, besides the existence of pairwise interactions, there are often higher-order interactions, and migration between group communities affects the disease transmission process.Based on the analysis of the studies by Nieet al.[47]and Nieet al.,[48]in the future,we will try to build a better model to take into account the influence of these factors.
Acknowledgments
Project supported by the National Natural Science Foundation of China (Grant Nos.72174121 and 71774111),the Program for Professor of Special Appointment (Eastern Scholar) at Shanghai Institutions of Higher Learning,and the Natural Science Foundation of Shanghai (Grant No.21ZR1444100).

- Chinese Physics B的其它文章
- Does the Hartman effect exist in triangular barriers
- Quantum geometric tensor and the topological characterization of the extended Su–Schrieffer–Heeger model
- A lightweight symmetric image encryption cryptosystem in wavelet domain based on an improved sine map
- Effects of drive imbalance on the particle emission from a Bose–Einstein condensate in a one-dimensional lattice
- A new quantum key distribution resource allocation and routing optimization scheme
- Coexistence behavior of asymmetric attractors in hyperbolic-type memristive Hopfield neural network and its application in image encryption